Using Water Balance to Analyze Water Availability for
Communities ( A Case Study in Some Areas of Bengawan Solo
Watershed)
Alif Noor Anna*, Kuswaji Dwi Priyono, Suharjo, Yuli Priyana
)DNXOWDV*HRJUDÀ8QLYHUVLWDV0XKDPPDGL\DK6XUDNDUWD Jl. A Yani Tromol Pos 1 Pabelan Surakarta
*) Corresponding author (e-mail: [email protected])
Abstract. 7KLV VWXG\ DLPHG D WR GHWHUPLQH WKH JHQHUDO ZDWHU EDODQFH DW WKH 8SVWUHDP
DQG0LGVWUHDPRI%HQJDZDQ6ROR:DWHUVKHGE\XVLQJ7KRUQWKZDLWH0DWKHUPRGHODQGE WR GHWHUPLQH WKH IXOÀOOPHQW RI GRPHVWLF ZDWHU GHPDQG LQ WKH 8SVWUHDP DQG 0LGVWUHDP RI %HQJDZDQ6ROR:DWHUVKHG3UHYDLOLQJFOLPDWHFKDQJHKDVDIIHFWHGWKHFRQGLWLRQRIZDWHUVRXUFH LQ8SVWUHDPDQG0LGVWUHDPRI%HQJDZDQ6ROR:DWHUVKHG2QHRIWKHLPSDFWVZDVH[WUHPH ÁXFWXDWLRQRIPHWHRURORJLFDOZDWHUDYDLODELOLW\WKDWPLJKWFDXVHÁRRGDQGGURXJKW6XUYH\ZDV VHOHFWHGDVWKHUHVHDUFKPHWKRGZKLOHGHVFULSWLYHTXDQWLWDWLYHPHWKRGZDVXVHGIRUGDWDDQDO\VLV 7KH ÀQGLQJV LQGLFDWHG WKH GLIIHUHQFH EHWZHHQ SUHFLSLWDWLRQ DQG FRUUHFWHG HYDSRWUDQVSLUDWLRQ 3(3 DW WKH 8SVWUHDP DQG 0LGVWUHDP RI %HQJDZDQ 6ROR :DWHUVKHG ZDV EHWZHHQ PPWRPP7KHKLJKHVWYDOXHZDVREWDLQHGE\%DPEDQJ6XEZDWHUVKHGDQGWKHORZHVW ZDV:LURNR7HPRQ6XEZDWHUVKHG3RVLWLYHYDOXHLQGLFDWHGWKHZDWHUVXUSOXVZKLOHQHJDWLYH YDOXHLQGLFDWHGZDWHUGHÀFLW'RPHVWLFZDWHUGHPDQGIRUORFDOFRPPXQLWLHVZDVLQWKHUDQJHRI OLWHUVWROLWHUVDQGWKHOHYHORIZDWHUDYDLODELOLW\YDULHGQDPHO\IXOÀOOHG DQGXQIXOÀOOHG
Keywords: *HQHUDO ZDWHU EDODQFH ZDWHU DYDLODELOLW\ ZDWHU GHPDQG %HQJDZDQ 6ROR
:DWHUVKHG,QGRQHVLD
Abstrak.3HQHOLWLDQLQLEHUWXMXDQDXQWXNPHQHQWXNDQQHUDFDDLUXPXPGL+XOXGDQWHQJDK
VXQJDL%HQJDZDQ6ROR'$6GHQJDQPHQJJXQDNDQPRGHO7KRUQWKZDLWH0DWKHUGDQEXQWXN PHQHQWXNDQSHPHQXKDQNHEXWXKDQDLUGRPHVWLNGL+XOXGDQWHQJDKVXQJDL%HQJDZDQ6ROR '$6%HUODNXSHUXEDKDQLNOLPWHODKPHPSHQJDUXKLNRQGLVLVXPEHUDLUGL+XOXGDQWHQJDK VXQJDL %HQJDZDQ 6ROR '$6 6DODK VDWX GDPSDN DGDODK ÁXNWXDVL HNVWULP NHWHUVHGLDDQ DLU PHWHRURORJL\DQJPXQJNLQPHQ\HEDENDQEDQMLUGDQNHNHULQJDQ6XUYHLWHUSLOLKVHEDJDLPHWRGH SHQHOLWLDQ VHGDQJNDQ PHWRGH GHVNULSWLI NXDQWLWDWLI GLJXQDNDQ XQWXN DQDOLVLV GDWD 7HPXDQ PHQXQMXNNDQSHUEHGDDQDQWDUDFXUDKKXMDQGDQGLNRUHNVLHYDSRWUDQVSLUDVL3(3GL+XOXGDQ WHQJDKVXQJDL%HQJDZDQ6ROR'$6DGDODKDQWDUDPPNHPP1LODLWHUWLQJJL GLSHUROHKROHK%DPEDQJ6XE'$6GDQWHUHQGDKDGDODK:LURNR7HPRQ6XE'$61LODLSRVLWLI PHQXQMXNNDQ VXUSOXV DLU VHPHQWDUD QLODL QHJDWLI PHQXQMXNNDQ GHÀVLW DLU NHEXWXKDQ DLU GRPHVWLNEDJLPDV\DUDNDWORNDOGLNLVDUDQOLWHUXQWXNOLWHUGDQWLQJNDW NHWHUVHGLDDQDLUEHUYDULDVL\DLWXWHUSHQXKLGDQWLGDNWHUSHQXKL
Kata kunci:QHUDFDDLUXPXPNHWHUVHGLDDQDLUNHEXWXKDQDLU%HQJDZDQ6ROR'DHUDK$OLUDQ
6XQJDL,QGRQHVLD
1. Introduction
Climate change had been one of national strategic issues that challenged the Indonesian government in the efforts to minimize its negative impacts. Despite
since the early days of the Earth, the process is escalated that causes climate change and other adverse impacts on the Earth and life within (Sakuntaladewi and Wibowo, 2015). Numbers of evidences have
Nations )UDPHZRUN &RQYHQWLRQ on &OLPDWH &KDQJH (UNFCCC). Their reports highlighted the immediate hazard of climate change such as the changes of precipitation pattern, rising temperatures, sea level rise, and extreme climate events. Those potential hazards threaten and affect the sustainability of community and natural system (National Defence Institute/ Lemhanas, 2014). One of natural systems
KLJKO\ LQÁXHQFHG E\ WKH FOLPDWH FKDQJH ZDV
watershed. However, climate changes had both positive and negative impacts on watershed. Generally, the Upstream and Midstream of Bengawan Solo Watershed endured adverse impact of climate change, including drought
DQGÁRRG
In a study, Foster and Ait-Kadi (2012)
UHDIÀUPHG WKDW FOLPDWH FKDQJH ZLOO FRQYH\ QHJDWLYH FRQVHTXHQFH RQ WKH VHFWRU RI
water resources and economic stability. The availability of water resources became a global warning that should be resolved immediately. Moreover, human interferences such as area development, population pressure, and rapid urbanization had worsened the
VLWXDWLRQ 6LPLODUO\ $GL FRQÀUPHG
that global climate change has provided evidences in Indonesia, particularly related with precipitation pattern. Extreme rainfall
IUHTXHQF\ DQG LQWHQVLW\ LQFUHDVHG WKH RFFXUUHQFH RI ÁDVK ÁRRG DQG ODQGVOLGH ,Q
addition, the elongated duration of the dry
VHDVRQ KDG FDXVHG GURXJKW IRUHVW ÀUHV DQG
degraded land. Luo, etal (2013) also suggested that the impacts of climate change could lead to volatility of hydrological cycle and water
TXDOLW\LQDZDWHUVKHG
Watershed is one of the determinants of water resources status in a given area. However, the condition of watersheds in Indonesia are commonly degraded over time (Miardini
DQG 6XVDQWL ,PSURSHU ZDWHUVKHG
management will have an adverse impact on its water resources status. There was a wide range of strategic issues regarding with water resources sector that should be addressed as an effort in response to global climate change at the Upstream and Midstream of Bengawan Solo Watershed. The strategic issues consisted of: (a) the water balance between the supply and the demand (water balance). Climate
change potentially threatened the decline of
ZDWHU VXSSO\ ÁRRGVDQG GURXJKWV WKXV WKH
vulnerability and risks should be recognized
VSHFLÀFDOO\ LQ RUGHU WR LGHQWLI\ LPSRUWDQW DGDSWDWLRQ PHDVXUHV E WKH LQDGHTXDWH
condition of water infrastructure that led to an increase of climate change risk on the water sector, and (c) the lack of technology implementation and inappropriate water resources management.
Rapid population growth resulted in higher demand for water resources. However, higher individual socio-economic status would be followed by higher consumption level including on water resources such as for trade and industrial activity. The necessity for water resources sector in urban areas was greater
LQ TXDQWLW\ LQ FRPSDUHG ZLWK UXUDO DUHDV ,W ZDV FRQÀUPHG E\ 9DUULVet al ZKR emphasized that rapid population growth in major cities had increased the demand for water resources, and uncontrolled exploitation would affect the water supply. To maintain water supply, water resources management
DQG SODQQLQJ ZDV UHTXLUHG LQFOXGLQJ E\ WKH
determination of regional water balance. This study aimed to determine the general water balance at the Upstream and Midstream of Bengawan Solo Watershed by using Thornthwaite-Mather model, and to determine
WKH OHYHO RI GRPHVWLF ZDWHU IXOÀOOPHQW LQ WKH
study area.
2. Research Methods a. Methods
Secondary analysis data was the method employed in this study and descriptive
TXDQWLWDWLYHPHWKRGZDVXVHGIRUGDWDDQDO\VLV
Furthermore, the determination of watershed’s general water balance used Thornthwaite-Mather method. Watershed’s meteorological water availability was assessed by using the weighted average method.
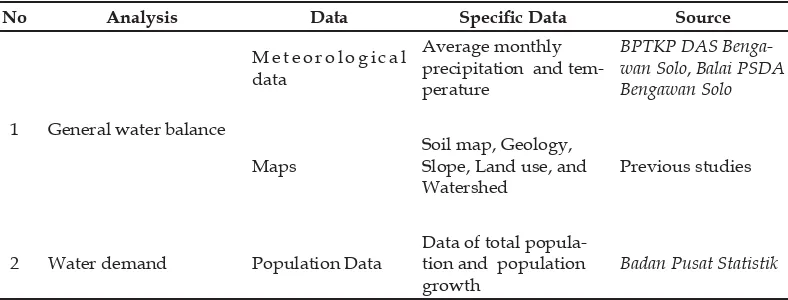
b. Data and Data Sources
In this study, the data comprised of
VHFRQGDU\GDWDWKDWZDVVXSSRUWHGZLWKÀHOG VWXG\UHVXOWV6SHFLÀFDOO\WKHGDWDDQGVRXUFHV
Table 1. S
No Analysis Data 6SHFLÀF'DWD Source
1 General water balance
M e t e o r o l o g i c a l data
Average monthly precipitation and tem-perature
%37.3'$6%HQJD ZDQ6ROR, %DODL36'$ %HQJDZDQ6ROR
Maps
Soil map, Geology, Slope, Land use, and Watershed
Previous studies
2 Water demand Population Data
Data of total popula-tion and populapopula-tion growth
%DGDQ3XVDW6WDWLVWLN
S : , 20 5
3. Data Analysis Technique
a. General water balance analysis
Water balance is the balance of the water input and output in a region at a certain period that can be used to determine the amount of
ZDWHUVXUSOXVRUZDWHUGHÀFLW7KHPRGHOXVHG
in this study was the general water balance. It
UHTXLUHG FOLPDWRORJLFDO GDWD DQG ZDV XVHIXO
to determine the wet months. Thornthwaite-Mather method was used to identify the
FRQGLWLRQRIWKHZDWHUTXDQWLW\LQHDFKPRQWK
in a year (Fu’adah, et al., 2015). This method measured air temperature, monthly heat index, and correction factor of solar radiation duration based on the latitude (Tamba, et al.,
. Projection of domestic water demand was established by considering the rate of population growth.
b. Water availability analysis
The weighted average method was employed to calculate water availability based on precipitation of each sub-watershed
0XOLUDQWLDQG+DGL7KHHTXDWLRQZDV
Midstream of Bengawan Solo Watershed (km2).
c. Domestic Water Demand Ful llment Analysis
7KHIXOÀOOPHQWRIGRPHVWLFZDWHUGHPDQG
in the study area was assessed based on the ratio of regional meteorological water availability and domestic water demand in Bengawan
6ROR:DWHUVKHG'HPDQGZDVIXOÀOOHGLIZDWHU
availability exceeded the demand and on the
FRQWUDU\LWZDVQRWIXOÀOOHGLIZDWHUDYDLODELOLW\
was lower than the demand.
The calculation of domestic regional water availability was carried out by using the weighted average method and domestic water demand by the assumption of 100 liters/ individual/ day (Muliranti and Hadi, 2013).
4. Results and Discussions
a. Physical Condition of Study Area
The Upstream and Midstream of Bengawan Solo watershed consist of several sub-watersheds including Pepe, Bambang, Dengkeng, Mungkung, Samin, and Jlantah Walikun Ds, Keduang, Wiroko Temon, and Alang Unggahan. Astronomically, the study
DUHDLVVLWXDWHGDW·µ(·µ( DQG·µ6·µ67RWDODUHDZDV
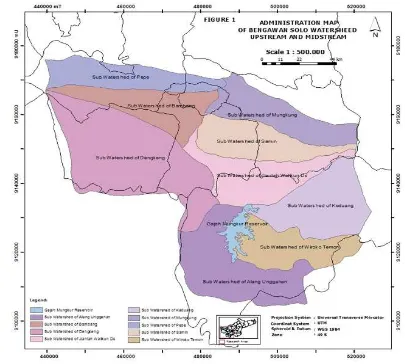
3773.99 km². Administratively, the Upstream of Bengawan Solo Watershed covered Wonogiri district, Sukoharjo district, Klaten district, Karanganyar district, Boyolali district, and Surakarta City. Spatially, the illustration of study area can be observed in Fig. 1.
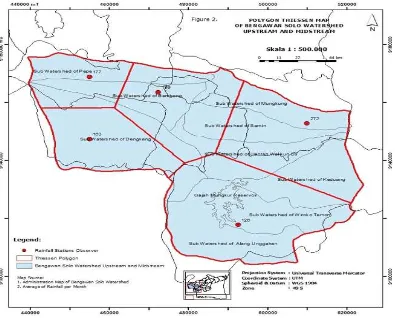
The micro climate of each sub-watershed was determined by using Thiessen polygons. It
ZDVHVWDEOLVKHGZLWKÀYHUDLQIDOOVWDWLRQVWKXV WKHUHZHUHÀYH7KLHVVHQSRO\JRQDUHDVQDPHO\
(Wonogiri). Based on the analysis obtained from those stations, the study area had moderate and semi-humid climate5DLQIDOOVWDWLRQVFODVVLÀHG in semi-humid climate group were Pabelan, Tawangmangu, and Klaten with the Q values, respectively, 43.2: 39.5: and 50. Meanwhile, rainfall stations located in moderate climate were Nepen and Baturetno with Q values of
DQG UHVSHFWLYHO\ 6SDWLDO 7KLHVVHQ
polygon of the study area is presented in Fig. 2. In 2014, there were 7 (seven) types of land use were recorded in the study area, namely, forest, mixed orchard, vacant land, settlement,
SDGG\ÀHOGGU\ODQGDJULFXOWXUHDQGUHVHUYRLU /DQGXVHZDVGRPLQDWHGE\SDGG\ÀHOGDQG PL[HGRUFKDUGZLWKDUHDRINP2
km², respectively.
Generally, the soil type of the study area consisted of eight types, including alluvials, andosols, complex, grumusols, latosols, lithosols, mediterranean, and regosols. Lithosol dominated the study area and was distributed evenly throughout the area, approximately of 1465.3 km². This kind of soil has a thickness or soil solum of 20 cm or less on the surface of source rock or source material (lytic or paralytic) regardless the color and texture.
Figure 1. Administration Map of the Upstream and Midstream of Bengawan Solo Watershed.
The study area was divided into four topography regions, i.e. flat, undulating, hilly, and volcanic. This study area was generally flat (slope of 0-<5%) with a total
DUHD RI NPò RU RI WKH WRWDO
regional area. It indicated that the dominant topography was relatively flat. Other parts
Figure 2. Polygon Thiessen Map of the Upstream and Midstream of Bengawan Solo Watershed.
Geologically, the Upstream and Midstream of Bengawan Solo Watershed were constituted of $QGHVLWH +RORFHQH $OOXYLXP /LPHVWRQH 2OG 4XDWHUQDU\ 9ROFDQLF 3URGXFW 4XDWHUQDU\ 6HGLPHQWDU\ 3URGXFW 7HUWLDU\ 6HGLPHQWDU\ 3URGXFW 7HUWLDU\ 9ROFDQLF 3URGXFWand <RXQJ 4XDWHUQDU\ 9ROFDQLF 3URGXFW. The Upstream and Midstream of Bengawan Solo Watershed were dominated by <RXQJ4XDWHUQDU\9ROFDQLF 3URGXFW that was evenly distributed in the west and the east with total area of 2002.5 km². This area was constituted of materials from Mount Merapi and Lawu since the study area is located between Mount Merapi and Lawu in
the west and the east. Meanwhile, Bengawan Solo River is situated between Mount Merapi and Lawu, so there were holocene and alluvium that were composed from the river sediment material with an area of 435.4 km².
Based on data from the Central Bureau of Statistics (%DGDQ 3XVDW 6WDWLVWLN) in 2015, the total population of the six districts included in the Upstream and Midstream of Bengawan
6ROR:DWHUVKHGZDVSHRSOHZLWKDQ
average population growth of 0.82% per year. The population data of the study area can be seen in Table 2.
Table 2. S 20 4
No District/City Total Population
(individual) Population Growth (%)
1 Sukoharjo 0.45
2 Karanganyar 840,171 0.71
3 Surakarta City 507,825 1.53
4 Boyolali
5 Klaten 1.02
Wonogiri 942,377
b. General Water Balance in the Upstream and Midstream of Bengawan Solo Watershed
Based on the water cycle system, the water available on the earth is the result of precipitation. Rainwater poured down on the earth’s surface in various conditions of land cover including in urban area, rural area, forest,
ÀHOGV GLYHUVH VRLO W\SHV DQG WRSRJUDSKLHV
Different land conditions would differentiate
WKHTXDQWLW\RIZDWHUUHODWHGWRWKHSURFHVVRI LQÀOWUDWLRQHYDSRUDWLRQVWRUDJHE\WKHFURZQV
and hollows, as well as runoff. The conditions indicated that the physical and meteorological
components had effect on water availability (hydrological conditions) in a watershed.
7KH ÀQDO UHVXOW RI ZDWHUVKHG·V JHQHUDO
water balance was derived from the difference between precipitation and corrected EP,
WKXV ZDWHU VXUSOXV RU ZDWHU GHÀFLW LQ WKH
wet period could be determined. Negative value represented the precipitation level was incapable to add water potential of vegetated area. On the contrary, positive value depicted the water surplus was available during certain periods of the year to restore soil moisture and runoff. The differences between precipitation and monthly P-EP in the Upstream and Midstream of Bengawan Solo Watershed are presented in Table 3.
Table 3. -E S
No Sub-watershed P EP P-EP Description
1 Alang Unggahan 'HÀFLW
2 Bambang 113.50 Surplus
3 Dengkeng 125.70 40.24 Surplus
4 Jlantah Walikun Ds 218.44 123.20 95.24 Surplus
5 Keduang 217.38 122.40 94.98 Surplus
Mungkung 248.51 78.81 Surplus
7 Pepe 184.84 Surplus
8 Samin 244.82 174.00 70.82 Surplus
9 Wiroko Temon 137.19 -11.19 'HÀFLW
S : , 20 4
In Table 3, the Upstream and Midstream of Bengawan Solo Watershed endured water
GHÀFLWDQGZDWHUVXUSOXV7KHKLJKHVWYDOXHRI
P-EP was obtained by Keduang sub-watershed and the lowest was obtained by Wiroko Temon
VXEZDWHUVKHG :DWHU GHÀFLW ZDV XQGHUJRQH
by Alang Unggahan and Wiroko Temon
sub-watershed. It was allegedly caused by those sub-watersheds were in the range of one rainfall station, which was Baturetno station. The
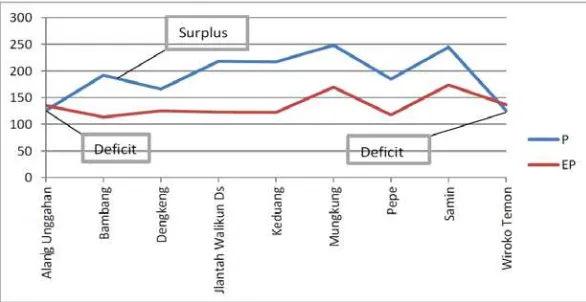
FRQGLWLRQ RI PHWHRURORJLFDO ZDWHU GHÀFLW DQG
water surplus in the Upstream and Midstream of Bengawan Solo Watershed is presented in Fig. 2.
Based on Fig. 3, the blue line showed the data of average monthly precipitation and the red line indicated the corrected potential
HYDSRUDWLRQ:DWHUGHÀFLWRFFXUUHGZKHQWKH
two curves intersected.
The assessment of general water balance in the Upstream and Midstream of Bengawan
6ROR ZDWHUVKHG UHTXLUHG WKH GDWD RI DYHUDJH
monthly precipitation rainfall by employing Thornthwaite-Mather method. This method was selected since numbers of researchers
YHULÀHGWKHKLJKDFFXUDF\RIWKLVPHWKRG&DOYR
(2009) conducted a study of the evaluation of water balance by using Thronwaite-Matter in predicting run-off in the highlands of Costa Rica. The results indicated that the Thronwaite-Matter method could estimate annual and monthly run-off and in general, the level of results’ accuracy reached 90%.
Similar study related with the calculation of P-EP by employing the Thronwaite-Matter method was also carried out by Adi (2015) to
describe the drought of an area with Index of Aridity (Ia). It compared the difference between
ZDWHUGHÀFLWDQGSRWHQWLDOHYDSRUDWLRQ%DVHG
on the results of the study conducted in the Code watershed based on Ia, the area could
EH FODVVLÀHG DV U ORZ ZDWHU GHÀFLW 7KXV
climatologically, the area of Code watershed could not be considered as drought-vulnerable area.
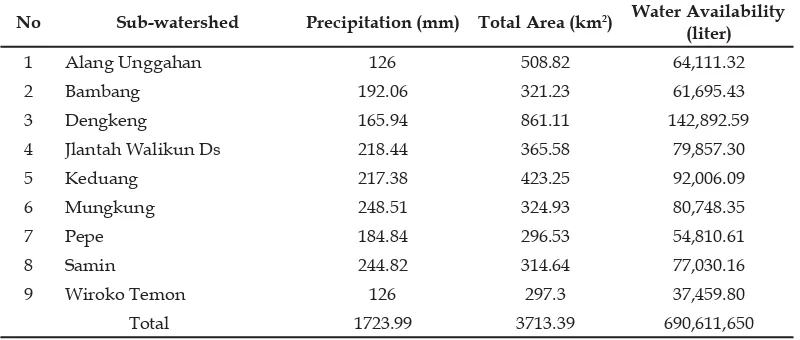
c. Domestic Meteorological Water
Availability
Meteorological water availability in the Upstream and Midstream of Bengawan Solo Watershed was obtained from the average of monthly precipitation derived from Thiessen polygons method. Data processing was carried out with the assistance of Geographic Information Systems (GIS) by using Arc GIS 9.3
VRIWZDUH6SHFLÀFDOO\UHVXOWVRIGDWDSURFHVVLQJ
are presented in Table 4.
Table 4. S
No Sub-watershed Precipitation (mm) Total Area (km2) Water Availability (liter)
1 Alang Unggahan 508.82
2 Bambang 321.23
3 Dengkeng 142,892.59
4 Jlantah Walikun Ds 218.44 79,857.30
5 Keduang 217.38 423.25
Mungkung 248.51 324.93 80,748.35
7 Pepe 184.84
8 Samin 244.82
9 Wiroko Temon 297.3 37,459.80
Total 1723.99 3713.39
S : , 20 4
Based on Table 4, the highest value of meteorological water availability was obtained by Dengkeng sub-watershed of 142,892.59 liters while the lowest was obtained by Wiroko Temon sub-watershed of 37,459.8 liters. The difference
ZDVWKHFRQVHTXHQFHRIWRWDODUHDPHWHRURORJLFDO
stations range, and the mean precipitation of each sub-watershed. Administratively, Sukoharjo covered Samin sub-watershed, Karanganyar covered Mungkung sub-watershed, Boyolali covered Bambang sub-watershed, Surakarta covered Pepe sub-watershed, Klaten covered Dengkeng sub-watershed, and Wonogiri
covered Jlantah Walikun Ds, Alang Unggahan, Keduang, and Wiroko Temon sub-watershed.
Thiessen polygon method to determine the average precipitation has several advantages including to provide precise precipitation data since each part of the catchment area is
SURSRUWLRQDOO\ UHSUHVHQWHG E\ VSHFLÀF UDLQ
gauge that could be used on large area. It was
FRQÀUPHGE\UHVHDUFKFRQGXFWHGE\1LQJ
Data of meteorological water availability that had been calculated by using Thiessen polygon method and divided into sub-watershed area,
VXEVHTXHQWO\ZDVFKDQJHGLQWRDGPLQLVWUDWLYH
based data. As for the details of meteorological water availability based on administrative area of the Upstream and Midstream of Bengawan Solo watershed is presented in Table 5.
Table 5. S
No District/City Range of Sub-watershed Water Availability (liter)
1 Sukoharjo Samin
2 Karanganyar Mungkung 80,748,350
3 Surakarta Pepe
4 Boyolali Bambang
5 Klaten Dengkeng 142,892,590
Wonogiri
Jlantah Walikun Ds, Alang Un-ggahan, Keduang, and Wiroko Temon
273,434,510
Total
S : , 20 5
In accordance to Table 5, the highest monthly meteorological water availability was attained by Wonogiri district, which was amounted to 273,434,51 liters and the lowest was
REWDLQHGE\6XUDNDUWD&LW\RIOLWHUV
High meteorological water availability should be necessarily balanced with well-managed water conservation such as by expanding the catchment area, reducing land-use conversion, harvesting rainwater, and reducing excessive use of ground water. It was also emphasized by Basuki (2015) that water conservation
WHFKQLTXHVRILQXQGDWLRQUHVHUYRLUV\VWHPFDQ
be an alternative to decrease the run off.
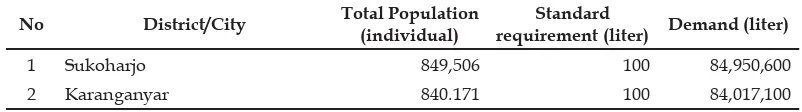
d. Analysis of Domestic Water Demand in the Upstream and Midstream of Bengawan Solo Watershed
Water is one of the basic necessities for local community in the Upstream and Midstream of Bengawan Solo watershed. It is used for various purposes including for domestic and agricultural activities. Water demand of each area varies in accordance to the population and their livelihoods. In this study, water demand was estimated based on the assumption in
ZKLFK HDFK LQGLYLGXDO UHTXLUHG OLWHUV
day. The domestic water demand of districts in the administrative area of Upstream and Midstream of Bengawan Solo watershed is
SUHVHQWHGLQ7DEOH
%DVHG RQ 7DEOH WKH KLJKHVW OHYHO RI
domestic water demand was obtained by
.ODWHQ GLVWULFW RI OLWHU ZKLOH WKH
lowest domestic water demand was attained by Surakarta City of 50,782,500 liters. The level of domestic water demand in the study area varied that was caused by diverse total population of each district or city in the administrative area of the Upstream and Midstream of Bengawan Solo watershed. The higher the population of an area, the higher the domestic water demand. However, clean water demand was not linear with the supply, hence, people
VKRXOGIUHTXHQWO\EX\FOHDQZDWHUDWDUHDVZLWK
abundant clean water. Similarly, Alimah and Putro (2015) asserted water demand as human
EDVLF UHTXLUHPHQW LV LQFOLQHG WR DXJPHQW LQ
accordance to population growth. The demand is increasing for household, industry sector,
RIÀFHVDQGRWKHUSXEOLFIDFLOLWLHV
Table 6. 20 5
S
No District/City Total Population (individual)
Standard
requirement (liter) Demand (liter)
1 Sukoharjo 100
No District/City Total Population (individual)
Standard
require-ment (liter) Demand (liter)
3 Surakarta 507,825 100 50,782,500
4 Boyolali 100
5 Klaten 100
Wonogiri 942,377 100 94,237,700
Total
S : , 20 5
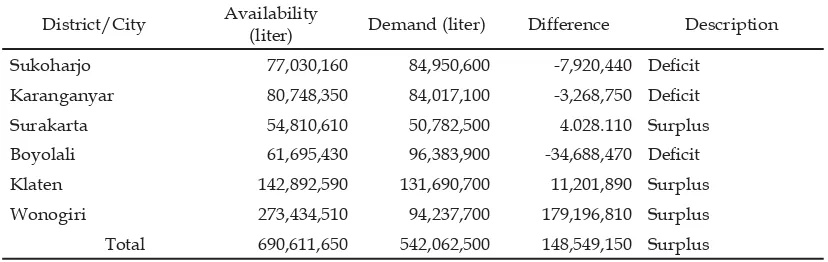
e. Analysis of Domestic Water Demand
Fulfillment in the Study Area
The fulfillment of domestic water demand was based on the amount of meteorological water availability and the amount of domestic water demand of the population in a certain region. High meteorology-based water availability and
low water demand would result on the fulfillment of domestic water demand, on the contrary, low meteorology-based water availability and high water demand would lead to water deficit. The fulfillment of domestic water demand in the Upstream and Midstream of Bengawan Solo Watershed is presented in Table 7.
Table 7. S S
District/City Availability
(liter) Demand (liter) Difference Description
Sukoharjo -7,920,440 'HÀFLW
Karanganyar 80,748,350 84,017,100 'HÀFLW
Surakarta 50,782,500 4.028.110 Surplus
Boyolali 'HÀFLW
Klaten 142,892,590 11,201,890 Surplus
Wonogiri 273,434,510 94,237,700 Surplus
Total 148,549,150 Surplus
S : , 20 5
Table 7 demonstrated that basically, domestic water demand in the study area
ZDV IXOÀOOHG +RZHYHU VHYHUDO GLVWULFWV KDG HQGXUHGZDWHUGHÀFLWDVFDQEHVHHQLQ7DEOH
such as Sukoharjo district, Karanganyar district, and Boyolali district. The status eventually
LPSURYHGFRPPXQLW\ZHOIDUHDQGOLIHTXDOLW\ 6XUSOXV RU GHÀFLW GRPHVWLF ZDWHU DYDLODELOLW\
of study area in this research, however, did
QRW UHÁHFW WKH ZDWHU FULVLV VLQFH PRVW RI WKH
population lived in the urban area and utilized local water company (PDAM) as water source.
5. Conclusion
Based on the results description and discussion, it can be concluded that the calculation of general water balance in the
Upstream and Midstream of Bengawan Solo watershed indicated the occurrence of both
ZDWHUVXUSOXVDQGZDWHUGHÀFLW:DWHUVXUSOXV
was obtained by Bambang, Dengkeng, Jlantah Walikun Ds, Keduang, Mungkung, Pepe and
6DPLQVXEZDWHUVKHGZKLOHZDWHUGHÀFLWZDV
undergone by Alang Unggahan and Wiroko Temon sub-watershed. The meteorological water availability in the Upstream and Midstream of Bengawan Solo watershed was in the range of 37,459,800 to 142,892,590 liters. Domestic water demand in Upstream and Midstream of Bengawan Solo watershed was
EHWZHHQ WR OLWHUV 7KH ZDWHUDYDLODELOLW\JHQHUDOO\IXOÀOOHGWKHZDWHU GHPDQGWKXVWKHFRPPXQLW\UHTXLUHPHQWIRU
domestic water demand was attained.
6. References
$GL 51 .ODVLÀNDVL ,NOLP GDQ ,QWHQVLWDV .HNHULQJDQ 'DHUDK $OLUDQ 6XQJDL &RGH
Alimah, I., Putro, H P H., 2015. Kajian Tingkat Konsumsi Air Bersih PDAM di Provinsi Jawa Barat. -XUQDO3HUHQFDQDDQ:LOD\DKGDQ.RWD%6$33.91S
Basuki, T.M., 2015. Evaluasi Kemampuan Penggunaan Lahan dan Alternatif Penerapan Konservasi Tanah dan Air Sebagai Upaya Restorasi DAS Ciliwung. 0DNDODK6HPLQDU1DVLRQDO5HVWRUDVL '$6. Surakarta: BPTKPDAS.
&DOYR-&$QHYDOXDWLRQRI7KRUQWKZDLWH·VZDWHUEDODQFHWHFKQLTXHLQSUHGLFWLQJVWUHDP
runoff in Costa Rica. +\GURORJLFDO6FLHQFHV-RXUQDO'2,
Fu’adah, A.T., Iryanti, M., Mujtahiddin, M I., 2015. Analisis Spasial Ketersediaan Air Tanah di Wilayah Bandung dengan menggunakan Metode Neraca Air Thornthwaite-Matter. -XUQDO
3HQHOLWLDQ)LEXVL-R)9RO1R$SULO. %DQGXQJ-XUXVDQ3HQGLGLNDQ)LVLND)DNXOWDV
3HQGLGLNDQ0DWHPDWLNDGDQ,OPX3HQJHWDKXDQ$ODP8QLYHUVLWDV3HQGLGLNDQ,QGRQHVLD83,
Lemhanas, 2014. Problem Sumber Daya Air dan Model Pengelolannya. Accessed in 28 April 2014 at:
http://www.lemhannas.go.id/portal/images/stories/humas/jurnal/edisi15/jurnal%20
HGLVLPDWHULSGI
0LDUGLQL$6XVDQWL3'$QDO\VLV3K\VLFDO&KDUDFWHULVWLFVRI/DQGIRU(VWLPDWHG5XQRII &RHIÀFLHQWDV)ORRG&RQWURO(IIRUWLQ&RPDO:DWHUVKHG&HQWUDO-DYD)RUXP*HRJUDÀ ²
Muliranti , S., Hadi, M. Pramono., 2013. Kajian Ketersediaan Air Meteorologis untuk Pemenuhan Kebutuhan Air Domestik di Provinsi Jawa Tengah dan DIY. 1DVNDK3XEOLNDVL6NULSVL6.
<RJ\DNDUWD)DNXOWDV*HRJUDÀ8*0
Ningsih, D. H.U., 2012. Metode Thiessen Polygon untuk Ramalan Sebaran Curah Hujan Periode Tertentu pada Wilayah yang Tidak Memiliki Data Curah Hujan. -XUQDO 7HNQLN 7HNQRORJL ,QIRUPDVL',1$0,.
Suharjo, Anna, A. N., 2007. (YROXVL/HUHQJ'DQ7DQDK'DHUDK6ROR-DZD7HQJDK)DNXOWDV*HRJUDÀ UMS.
Foster, S. and Ait-Kadi, M. 2012. Integrated Water Resources Management (IWRM): How does
JURXQGZDWHUÀWLQ"+\GURJHRORJ\-RXUQDO²6ZHHGHQ6SULQJHU9HUODJ
Sakuntaladewi, N., Wibowo, L. R., 2015. Dampak Perubahan Iklim, Kerentanan, dan Adaptasi Masyarakat di DAS Cipunagara, Provinsi Jawa Barat. 0DNDODK6HPLQDU1DVLRQDO5HVWRUDVL '$6. Surakarta: BPTKPDAS.
7DPED&)DX]L06XSUD\RJL,.DMLDQ3RWHQVL.HWHUVHGLDQ$LUPHQJJXQDNDQ0RGHO