BREAST CANCER DIAGNOSIS USING THREE SUPERVISED
LEARNING ALGORITHMS
Retno Aulia Vinarti
1Jurusan Sistem Informasi, Fakultas Teknologi Informasi, Institut Teknologi Sepuluh Nopember
Jl. Raya ITS, Surabaya, 60111 Telp : (031) 5964965, Fax : (031) 5999944
E-mail : vaulia@gmail.com
Abstrak
Kanker payudara adalah salah satu bentuk kanker yang patut diwaspadai. Hampir 12.000 kasus kanker payudara berakhir dengan kematian di UK per tahunnya. Untuk membantu permasalahan ini, banyak penelitian yang telah dilakukan di bidang kesehatan dan juga teknologi informasi untuk pendeteksian kanker payudara dini. Secara umum, terdapat dua tipe dari kanker payudara, yaitu kanker jinak dan kanker ganas. Algoritma Jaringan Saraf Tiruan, K-Tetangga Terdekat, dan Pohon Keputusan adalah tiga algoritma untuk klasifikasi yang berada pada ranah Algoritma dengan proses pembelajaran yang terpimpin. Menariknya, sekalipun ketiga algoritma tersebut memiliki kesamaan dari kategori pembelajaran, namun ketiga algoritma tersebut sama sekali berbeda dalam proses pembangunan pengetahuan untuk proses pengenalan pola atau klasifikasi. Oleh sebab itu, penelitian ini diajukan untuk melihat performa dari masing-masing algoritma tersebut, dengan berbekal dari penelitian sebelumnya yang telah dilakukan. Data yang digunakan dalam penelitian ini adalah Wisconsin Breast Cancer data yang memiliki tiga jenis data, yaitu data mean, standard error, dan largest. Hal ini menambah kompleksitas dari proses ketiga algorima tersebut untuk membantu proses diagnosa kanker payudara. Hasil dari penelitian ini menunjukkan bahwa Jaringan Saraf Tiruan dan K-Tetangga Terdekat memiliki tingkat akurasi terbaik dibandingkan dengan Pohon Keputusan. Selain itu, hasil dari penelitian ini juga memberikan rekomendasi untuk menggunakan data largest sebagai rujukan pertama dalam proses deteksi dini. Bila dibandingkan dengan penelitian-penelitian sebelumnya, penelitian ini memiliki akurasi yang lebih baik.
Kata Kunci: Kanker Payudara Wisconsin, Jaringan Saraf Tiruan, K-Nearest Neighbor, Decision Tree
Abstract
Breast Cancer is one of the most dangerous forms of illness. Almost 12,000 cases of Breast Cancer end in death annually in the UK. In order to help with this case, previous research has been done to discover early the cancer type: benign or malignant. Artificial Neural Networks (ANN), K-Nearest Neighbor (KNN) and Decision Tree (DTree) are three kinds of supervised learning algorithms each of which has different ways to classify data. What makes this research a challenge is to compare the accuracy values in Breast Cancer prediction. The Breast Cancer Wisconsin data contains three kinds of data: mean, standard error, and largest which were taken from 569 patients. This adds the complexity of the way each algorithm performs. The result shows that ANN and KNN have better performance than DTree. The study also offers recommendation for doctors regarding which kind of data should be considered first in Breast Cancer diagnosis. In comparison to the previous research, this study finding has better accuracy.
Keywords: Breast Cancer Wisconsin, Artificial Neural Network, K-Nearest Neighbor, Decision Tree.
1.
INTRODUCTION
According to Delyth Morgan[1], Chief Executive of Breast Cancer Campaign, breast cancer is still the most common form of cancer [1]. In UK, there are 50,000 cases diagnosed, a quarter of which resulted in death annually. Considering this large number of cases, light and accurate prediction of breast cancer is needed in order to provide pre-diagnose opinion to the doctors.
Previous research had been conducted to offer prediction or recommendation what algorithms yield the best result for breast cancer prediction. Mangasarian & Holberg (1992) achieved 97.5% in Wisconsin Data Breast Cancer prediction using ANN. They concluded that the largest data had the most accurate prediction compared to mean and standard error data. Meanwhile, Endo et al. (2008) tried to predict breast cancer using Decision Tree classifier. The result suggested 85.6% accuracy value. KNN also shows good performance in any kind of prediction. Breast Cancer Wisconsin prediction using KNN had been conducted and its accuracy was 96.42% [2].
ANN, Decision Tree, and KNN have different methods for classifying data, but all of them are supervised learning algorithms. ANN is known for its black box processes through its random weighing systems and function, yet it has more robustness to predict any kind of data. Decision Tree is the most prominent classifier in any classification cases. ID3 and J48 are two kinds of classifiers derived from decision tree algorithm. KNN has different points to categorize data. It measures all of points’ distances to judge the class of the data tested.
Based on those previous experiments and the classification method uniqueness of each algorithm, this research aim to make slight adjustment to improve the performances of the preceding works and to compare those three algorithms in order to obtain deeper analysis. A long-term purpose of this research is to offer recommendation regarding the data to be used for pre-diagnosed statement.
2.
METHODOLOGY
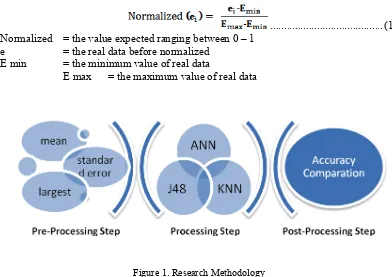
Most of classification model has three main stages: pre-processing, classification and post-processing. Data cleansing and converting are handled in pre-processing step. After cleansing the data, the next step is classification using two classifiers. Each classifier will be tested using external dataset. Post-processing step is analyzing and comparing result from those two models.
2.1
Pre-processing Step
yields 0 or 1 which represent cancer diagnoses (class), 0 that followed by 1 (0-1) is benign and 1 that followed by 0 (1-0) is malignant.
Converting process not only took on class attributes but also on all ten attributes in order to meet performance function used in BPNN. It has to be 0 for the lowest value and 1 for the highest value in each attribute. To convert, author used normalization formula by scaling between 0 and 1.
... (1) Normalized = the value expected ranging between 0 – 1
e = the real data before normalized E min = the minimum value of real data
E max = the maximum value of real data
Figure 1. Research Methodology
2.2
Classification
All classifiers used in this research are categorized as supervised learning methods. ANN, KNN and Decision Tree were supplied by class attributes while making their models, thus, they belong to supervised learning [4]. This research methodology is shown in figure 1.
a. Artificial Neural Networks
ANN has been widely used in classification modeling because of its robustness and ability to adapt varied training data. Its usability for categorical or numerical data makes it perfect a model to predict Breast Cancer malignancy [5], [6], [7]. ANN used in this research is feed forward back propagation neural network with adjusted training parameter.
Back Propagation Neural Networks (BPNN) has a general formula to process its input. Formula 1 shows how BPNN works
... (2)
yt = the BPNN outputa = bias
w = weight of every node that are represented with i and j.
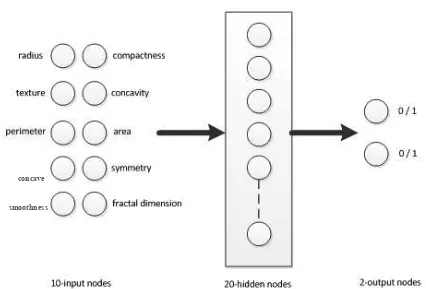
Figure 2 Neural Network Architecture
Classification process will be run three times sequentially for each data category (mean, standard error and largest). Those three different dataset will offer the best recommendation for diagnosing Breast Cancer. The previous research found that the largest dataset are the best data used for predicting malignant and benign Breast Cancer [8]. It had 97.5% accuracy for predicting the illness using multi-surface method (MSM) with three variables: Largest Area, Largest Smoothness and Mean Texture. This research will prove and compare the previous finding accuracy by performing other classifiers (ANN, KNN and Decision Tree) for predicting Breast Cancer. One drawback of ANN is its human-unreadable processing systems by converting knowledge into weight and bias with specific functions. Therefore, it will be compared with another classifier in order to justify its drawback.
The ANN used in this research has max epoch 1000 and uses back propagation algorithm Levenberg-Marquadt. Its architecture is 10 input nodes, 20 hidden nodes and 3 output nodes to cover the structure in Wisconsin breast cancer data.
b. Decision Tree
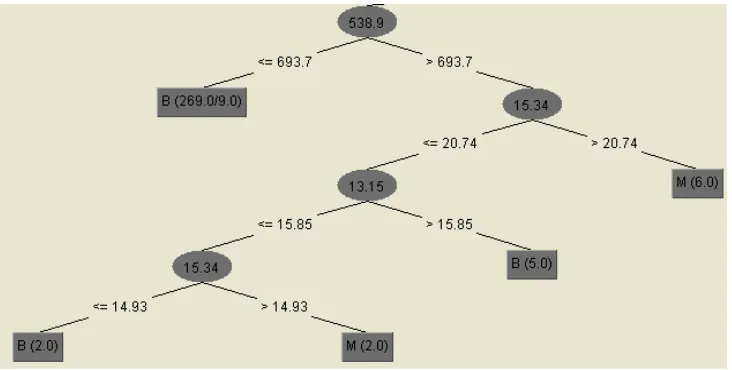
According to the previous research, Decision Tree (J48) yields satisfying accuracy (85.6%) compared to seven other algorithms to predict Breast Cancer severity [9]. Based on Endo experiment, J48 has performed 7% higher than other Decision Tree algorithms. Decision tree adopts the form of a tree structure to present influencing attributes and their values in order to match with each class. It has a node for each attribute, a leaf for value of each attribute and an arc/edge for splitting attributes [10]. J48 is an implementation of ID3 (Iterative Dichotomiser 3) algorithm, but ID3 only operates nominal attributes. Therefore, this research used J48 instead of ID3 algorithm because breast cancer Wisconsin data contains both nominal and numeric attributes. The illustration of Decision Tree is shown in Figure 3. To perform this algorithm, classregtree function in MATLAB was used.
concave
Figure 3. Decision Tree Illustration
t = classregtree(X, y) ... (3) Classregtree function needs at least two array of input. X is an n x m matrix of predictor values. In this case, all ten non-binary attributes were performed as X. Meanwhile, y is expected vector, can be categorical variable, character array or array of strings, therefore, it doesn’t need pre-processing data like BPNN to classify with this algorithm. Class attributes (benign or malignant) was set as y. At figure 3, this class attributes can be seen as B and M at the most bottom of tree.
c. K-Nearest Neighbor
KNN is supervised learning method with instance based classifier. KNN justifies classes based on voting result taken from K neighbors’ classes. K is a real number between 1 and N. The less number of K, the less reference will be used to justify but the more number of K, the more time to compute each distances including voting stage. To avoid same vote results at voting section, only odd numbers will be tested in K experiment [11]. Figure 4 illustrates the percentage of correctly classified instances as the K is getting higher. Based on the experiment, 9 neighbors will be used to justify classes in the testing section.
After defining K number, the other critical parameters are the method used to determine distance and whether each neighbor will be granted a weight or not. Considering the data types of all ten attributes, Euclidean Distances is used to distance measuring activity Error! Reference source not found.. The formula of Euclidean Distances is shown in formula 1. In order to value the significance of each neighbor to the tested value, weighted distance is used in this KNN. There are two options of weighing distances: 1-distances and 1/distances. Both of them will reduce the relevance of a neighbor as it has more distance.
... (4) d = distance between example data and training data.
a = first attribute b = second attribute
2.3
Post-processing Step
input node. Decision Tree algorithm also needed post-processing activity especially in interpreting the tree itself and converting confusion matrix/table into deeper meaning. Different to other two preceding algorithms, KNN algorithm needs voting activity and determines which result yields the most accurate prediction.
Accuracy measurements become the focus of this experiment; therefore, after doing several classifications, the percentage of each method or algorithm was evaluated and compared. Some adjustments were constructed to improve the accuracy results. These adjustments involved detail algorithm used, such as weight formula selection in KNN and retraining iteration performed by ANN. Accuracy measurements are not only taken in accuracy value, but also in weighted average of precision and recall values between Benign and Malignant. Accuracy is the percentage of correctly classified instances. On the other hand, weighted average of precision and recall values show in which class the prediction has more accuracy. By having these two measurements, the analysis of results will be richer and more objective than just having one value measurement.
3.
RESULT AND EXPLANATION
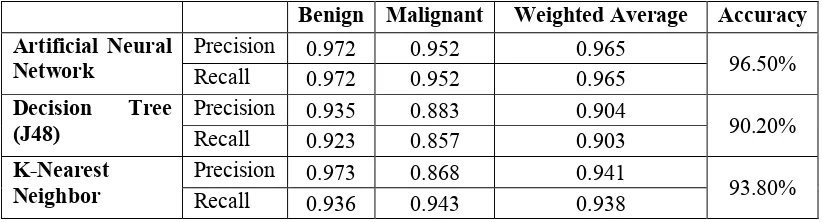
As the aforementioned explanation, this research computes three different data in one Wisconsin Breast Cancer dataset. Those three subsets are mean, standard error and largest value of each cancer case measurement. Table 1, 2, 3 show comparison among three algorithms in mean, standard error and largest values, consecutively.
a. The most accurate algorithm
In mean and standard error data, ANN has the best accuracy (96.5% and 88.5%). But, this result is different from largest data because KNN has the highest accuracy. It cannot be concluded that ANN has the best algorithm, but it can be the best option for breast cancer predicting. KNN comes after ANN as the second best classifier.
b. The least accurate algorithm
Based on table 1, 2, 3, the weakest algorithm is Decision Tree. In mean, standard error and largest data, Decision Tree has the lowest accuracy.
These results may occur mostly because ANN has the capability to memorize the training data pattern; even though, the testing data has no precise similarity with the trained data. In the pre-processing step, the training and testing data was separated to each other. It means that the testing data is totally different from the training data. The classifier should predict the outcome without any exactly the same previous knowledge.
If the testing method is changed into cross fold validation, decision tree may have better results. It has a bigger probability of intersection between the training and the testing data compared to the split validation method. In cross fold validation method, the folding training data can enrich the decision tree through iterative process. It can be proven in further experiment.
c. The most recommended data
Figure 3. K defining experiments results
d. The least recommended data
The standard error data shows the lowest accuracy with eighty percent in all algorithms. It represents that various kind of algorithms cannot be predicted using standard error data. Thus, this data should be taken as the least supporting data for breast cancer prediction.
e. The hardest class to classify
To identify whether Benign or Malignant is the hardest one to predict, the precision and recall values are taken into consideration. From the nine experiments, only two of them showed that benign have less value of precision and recall. Meanwhile, seven of them are depicted malignant which have lower precision and recall values.
Precision values represent how precise the prediction performed by classifiers is. Therefore, lower precision values in malignant means lower malignant instances that are correctly predicted by the classifiers. On the other hand, recall values represent how many actual instances that are correctly classified by those three algorithms. Thus, lower recall values means lower malignant data that are successfully predicted. This might happen due to the lack of malignant data from the beginning. The Malignant and Benign data has the proportion of 37%:63% to the total data. The result might be different if the comparison between Malignant and Benign is equal. Further research should be taken to prove this possibility.
Table 1. Mean Data
Benign Malignant Weighted Average Accuracy
Artificial Neural Network
Precision 0.972 0.952 0.965
96.50%
Recall 0.972 0.952 0.965
Decision Tree (J48)
Precision 0.935 0.883 0.904
90.20%
Recall 0.923 0.857 0.903
K-Nearest Neighbor
Precision 0.973 0.868 0.941
93.80%
Table 2. Standard Error Data
Table 4. Accuracy comparison with previous research
Algorithm Previous Research This Research K-Nearest Neighbor Hsieh, et al (2012) 96.42% 98.2%
Besides analyzing the result of this research, comparing to the previous research can be taken in order to justify how best the performance is. This comparison is shown by the table below. This research has leading results in Decision Tree and KNN performance but this research has 0.2% lower than Mangasarian & Holberg in ANN research. Another ANN type and several major adjustments should be taken to make ANN better than the previous one.
4.
CONCLUSION AND FURTHER RESEARCH
Based on the experiments held through three different types of supervised learning algorithms, it can be concluded that both ANN and KNN can be used as promising and reliable classifiers. Furthermore, both of those algorithms will yield better results in breast cancer prediction if they are used in the largest or mean data.
Between Benign and Malignant instances, the result shows that Malignant is more difficult to predict than Benign. Therefore, further research should be taken in order to help with the malignant cases. Compared to the previous research, this study has a better performance in Decision Tree algorithm and KNN. But, a further adjustment at ANN can be performed in the following research to increase the accuracy.
REFERENCES
[1] Morgan, D. (2013). Help us find the cures. Breast Cancer Research, 107.
[2] Hsieh, S.-L., Hsieh, S.-H., Cheng, P.-H., Chen, C.-H., Hsu, K.-P., Lee, I.-S., et al. (2012). Design Ensemble Machine Learning Model for Breast Cancer Diagnosis. Journal of Medical Systems, 2841-2847.
[3] Wolberg, W. H., Nick Street, W., & Mangasarian, O. L. (1992). Diagnostic Wisconsin Breast Cancer Database. Retrieved November 1, 2013, from UCI
[4] Zhu, X. (n.d.). K-nearest-neighbour: An Introduction to Machine Learning. In X. Zhu, Machine Learning. Madison: University of Wisconsin.
[5] Floyd, C. J., Lo, J., Sullivan, D., & Kornguth, P. (1994). Prediction of breast cancer malignancy using an artificial neural network. PubMed, 74-85.
[6] Trisic, J. (n.d.). Predicting the class of breast cancer with neural networks. Retrieved November 13, 2013, from Java Neural Network Framework:
http://neuroph-.sourceforge.net/tutorials/PredictingBreastCancer/PredictingBreastCancer.html [7] Saritas, I. (2012). Prediction of Breast Cancer using Artificial Neural Networks.
Medical Systems, 2901-2907.
[8] Mangasarian, O. L., & Holberg, W. H. (1992). Machine Learning for Cancer Diagnosis and Prognosis. Retrieved November 1, 2013, from University of Wisconsin - Madison: http://pages.cs.wisc.edu/~olvi-/uwmp/cancer.html
[9] Endo, A., Shibata, T., & Tanaka, H. (2008). Comparison of Seven Algorithms to Predict Breast Cancer Survival. Biomedical Soft Computing and Human Sciences, 11-16.
[10]Zhang, K. (n.d.). http://www.cse.ust.hk/~ twinsen/. Retrieved December 12, 2013, from www.cse.ust.hk/~twinsen/Decision-_Tree.ppt
[11]StatSoft, I. (2013). Electronic Statistics Textbook. Tulsa, Oklahoma, United States of America.