CHAPTER III
RESEARCH METHODOLOGY
This chapter discuss about the research methode. Research method is the step how to get the result of the study. it covers research type, research design, time and place, sample and population, research instrument, data collection procedure and data anlisys procedure.
A. Research Type
The writer used the quantitative method to analyze the data. Quantitative research deal with question of relationship, current status that writer can answer by gathering and statistically analyzing numeric data. It can be further classified as experimental and non-experimental.1 The quantitative used to analisys data of Dayakese students motivation in learning English of senior high school in Palangka Raya at SMA NEGERI 4 Palangka Raya. Focus on Dayakese students whom learn English.
B. Research design
The design of this study is descriptive quantitative design because the writer want to describe of Dayakese students motivation and to know the motivation Dayakese students usually use in learning English of senior high school in Palangka Raya at SMA Negeri 4 Palangka Raya. This study
1
performs descriptive quantitative research. It is using quantitative approach because quantitative is the data that from of number using statistic data. According to Jujun states in Rahardjo “dalam penilitian kuantitatif, dapat
dikatakan bahwa metode yang digunakan selalu menurut alur berfikir
ilmiah yang disebut logico-hipotetico-verification”.2From the statement, it help the writer to find out the result of Dayakese student motivation and the motivation that Dayakese students usually use in learning English of senior high school in Palangka Raya at SMA NEGERI 4 Palangka Raya. Focus on Dayakese students whom learn English.
So descriptive quantitative research means to find out and describe the phenomena through the process observation, questionare, and documentation in detail and clearly as reality.
C. Time and Place
The study conduct in academic year 2016/2017. The place of this study at senior high school in Palangka Raya, it is at SMA Negeri 4 Palangka Raya on Sisingamangaraja III street Palangka Raya. In SMA Negeri 4 it have heterogen students, it means in this school not only Dayakese learner but also javanese, sunda, betawi learners to. Its reasaon why writer take this place, but writer did not compare their motivation to another ethic this is only Dayakese ethic.
2
D. Sample and Population
Sugiono states if the objects that have some qualities and characteristics that are chosen to be learned and to be conclude by the researcher.3Population is the full set of data from which a subset (sample) is taken. In this study sample took at senior high school in Palangka Raya, it is at SMA Negeri 4 Palangka Raya on Sisingamangaraja III street Palangka Raya.
According to Sugiono sample is a part of total and characteristic that is prossessed by population.4 Sampling is the process of selecting the individuals for a study in such a way that the individuals represent the large group from which they are selected. This study using purposive sampling that the elements selected for the sample are chosen by the judgment of the researcher. In this study sample took at senior high school in Palangka Raya, it is at SMA NEGERI 4 Palangka Raya.
The sample was took at X grade that consist of 12 class room were each class consist of 40 or 41 students. The students are in a class room is blend ethnic. From X grade the was found 486 students who life in different ethnic and they are classified into Dayakese, blend ethnic, the other ethnic (their ethnic is not Dayakese), that shows in percentage.
3
Sugiono,Metode Penelitian Pendidikan Pendekatan Kualitatif, Kuantitatif dan R&D, bandung : alfabeta, 2010. P.117
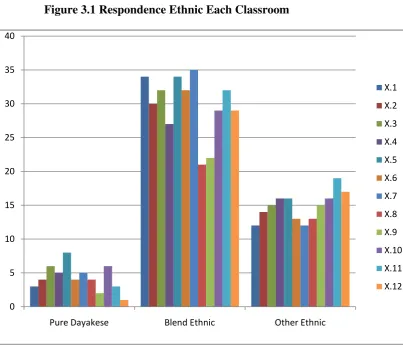
Figure 3.1 Respondence Ethnic Each Classroom
Based on the respondence ethnic there are different value. That blend Dayakese is bigger than not Dayakese and not Dayakese is bigger than pure Dayakese. Than from the figure will be shown in percentage value.
0
Pure Dayakese Blend Ethnic Other Ethnic
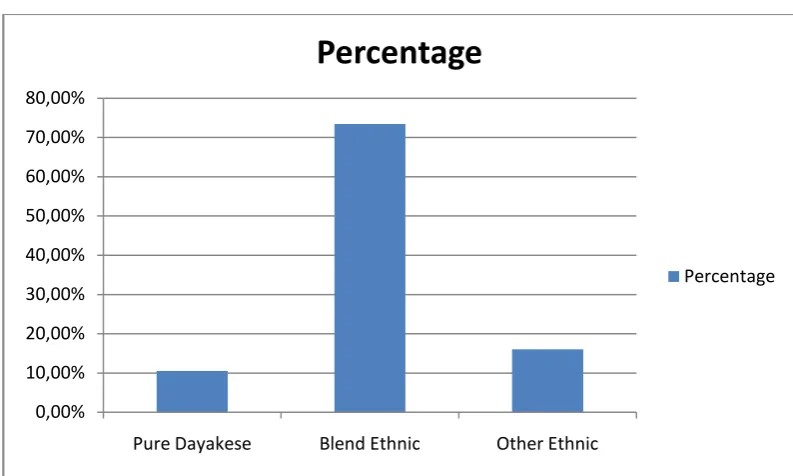
Figure 3.2 Percentage of Ethnic
from the figure that can be seen if the pure Dayakese is 10,49 % its about 51 respondence, blent ethnic is 73,45% its about 357 respodence and the other ethnic is 16,04% its about 178 respondnce.
E. Research Instrument
The instrument that used in this study is a questionaire. which adapt from the original 7-point likert scale format of Gardener’s Attitude/ Motivation Test Battery (AMI) ranged from ‘strongly agree’ to ‘strongly
disagree’.
A Likert scale has several defining characteristics, namely a declarative statement, and a number of response categories that have distinct cut-off points and assume linearity and equal intervals between them. These characteristics are now discussed in more detail. In a Likert-response item
0,00% 10,00% 20,00% 30,00% 40,00% 50,00% 60,00% 70,00% 80,00%
Pure Dayakese Blend Ethnic Other Ethnic
Percentage
with choices varying from “Strongly Disagree” to“Disagree to “Neutral”, to
“Agree” to“Strongly Agree”, it would appear to be in the mind of the research
participant whether or not there is an equal distance between each of these choices. Note that the above response options are balanced in that the items to the left of “Neutral” have an equal number of counterparts to the right of
“Neutral”. If the response choice is unbalanced to either side, the possibility
of that item being an interval measurement seems greatly diminished.
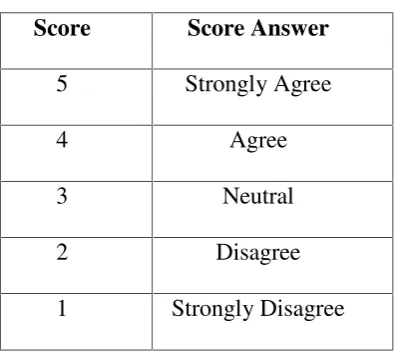
Table 3.1 Score Answer
Score Score Answer
5 Strongly Agree
4 Agree
3 Neutral
2 Disagree
1 Strongly Disagree
1. Research Instrument validity
interpretation and meaning of the scores derived from the instrument.5 Simply, it can be said he instrument be valid, if it measure accurately what is intended to measure. Therefore, related to the study the instrument measure the students motivation in learning focus on Dayakese.
To know the validity level of the instrument, the result of the test interprets to the criteria coefficient correlation, with the pearson product moment formula.6
The validity of instrument know with formula:
∑ (∑ )(∑ ) ∑ (∑ ) ∑ (∑ )
Where :
: Numeral of index corelation ‘r’ product moment
N : Total sample
: Amount X score and Y score
: Amount X score
: Amount Y score
5
Donal Ary Et All, Introduction To Research In Education, 8th Edition, Canada: Wadsworth Cangage Learning, 2010, P. 225
6
To know the validity level of the instrument, the result of the test interprets to the criteria coefficient correlation.7
0,00-0,20 = very poor validity 0,21-0,40 = poor validity 0,41-0,60 = fair validity 0,61-0,80 = high validity 0,80-1,00 = very high validity
The validity of instrument try out
Based on the result of instrument try out were consist of 13 items. It found 10 item instruments is valid and 3 item instrument is invalid. The valid instrument can be use to get the data of Dayakese students motivation in learning English. To know students motivation usually use be able refers to internal or extrinsic and intrinsic motivation.
2. Research Instrument reliability
Reliability is a necessary characteristic of any good test for valid at all. A test must be reliable as a measuring instrument. For the measurement of instrument try out reliability could be known that te whole numbers of tests item were reliable or not. For the measurement of instrument try out reliability it is know thet the whole numbers of test
7
items are reliable and can be used as the nstrument of the study. The reliability of the whole test can be estimate use the formula
The reliability of the instrument know with Cronbach’s Alpha. In statistics classical test theory, Cronbach alpha is used as a lower bound estimate of the reliability of a psychometric test.
formula :
=
( − 1) 1 −
Ʃ
Where :
K k : Number of Item
R r : Reliability of instrument
Ʃ : Total varians item : Total varians
To know the reliable of the instrument, the result of the test interprets to the criteria coefficient correlation follow :
r≥ 0.9 = excellent 0.9 > r≥ 0.8 = good 0.8 > r≥ 0.7 = acceptable 0.7 > r ≥ 0.6 = questionable 0.6 > r ≥ 0.5 = poor
The reliability of instrument try out
Total varian butir ( item ) / Ʃ = 7,09333
Total varian / = 33,7067
Koefisien cronbach alpha / =
( ) 1 −
Ʃ
=[ ][1- ,
, ]
= 0,78956 Reliable
F. Data Collection Procedure
One of main duties in this study to collect the data for answer the problem of the study above. The data collected natural without manipulation of the setting. Data collection technique use in this study, namely : observation, questionare, and documentation.
1. Observation
Agrosino states in Latief quantitaive research data is gathering by observing people in higly controlled setting in which the researcher control all the variables involved, with the aim of experimetally testing specific hypothesis.8Observation refers to one of tecnique in gathering data. Observation is used a tecnical term in research with its specific meaning. Observation usually refers to the use our visual sense to record and make sense of information.
8
2. Questionnaire
Questionare is a written instrument consisting of questions to be answered statement to be responded by respondents.9 Best J W and Khan J V in Adnan states” questionnaire used to gather information
about fact or about opinion/attitude. Some researches use some
instrument to gather information on opinion or attitude scales, some
other use questionnaire to gather both information about fact as well as
about opinion attitude”.10 Questionnaire may take a cloossed form or an open form to be sellected by respondent. writer use close form questionare to ask respondents to give answer of responses freely. With close form questionnaire is that easy for writer to prepare and it gives freedom to respondents to give answer.
The data are obtained through out questionnaire for some of students. The questionnaire consists of some question related to motivation in learning English were in the questionaire is consist the internal and external motivation. Every question has values ranging from 1-5, consist of strongly agree = 5, agree = 4, neutral = 3, disagree = 2, strongly disagree = 1. The student’s answer classifying based on the following classification.
a. 0%-19,99% “Strongly disagree” b. 20%-39,99% “Disagree”
c. 40%-59,99% “Neutral/enought” d. 60%-79,99% “Agree”
e. 80%-100% “Strongly agree” 3. Documentation
Through documentation technique, the writer try to get the data related to the study. Documentation is technique of collecting the available documentation for te program being evaluated.11 Documentation its mean when the writer do research writer take documentation with the subject or another relevant sources.
In this study data collection procedure that witer aplly. Writer come to the class, give the students questionnaire and let them to answer all of questionnaire in seriously. Before it writer explain what should they do. If they finish blank it writer collect questionnaire that students fill. Than writer analysis students response.
G. Data Analisys Procedure
Data analysis procedure is the last steps in the procedure, in this case processing the data. The data obtained from the questionnaire analysis using statistic calculation. Data concerning subjects’ general background as well as
their comment were calculated and presented in percentage. A five point
11
likert scale used to measure the level and the type of the subjects’ learning
motivation. Such scale used in the questionnaire to specify the level of the agreement or disagreement. The result show in perecentage of students learning motivation in eglish.
Likert scale formula :
T X Pn
Where :
T : Total respondence
Pn : Choise score of likert scale
To find the interpretation of likert scale, need high score as Y of respondence choice answer and low score as X respondence choice answer. Its mean Y is 5 and X is 1. Than conclude it with persentase, the formula for getting index persentase is :
Index % = total score (Y) X 100
With the interval I=100/ total score (likert)
The data obtained from the questionares analisys using Ms excel program and manual method. The data concerning subjects’ general
learning motivation . such scale used in questionaire to specify the level of the strongly agree and strongly disagree based on the following criteria.
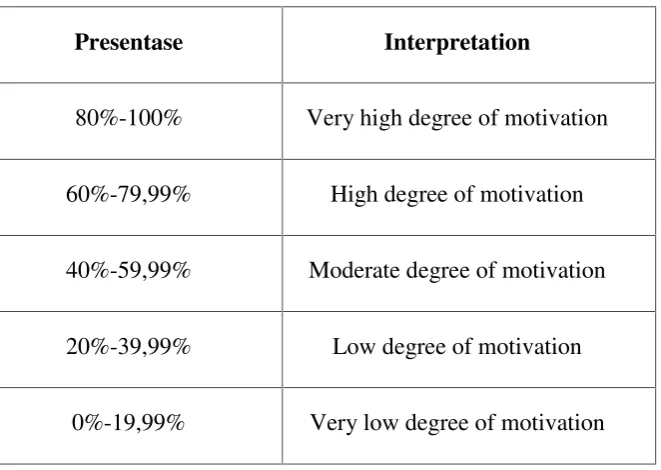
Table 3.2 interpretation of students learning motivation
Presentase Interpretation
80%-100% Very high degree of motivation
60%-79,99% High degree of motivation
40%-59,99% Moderate degree of motivation
20%-39,99% Low degree of motivation