1
CHAPTER III
RESEARCH METHOD
This chapter discusses research design, time and place of the study,
population and sample, research instrument, research instrument try out, research
instrument validity, research instrument reliability, data collection procedure and
data analysis procedures.
A. Research design
The design of this study was experimental design. Experimental design is a
plan for an experiment that specifies what independent variables will be applied,
the number of levels of each, how subjects are assigned to groups, and the
dependent variable.1 The writer used the experimental design because the writer wanted to measure the effectiveness of using English song on students’
vocabulary score.
The type of this study was quasi-experimental study. Quasi-Experimental
design are similar to randomized experimental designs in that they involved
manipulation of an independent variable but differ in those subjects in that they
involve manipulation of an independent variable but differ in that subjects are not
randomly assigned to treatment groups. 2
The writer used quasi experiment
because it is not random assignment of subjects to experiment and control group.
1
Donal Ary, Introduction to Research in Education (Eight edition), United State: Wadsworth (engange learning), 2010,p. 641.
2
Ibid, p. 648.
B. Time and Place
The place of this study was SMP Islam Nurul Ihsan Palangka Raya. It located
at Murjani Street. In this study, the writer conducted study two months to collect
the data.
C. Population and sample
1. Population of study
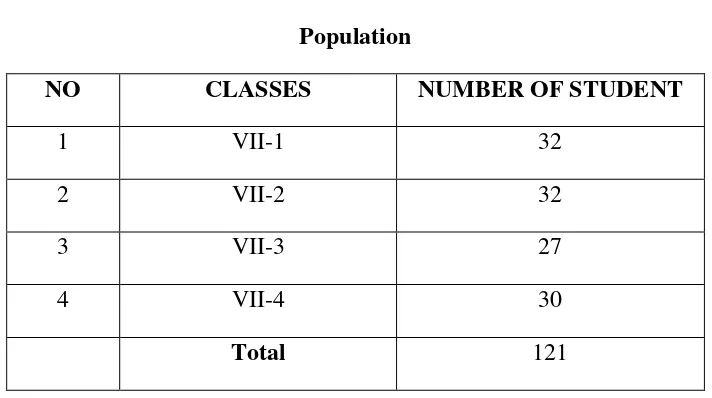
A population is defined as all members of any well-defined class of people,
events, or objects.3 The population of this study was seventh grade students at SMP Islam Nurul Ihsan Palangka Raya, there were five classes and the number of
students are:
Table 3.1
Population
NO CLASSES NUMBER OF STUDENT
1 VII-1 32
2 VII-2 32
3 VII-3 27
4 VII-4 30
Total 121
3
2. Sample of the study
A sample is a portion of a population.4 The writer took two classes to be the sample. The first class was experiment group uses English song media. The
second class was control group uses without English song media. The writer took
two classes: VII-2 and VII-4 as the sample of the study. The randomized
technique was used in the study.
Table 3.2 Number of Sample
NO Group Class of student Number of student
1 E VII Group B 30
2 C VII Group A 32
Total 62
E : Experiment Group
C : Control
Table 3.3
Design of pre-test and post-test
Group Pre-test Treatment Post-test
Experiment Group T I X Y 2
Control Group T 1 - Y 2
4
D. Research Instruments
To get the data, the writer used this media in this study. Here, the writer
used test.
a. Test
A test is a set of stimuli presented to an individual in order to elicit response
on the basis of which a numerical score can be assigned.5 According to H Brown Douglas, test is method of measuring a person’s ability or knowledge in a given
domain.6
To get the data, the writer did the test; it consisted of Pre Test and Post
Test. To get the data, the writer did the test; it consists of pre test and post test.
The function of pre test was to knew how many students’ vocabulary before they
use English song media. And the function of post test is to know how many
students’ vocabulary after they uses English song as media.
The writer made test based on the material and be appropriated with
syllabus that used by the school. In this study, the writer used multiple-choice to
check the students’ vocabulary mastery. As Thurnburry suggestion that amultiple
choice tests are popular way to testing in that they are easy to score and they are
easy to design.7
5 Ibid
, p. 201.
6
H Brown Douglas, Principle of Language Learning and Teaching 4th Edition, New York: Longman, 2001, p. 384.
7
The writer chose multiple choice because it is one of the most common
formats in proffesionally developed language tests. There are four advantages
associated multiple choice, such as:8
1) They are very reliable because of written well, there is only one correct
answer.
2) They are quick and easy to mark and there by deemed very practical from
a teacher’s perspective.
3) Versatility, as multiple choice question format can be used to assess
knowledge at various levels from beginning to advanced.
The test was constructed in the form of multiple choices which consists of
56 items test, because if there are an invalid items, the writer only select a valid
items, so the writer not repeat the try out.
In connection with the score of students’ test, the writer used scoring
rubric as seen in table 3.4 as follows:
Table 3.4
Scoring Rubric for Students’ Vocabulary Score9
No Classification Score
1 Very Good 90-100
2 Good 70-89
3 Fair 50-69
4 Poor 30-49
8
Christine C, Assessing Vocabulary in The Language Classroom, Malaysia English Language Teaching Association: Malaysia, p. 116-117.
9
5 Very Poor 10-29
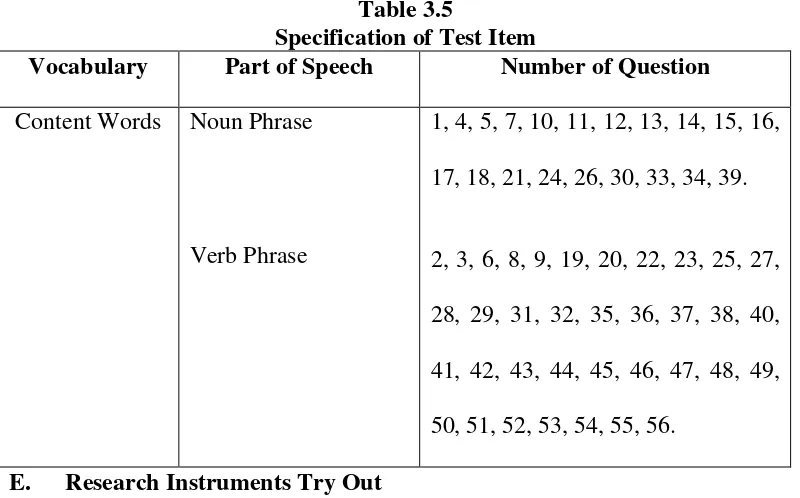
The test constructed in multiple choice form which consisted of 100 items.
The test item can be seen in the following table 3.5:
Table 3.5
Specification of Test Item
Vocabulary Part of Speech Number of Question
Content Words Noun Phrase
Verb Phrase
1, 4, 5, 7, 10, 11, 12, 13, 14, 15, 16,
17, 18, 21, 24, 26, 30, 33, 34, 39.
2, 3, 6, 8, 9, 19, 20, 22, 23, 25, 27,
28, 29, 31, 32, 35, 36, 37, 38, 40,
41, 42, 43, 44, 45, 46, 47, 48, 49,
50, 51, 52, 53, 54, 55, 56.
E. Research Instruments Try Out
The writer gave test of try out to seventh grade students at SMP Islam
Nurul Ihsan Palangka Raya. The writer took one class: VII-4, the number of
student is 34 students. These were the procedures that in carrying out this try out
as follows:
a. The writer prepared the instrument try out.
b. The writer asked the students to do the test of try out.
c. The writer collected the student’s answer.
d. The writer calculated the result of try out.
f. If the results are valid, it means that the test items as the instrument of this
study is suitable to give.
F. Research Instruments Validity
Validity of a test is the extent to which the test measures what is intended to
measure.10 There are two types of validity: 1. Content Validity
This kind of validity depends on a careful analysis of the language being
tested and of the particular course objectives. The test should be so constructed as
to contain a representative sample of the course, the relationship between the test
items and the course objectives always being apparent.11 In making the test, the writer tries to match each of the test items with the syllabus that used by SMP
Islam Nurul Ihsan Palangka Raya. The writer makes the test content (question) is
related with material will teach to the students.
2. Construct Validity
If a test has construct validity, it is capable of measuring certain specific
characteristics in accordance with a theory of language behavior and learning.12 Type of test is vocabulary test, and the form of test is multiple choices. In this
study, the test is written test to measure the students’ vocabulary knowledge.
10
Norman E. Gronlund, Measurement And Evaluation In Teaching (Fifth Edition), New York: Macmilan Publishing Company, 1985, p. 11.
11
J. B. Heaton, Writing English Language Tests, Longman, 1975, p. 154.
12Ibid
To measure the validity of the instrument, the writer uses the formulation of
product moment by Pearson follows. The criteria of interpretation of the
validity:13
Where:
: Numeral of index correlation ‘r’ product moment
N : Total of sample
∑XY : Amount of the product between X score and Y score
∑X : Amount of the x score
∑Y : Amount of the y score
Furthermore, it was calculated using test t calculation as follow:
Where:
t : The value of t observed
r : The coefficient of correlation of the result of r observed
n : Number of students
The distribution of t table at alpha 5% and degree of freedom (n-2) with the
measurement of validity using these criteria:
13
t observed ˃ t table = valid
t observed ˂ t table = invalid
To know the validity level of the instrument, the result of the test will
interprets to the criteria below:14 0,80 - 1000 = very high validity
0,60 - 0,799 = high validity
0,40 - 0,599 = fair validity
0,20 - 0,399 = poor validity
0,00 - 0,199 = very poor validity
3. Index difficulty
The index of difficulty (or the facility value) of an item simply shows how
easy or difficulty the particular item proved in the test. The index of difficulty
(F.V) is generally expressed as the fraction (or percentage) of the students who
answered the item correctly. It is calculated by using the formula:
R is represents the number of correct answer and N is the number of
students taking the test.15 The result of the test was interpreted to the criteria below:16
0,00 – 0,30 = Difficult
14
Ibid, p. 76.
15
J. B. Heaton, Writing English Language Test, Longman, 1975, p. 172.
16
0,31 – 0,70 = Fair
0,71 – 1,00 = Easy
The result of index difficulty measurement of the try out:
NO CRITERIA ITEMS
Reliability also means the consistency with which a test measures the same
thing all the time. Reliability of a test refers to its consistency with which it yields
the same rank for an individual taking the test several times.17 The reliability of the whole test can be estimated by using the formula:
Where:
k : Number of items
s : Standard Deviation
: Result of square between p and q
The qualification of reliability as follows:18
0,800 - 1,000 = very high validity
17
Norman E. Gronlund, Measurement And Evaluation In Teaching (Fifth Edition), New York: Macmilan Publishing Company, 1985, p. 14.
18
0,600 - 0,799 = high validity
0,400 – 0,599 = fair validity
0,200 – 0,399 = poor validity
0,00 – 0,199 = very poor validity
H. Data Collection Procedure
To get the data, the writer used some ways in this study. Those ways were:
1. The writer chose the place of the study.
2. The writer gave try out for class VII-3on Saturday, 7th November 2015 at 08.05 am. Try out held at SMP Islam Nurul Ihsan Palangka Raya. It consist
of 100 items from 7 songs.
3. The writer determined two groups, the first group was experiment group
using English song media and the second group was control group without
using English song media.
4. The writer gave pre test to both classes are class VII-2 and VII-4 (experiment
group and control group). Pre test for VII-2 occured on Thursday 12nd, November 2015. Meanwhile, pre test for VII-4 occured on Saturday 21st, November 2015.
5. The writer checked the result of pre test.
6. The writer gave treatment (teaching) to the experiment group using English
song media only three times, because based on the syllabus the allocation of
time only 4 x 40 times for teaching. and the control group using without
7. The writer gave post test to both classes. It occured on Thursday 19th, November 2015 for control group and on Saturday 28th, November 2015 for experimental group.
8. The writer checked the result of post test.
9. The writer gave score to students’ answer (pre test and post test).
I. Data Analaysis Procedure
To analyze the data, the writer used some procedures in this study:
1. The writer gave test to the students of the seventh grade students at SMP
Islam Nurul Ihsan Palangka Raya.
2. The writer collected the data of the students’ test result.
3. The writer gave score the students’ test result by using the formula:
Where:
B : Frequency of the correct answer
N : Number of test items
4. The writer tabulated the data into the distribution of frequency of score table,
then looking for the mean, median and modus of students’ score, standard
deviation, and standard error of experiment group and control group.
a. Mean
Where:
Fx : Total result product between each score with frequency
N : Number of case
b. Median
Where:
Mdn : Median
N : Number of case
Fkb : Cumulative frequency located in under interval contain median
Fi : Authentic frequency (frequency of score contain median)
i : Interval class
c. Modus
Where:
Mo : Modus
Fa : frequencylocated in above interval contain modus
Fb : frequencylocated in under interval contain modus
i : Interval class19
d. Standard Deviation
Where:
19
SD : StandardDeviation
i : Interval
N : Number of students
e. Standard Error
Where:
Sem : Standard Error
Sd : StandardDeviation
N : Number of students20
5. The writer calculated normality and homogeneity.
a. Normality
It isused to know the normality of the data that is going to be
analyzed whether both groups have normal distribution or not.
Chi square is used here:21
=
Where:
= Chi square
= frequency from observation
= expected frequency
20Ibid
, p. 60.
21
Calculation result of is compared with x table by 5% degree of
significance. If is lower than x table so the distribution list is normal.
b. Homogenity
It is used to know whether experimental group and control group,
that are decided, come from population that has relatively same variantor
not. The formula is:22
F =
Where:
F : Frequence
The hypotheses in homogeneity:
Fvalue ≤ Ftable, means both of variants are homogeneity.
Fvalue > Ftable, both of variants are homogeneity.
If calculation result of Fi slower than F, table by 5% degree of significance so
Ho is accepted, it means both groups have same variant.
6. The writer calculated the data by using t-test to test the hypothesis of the
study. To examine the hypothesis, the writer uses t-test formula as follows:
Where:
M1-M2 : The difference of two mean.
SEm1-m2 : The standard error of difference between two mean.
To know the hypothesis is accepted or rejected using the criterion:
22
If t-test ≥ ttable, it means Ha is accepted and Ho is rejected.
If t-test ≤ ttable, it means Ha isrejected and Hois accepted.
23
7. The writer interpreted the result of t-test. The writer account degree of
freedom (df) with the formula as follows:
Where:
df : Degree of freedom
N1 : Number of subject group 1
N2 : Number of subject group 2
2 : Number of variable24
8. The writer discussed and concluded the result of data analysis.
To analyze the data has been collected; the writer uses some procedures in
this study:
9. The writer collected score of test (pre test and post test).
10. The writer arranged it into the table.
11. The writer calculated the mean, median, and modus score with the formula.
12. The writer analyzed the data have been collected.
13. The writer concluded the data.
23
Anas Sugiono, Pengantar Statistik Pendidikan, Jakarta: Rajawali Press, 1978, p. 372.
24