CHAPTER III
RESEARCH METHOD
A. Research Design
The design of this study was experimental design. Experimental design is a
plan for an experiment that specifies what independent variables will be applied,
the number of levels of each, how subjects are assigned to groups, and the
dependent variable.1 The writer used the experimental design because the writer wanted to measure the effectiveness of using personal vocabulary notes in
teaching vocabulary.
The type of this study was quasi-experimental study. Quasi-Experimental
design are similar to randomized experimental designs in that they involved
manipulation of an independent variable but differ in those subjects in that they
involve manipulation of an independent variable but differ in that subjects are not
randomly assigned to treatment groups.2 The writer used quasi experiment because it was not based on random assignment of subjects to experiment and
control group. The writer used quasi experiment by nonrandomized control group,
pre test–post test design. There were two groups in this design; they were
experiment group and control group. Pre-test was given to both groups to measure
the score of students before treatment was given. Experiment group was given
1
Donal Ary, Introduction to Research in Education (Eight edition), United State: Wadsworth (engange learning), 2010, p. 641.
2
Ibid p. 316.
treatment with using personal vocabulary notes and control group was taught
without using personal vocabulary notes (handout). Post-test was given to both
groups to measure the score of students after treatment was given. The scheme of
this design was:
Table 3.1
Design of pre-test and post-test
Group Pre-test Treatment Post-test
Experiment Group Y I X Y 2
Control Group Y 1 - Y 2
B. Time and Place
The place of study was SMP Muhammadiyah Palangka Raya. It located at
RTA Milono Street Km 1, 5. In this study, the writer conducted the research for
two months to collect the data. It was begun on March 28th until 14th April 2015.
C. Population and Sample of the Study
1. Population
A population is defined as all members of any well-defined class of people,
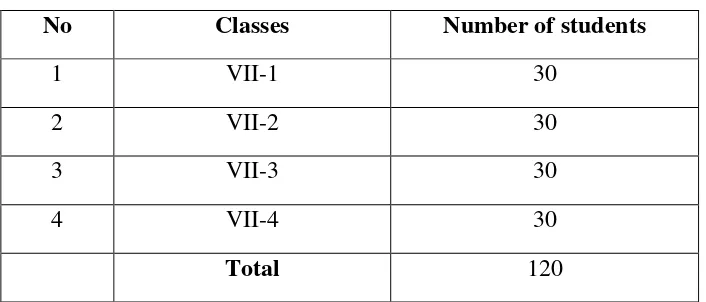
events, or objects.3 The population of this study was seventh grade students at SMP Muhammadiyah Palangka Raya, there were four classes and the number of
students were:
3
Table 3.2
Population
No Classes Number of students
1 VII-1 30
2 VII-2 30
3 VII-3 30
4 VII-4 30
Total 120
2. Sample
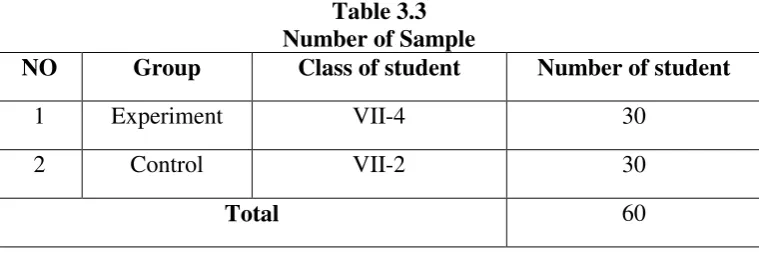
A sample is a portion of a population.4 In this study, the writer took two classes to be the sample. The first class was experiment group. This class was
treatment with using personal vocabulary notes. The second class was control
group. This class was taught with using handout. The sample of this study was
VII-4 as experiment class and VII-2 as control class which each class consist of
30 students. The number of student was 60 students. In this study, the writer used
cluster sampling because the unit chosen is not an individual but a group of
individuals who are naturally together or grouped by the school.5
4
Ibid, p. 148
Table 3.3 Number of Sample
NO Group Class of student Number of student
1 Experiment VII-4 30
2 Control VII-2 30
Total 60
D. Research Instruments
To get the data, the writer used test in this study. A test is a set of stimuli
presented to an individual in order to elicit responses on the basis of which a
numerical score can be assigned.6 According to H Brown Douglas, test is method of measuring a person‟s ability or knowledge in a given domain.7 To get the data, the writer did the test; it consisted of pre test and post test. The function of pre test
was to know pre-ability students‟ vocabulary knowledge before they used
personal vocabulary notes. And the function of post test was to know post-ability
students‟ vocabulary knowledge after they used personal vocabulary notes. The
test was used to see the result of students‟ vocabulary knowledge. The score of the
test was used to measure the effectiveness of personal vocabulary notes.
The writer made test based on the material and was appropriated with
syllabus that used by the school. The form of test was multiple-choices. Reason
why the items test was constructed in form of multiple choices, because multiple
choices was objective test. Objective test was made just as easy or as difficult as
6Ibid
, p. 201.
7
the test constructor wishes.8 In this study, the students tested with multiple choices test that matching the words with suitable meaning and the students confirmed
their knowledge of word by selecting suitable definition and synonym. So, the test
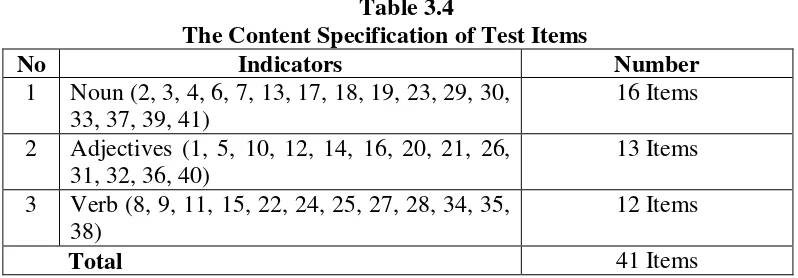
will really measure students‟ vocabulary knowledge. The test was constructed in
the form of multiple choices which consisted of 41 items test. 16 items test of
noun, 13 items test of adjectives, and 12 items test of verb as were showed in table
3.4. The writer took these three kinds of vocabulary because they were included
as four main forms of word. Four main forms of word consist of noun, verb,
adjectives, and adverb.9
Table 3.4
The Content Specification of Test Items
No Indicators Number
1 Noun (2, 3, 4, 6, 7, 13, 17, 18, 19, 23, 29, 30, 33, 37, 39, 41)
16 Items
2 Adjectives (1, 5, 10, 12, 14, 16, 20, 21, 26, 31, 32, 36, 40)
13 Items
3 Verb (8, 9, 11, 15, 22, 24, 25, 27, 28, 34, 35, 38)
12 Items
Total 41 Items
The test item was showed in appendix and adapted from some books and
internet. The writer took types of test based on J L Shanker‟ theory, Wesche and
Paribakht‟ theory and J B Heaton‟ theory.
8
J. B. Heaton, Writing English Language Tests, Longman, 1975, p. 12.
9
E. Research Instrument Try Out
The writer gave test of try out (50 items test) to seventh grade students at
SMP Muhammadiyah Palangka Raya (VII-1). It was conducted on Saturday,
March 28th, 2015, at 08.05 – 09.25 am; in VII-1 room with the number of student were 30 students. To get the data of try out, the writer used some procedures as
follows:
a. The writer made and prepared test of try out.
b. The writer gave test of try out to the students
c. The writer asked the students to do test of try out.
d. The writer collected the student‟s answer.
e. The writer calculated and gave score to the students‟ answer.
f. The writer analyzed the result of try out to know valid of test try out.
g. If the results were valid, it meant that the test items as the instrument of this
study is suitable to be give.
F. Research Instrument Validity
1. Instrument Validity
Validity of a test is the extent to which the test measures what is intended to
measure.10 There were three types of validity:
10
a. Face Validity
Face validity is if a test item looks right to other testers, teachers, moderators,
and testes.11 Descriptive Text was the learning material in the second semester at Junior High School. The face validity of the test items as follow:
1. The kind of test was Vocabulary Test.
2. The form of test items was Multiple Choices.
3. The language of items used English.
4. The test items were suitable to the Junior High School.
b. Content Validity
This kind of validity depends on a careful analysis of the language being
tested and of the particular course objectives. The test should be so constructed as
to contain a representative sample of the course, the relationship between the test
items and the course objectives always being apparent. 12 In making the test, the writer tried to match each of the test items with the syllabus that used by SMP
Muhammadiyah Palangka Raya. The writer made the test content (question) was
related with material was taught to the students.
11
J. B. Heaton, Writing English Language Tests, Longman, 1975, p. 153.
12
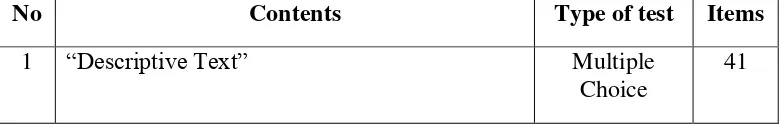
Table 3.5
Specification of Content Validity
No Contents Type of test Items
1 “Descriptive Text” Multiple
Choice
41
c. Construct Validity
If a test has construct validity, it is capable of measuring certain specific
characteristics in accordance with a theory of language behavior and learning.13 Type of test was vocabulary test; the form of test was multiple choices, and the
test was written test.
To measure the validity of the instrument, the writer used the formulation of
product moment by Pearson as follows:14
rxy =
𝑁 𝑋𝑌 − 𝑋 𝑌
𝑁. 𝑋2− 𝑋 ² 𝑁. 𝑌2− 𝑌 ²
Where:
rxy : Numeral of index correlation „r‟ product moment
N : Total of sample
∑XY : Amount of the product between X score and Y score
13Ibid
, p. 154.
14
∑X : Amount of the x score
∑Y : Amount of the y score
Furthermore, it was calculated using test t calculation as follow:
t observe = 𝑟 𝑛 −2 1− 𝑟²
Where:
t : The value of t observed
r : The coefficient of correlation of the result of r observed
n : Number of students
The distribution of t table at alpha 5% and degree of freedom (n-2) with the
measurement of validity using these criteria:
t observed ˃ t table = valid
t observed ˂ t table = invalid
To know the validity level of the instrument, the result of the test was
interpreted to the criteria below:15
0,800 - 1000 = very high validity
0,600 - 0,799 = high validity
15Ibid
0,400 - 0,599 = fair validity
0,200 - 0,399 = poor validity
0,00 - 0,199 = very poor validity
From the measurement of validity of the try out that was consisted 50 items
was known that there were 41 valid items (item 2, 3, 4, 5, 6, 7, 8, 9, 10, 11, 12, 13,
14, 15, 16, 17, 18, 20, 21, 22, 23, 24, 25, 26, 27, 28, 31, 32, 33, 34, 35, 37, 38, 39,
40, 41, 42, 43, 44, 46, and 50), and there were 9 invalid items (item 1, 19, 29, 30,
36, 45, 47, 48, and 49). For the detail explanation, it could be seen at appendix 8
for the measurement of validity of the try out.
d. Index difficulty
The index of difficulty (or the facility value) of an item simply shows how
easy or difficulty the particular item proved in the test. The index of difficulty
(F.V) is generally expressed as the fraction (or percentage) of the students who
answered the item correctly. It was calculated by using the formula: 16
𝐹.𝑉= 𝑅
𝑁
Where:
F.V : Facility Value.
R : Represents the number of correct answer.
16
N : The number of students taking the test.
The result of the test was interpreted to the criteria below:17
0,00 – 0,30 = Difficult
0,31 – 0,70 = Fair
0,71 – 1,00 = Easy
The result of index difficulty measurement of the try out showed that there
were 14 difficult items (item 2, 7, 10, 14, 15, 17, 19, 22, 28, 29, 34, 36, 39, and
41), there were 14 easy items (item 4, 8, 13, 21, 26, 30, 33, 37, 38, 42, 46, 47,49,
and 50), and there were 22 fair items (item 1, 3, 5, 6, 9, 11, 12, 16, 18, 20, 23, 24,
25, 27, 31, 32, 35, 40, 43, 44, 45, and 48). For the detail explanation, it could be
seen at appendix 10 for the calculation of index difficulty.
G. Research Instrument Reliability
Reliability also means the consistency with which a test measures the same
thing all the time. Reliability of a test refers to its consistency with which it yields
the same rank for an individual taking the test several times.18 The reliability of the whole test can be estimated by using the formula: 19
17
Suharsimi Arikunto, Prosedur Penelitian Suatu Pendektan Praktek, Jakarta: Rineka Cipta, 1999, p. 210.
18
Norman E. Gronlund, Measurement And Evaluation In Teaching (Fifth Edition), New York: Macmilan Publishing Company, 1985, p. 14.
19
𝑟11 = 𝑘
𝑘 −1
𝑠²− 𝑝𝑞
𝑠2
Where:
k : Number of items
s : Standard Deviation
𝑝𝑞 : Result of square between p and q
The qualification of reliability as follows:20 0,800 - 1,000 = very high validity
0,600 - 0,799 = high validity
0,400 – 0,599 = fair validity
0,200 – 0,399 = poor validity
0,00 – 0,199 = very poor validity
From the measurement of reliability of the try out was found that r11 = 0.98 >
rtable = 0.35. For the detail explanation, it could be seen at appendix 9 for the
measurement of reliability of the try out.
H. Data Collection Procedure
To get the data, the writer used some procedures as follows:
1. The writer chose the place of the study.
2. The writer determined two groups, the first group was experiment group and
the second group was control group.
3. The writer gave pre test to both classes (experiment group and control group).
4. The writer checked the result of pre test.
5. The writer gave treatment (teaching) to the experiment group using personal
vocabulary notes and the writer taught the control group using handout.
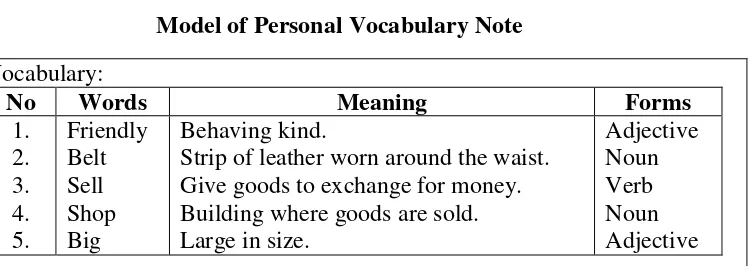
Table 3.6
Model of Personal Vocabulary Note
Vocabulary:
No Words Meaning Forms
1. 2. 3. 4. 5. Friendly Belt Sell Shop Big Behaving kind.
Strip of leather worn around the waist. Give goods to exchange for money. Building where goods are sold. Large in size.
Adjective Noun Verb Noun Adjective
We have a neighbor. His name is Mr iqbal. He is a friendly person. He has a big shop. We always go shopping there. He sells equipments of school like tie, hat, belt, bag, book, shoes, ruler, rubber, glue, etc. Beside, He also sells clothes, food and drink, etc.
6. The writer gave post test to both classes.
7. The writer checked the result of post test.
8. The writer gave score to students‟ answer (pre test and post test).
I. Data Analysis procedure
To analyze the data has been collected; the writer used some procedures in
this study:
1. The writer gave test to the students of the seventh grade students at SMP
Muhammadiyah Palangka Raya.
2. The writer collected the data of the students‟ test result.
Score = 𝐵
𝑁 × 100 21
Where:
B : Frequency of the correct answer
N : Number of test items
4. The writer tabulated the data into the distribution of frequency of score table,
then looking for the mean, median, modus, standard deviation, and standard
error of experiment group and control group.
Formula of mean, median and modus: 22 a. Mean
𝑀𝑥= 𝑓𝑥
𝑁
Where:
Mx : Mean
Fx : Total result product between each score with frequency
N : Number of case
b. Median
𝑀𝑑𝑛= 𝑢 −
1 2
𝑁 − 𝑓𝑘𝑎
𝑓𝑖 ×𝑖
Where:
21
Anas Sudijono, Pengantar Evaluasi Pendidikan, Jakarta: Rajagrafindo
22
Mdn : Median
N : Number of case
Fkb : Cumulative frequency located in under interval contain median
Fi : Authentic frequency (frequency of score contain median)
i : Interval class
c. Modus
𝑀𝑜= 𝑢 − 𝑓𝑏
𝑓𝑎+𝑓𝑏×𝑖
Where:
Mo : Modus
Fa : frequency located in above interval contain modus
Fb : frequency located in under interval contain modus
i : Interval class
Formula of standard deviation and standard error: 23 d. Standard Deviation
𝑆𝐷= 𝑓𝑥𝑁 ²
Where:
23
SD : Standard Deviation
i : Interval
N : Number of students
e. Standard Error
𝑆𝑒𝑚= 𝑠𝑑
𝑛−1
Where:
Sem : Standard Error
Sd : Standard Deviation
N : Number of students
5. The writer calculated normality and homogeneity.
a. Normality
It was used to know the normality of the data that is going to
be analyzed whether both groups have normal distribution or not. Chi
square was used here:24
2 = ( fo−fh )2
fh
Where:
𝟐 = Chi square
fo = frequency from observation
fh = expected frequency
24
Calculation result of 𝟐was compared with x table by 5% degree
of significance. If 𝟐 was lower than x table, so the distribution list was
normal.
b. Homogeneity
It was used to know whether experimental group and control
group, that are decided, come from population that has relatively same
variant or not. The formula is:25
F = Bigger Variant
Smaller Variant
Where:
F : Frequence
The hypotheses in homogeneity:
Fvalue ≤ Ftable, means both of variants are homogeneity.
Fvalue > Ftable, both of variants are homogeneity.
If calculation result of F was lower than F table by 5% degree
of significance so Ho was accepted, it meant both groups have same
variant.
6. The writer calculated the data by using t-test to examine the hypothesis of the
study. To examine the hypothesis, the writer used t-test formula as follows: 26
𝑡𝑜= 𝑀1− 𝑀2
𝑆𝐸𝑚1− 𝑚2
Where:
25
Ibid,p. 280 26
M1-M2 : The difference of two mean.
SEm1-m2 : The standard error of difference between two mean.
To know the hypothesis was accepted or rejected using the criterion:
If t-test ≥ ttable, it meant Ha was accepted and Ho was rejected.
If t-test ≤ ttable, it meant Ha was rejected and Ho was accepted.
7. The writer interpreted the result of t-test. The writer accounted degree of
freedom (df) with the formula as follows: 27
𝑑𝑓= (𝑁1 +𝑁2−2)
Where:
df : Degree of freedom
N1 : Number of subject group 1
N2 : Number of subject group 2
2 : Number of variable
8. The writer discussed and concluded the result of data analysis.
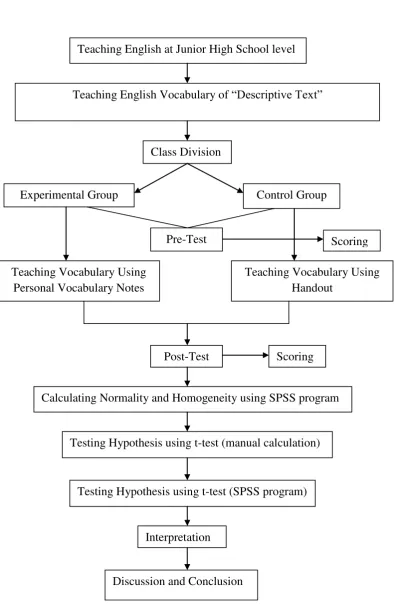
J. Summary
To sum up, the steps in collecting, analyzing, and testing hypothesis could be
described below. In the first step, the writer chose the place of the study. Second
step, the writer gave test of try out (Try out class). Third step, the writer divided
subjects into two groups; experimental group and control group. Fourth step, the
writer gave pre-test to the students and the writer gave score (experimental group
and control group). Fifth step, the writer gave treatment using personal vocabulary
notes for experiment group and the writer taught using handout for control group.
Sixth step, the writer gave post-test and the writer gave score (experimental group
and control group). Seventh step, before testing the hypothesis, the writer
calculated normality and homogeneity test using SPSS program. Eighth step, the
writer tested hypothesis to answer the research problem using t-test formula with
manual calculation. Lastly, discussion on the results was made to clarify the
Figure 3.1 Steps of collecting, data analysis procedure and testing
hypothesis
Teaching English Vocabulary of “Descriptive Text”
Class Division
Experimental Group Control Group
Teaching Vocabulary Using Personal Vocabulary Notes
Teaching Vocabulary Using Handout
Post-Test
Calculating Normality and Homogeneity using SPSS program
Testing Hypothesis using t-test (manual calculation)
Discussion and Conclusion
Scoring
Scoring Teaching English at Junior High School level
Pre-Test
Interpretation