Optimization Equivalence of Divergences Improves Neighbor Embedding
(Supplemental Document)
Zhirong Yang2
[email protected] Jaakko Peltonen1,4
[email protected] Samuel Kaski1,3
1
Helsinki Institute for Information Technology HIIT,2
Department of Information and Computer Science, Aalto University, Finland,3
Department of Computer Science, University of Helsinki, and4
University of Tampere
This supplemental document is organized as follows. Sec-tion1gives the source and brief descriptions of the datasets used in the paper. Section 2gives a detailed information retrieval interpretation of ws-SNE. Section3provides ad-ditional visualizations that do not fit within the page limit of the main paper.
1. Datasets
We present results of six datasets in the paper.
• shuttle: the data is from the UCI Machine Learn-ing Repository, Statlog (Shuttle) Data Set1. It contains 58000 samples from 7 classes, where each sample has 9 numerical shuttle attributes.
• MNIST: the data is from the MNIST database2. It con-tains 70000 handwritten digit images from 10 classes. We preprocessed the images by the scattering operator (Mallat,2012) and PCA, which yields 256 features for each sample.
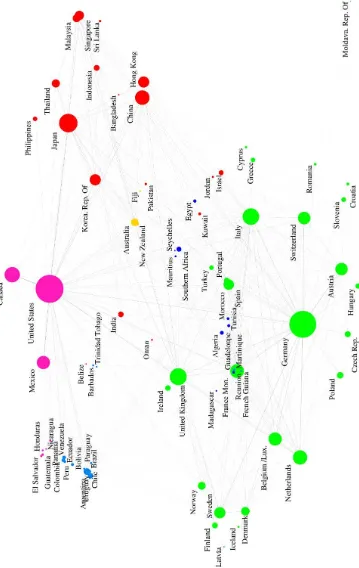
• worldtrade: the data is from Pajek datasets3. It is a weighted graph whose edges are trading amounts between 80 countries in the world.
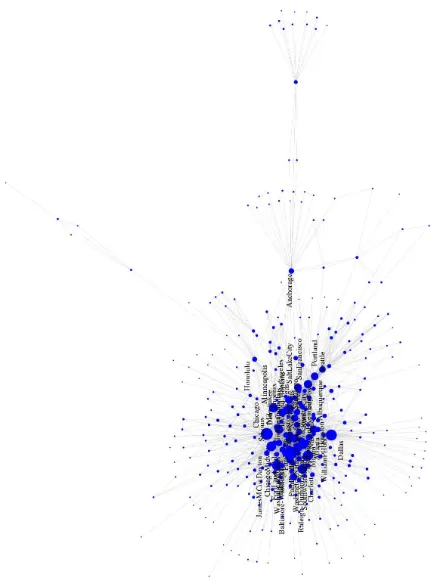
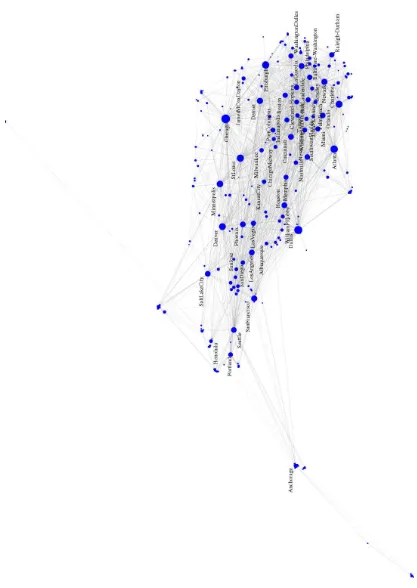
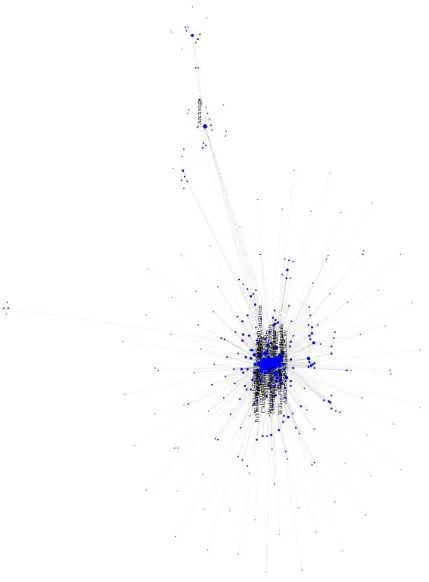
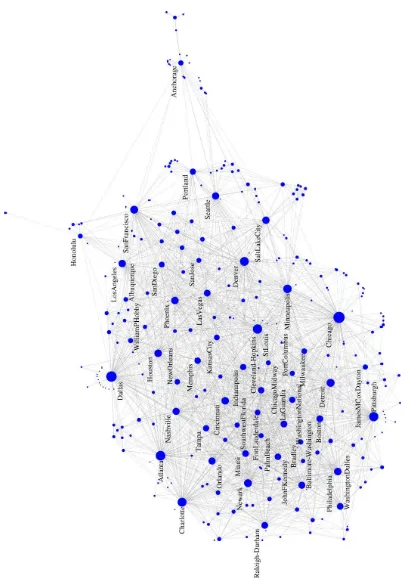
• usair97: the data is from the LinLog layout pack-age4. It is a binary graph where the nodes are 332 airports in the United States and the edges indicate whether there is direct flight between the airports.
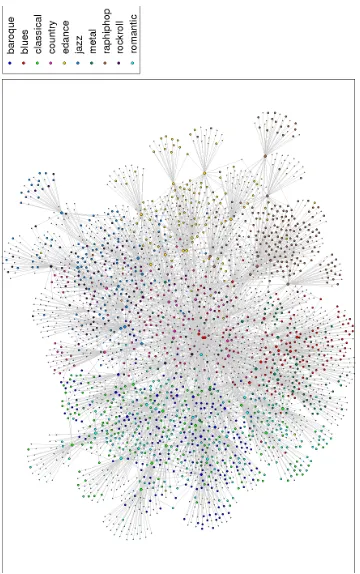
• mirex07: the data is from the the Third Music Information Retrieval Evaluation eXchange (MIREX 2007)5. We used the version from the collection by
1http://archive.ics.uci.edu/ml/
Chen et al. (2009). It is a similarity graph of 3090 songs. The songs are evenly divided among 10 classes that roughly correspond to different music genres. The weighted edges are human judgment on how similar two songs are.
• luxembourg: the data is from The University of Florida Sparse Matrix Collection6. It contains 114599 nodes and 239332 edges, where each edge is a street in Luxembourg.
To maintain the space limit in the paper, we present results of two other datasets in this supplemental document (see Section3):
• jazz: the data is from Arenas’s collection7. It is a social network of 198 musicians. The musicians are mainly in New York and Chicago, with a few in both places or in other places.
• ca-GrQc: the data is from Stanford Network Analy-sis Project8. It is a coauthor network among 5242 re-searchers working on general relativity. We extracted the largest connected component with 4158 authors.
2. Retrieval interpretation of ws-SNE
Supplemental Document
Notation. As in the main paper, let pij˜ = Ppij klpkl be a
symmetric input distribution jointly over nodes and their neighbors in the original space. Herepijare symmetric but not necessarily normalized, and the normalization in pij˜
ensuresP
be a distribution over nodes and their neighbors on the dis-play such thatqij is Gaussianqij = exp(−||yi −yj||2) or Cauchyqij = (1 +||yi−yj||2)−1. Note that again the qijare not normalized, and the normalization inqij˜ ensures
P
ijqij˜ = 1.
The joint distributionqij˜ depends on locations of nodes on the display and on their importances; intuitively, this distri-bution represents retrieval behavior of an analyst who looks at the display in a quick manner, noticing high-importance nodes and close-by other nodes, and the task of the visual-ization is to ensure that such retrieval of nodes and neigh-bors corresponds to the true neighneigh-bors represented inpij˜ . Each joint distribution over nodes can be written as a prod-uct of a marginal and a conditional distribution, so that
˜ Note thatP
ipi˜ = 1and
Inserting the above into the cost function of ws-SNE, the Kullback-Leibler divergence becomes a sum of two terms, a divergence between the marginals and a weighted mean of divergences between conditionals:
Jws-SNE(Y) (2)
where{pi˜}is the distribution formed by all valuespi, and˜
similarly for{qi˜}; and{p˜j|i}is the distribution formed by all valuesp˜j|ifor a fixedi, and similarly for{q˜j|i}. We next analyze the conditional divergences and provide an information retrieval interpretation for them, and then an-alyze the marginal divergence and provide an information retrieval interpretation for it.
2.1. Analysis of the conditional divergences
We first analyze the second term which is a weighted aver-age of Kullback-Leibler divergences between conditional distributions of neighbors. Each Kullback-Leibler diver-gence in the second term compares the true neighborhood of node i to an on-screen neighborhood where users are likely to retrieve close-by nodes, or nodes with high de-gree, and counts the cost of misses in such retrieval. We now show this has an information retrieval interpretation.
First, note that the weighted conditional output probabili-tiesq˜j|iin (1) can be written as
lqil are unweighted conditional output probabilities, which are based only on how close points are to points ion the display but not on the importances of the points. Here we denoted the denominator byGi =
P
kdk qik
P
lqil which is the weighted average importance of
nodes nearion the display, where the importance of each nodekis weighted by Pqik
lqil.
Analysis in a simplified situation. Consider a simplified situation where the input probabilitypj˜|itakes a high value Ai = 1−δ
Ri for Ri points and a low valueBi =
δ N−Ri−1
for other points, whereδis a very small positive number, and the unweighted output probability qij/P
kqik simi-The Kullback-Leibler divergence between the conditional input distribution{p˜j|i}and the weighted conditional out-put distribution{q˜j|i}can then be written as
AilogdjDi
Supplemental Document
− X
j∈SF P,i
BilogdjCi
Gi −
X
j∈ST N,i
BilogdjDi
Gi +constant (14)
where in this simplified situation
Gi=X
Analysis of dominating terms, and information re-trieval interpretation. Assuming that eachdj ≥1(and thus also thatGi ≥1), the dominating terms are the terms
1−δ
Ri log(djδ)≈ 1
Rilog(djδ)and the divergence simplifies
to neighbors which were not close to i on the display, and recall(i) = 1−NM ISS,i
Ri is the standard definition of recall,
the proportion of true neighbors retrieved from the display out of all the original true neighbors.
The last line of (27) provides an information retrieval in-terpretation of the divergence between the conditional dis-tributions. The term at left measures recall of neighbors. The term at right is a weighting term interpreted as the av-erage cost of the misses. In the weighting term, the cost of missing high-degree neighbors is discounted, in order to allow high-degree nodes to be kept farther from each other than in the unweighted setting; this prevents high-degree nodes from crowding and allows the method to distribute the high- and low-degree nodes more evenly.
Thus, when ws-SNE minimizes the weighted average of the Kullback-Leibler divergences (27), it optimizes recall of true neighbors from the display, weighted by severity of the missed neighbors.
2.2. Analysis of the marginal divergence
First, denote the unweighted marginal probability byqi =
P
jqij/
P
klqkl, and note that the weighted marginal out-put distributionqi˜ can then be written as
˜
The weighted marginal probability attains high values for nodesithat have high degree and that are near many other nodes of high degree. Nodes that are far from the other nodes (lowqi) have low marginal weighted probability. Now consider a simplified situation where some for some nodes the marginal probabilitypi˜ takes a high valueA =
1−δ
R for R points and low value B = δ
N−R for others, whereδ is a very small positive number, and on the dis-play the unweighted marginal probabilityqi takes a high valueC= 1−δ
The Kullback-Leibler divergence of the marginal distribu-tions can then be written as
Supplemental Document
Analysis of dominating terms, and information re-trieval interpretation. Assuming again that eachdi≥1
and thus also eachGi ≥ 1, the dominating terms are the terms wherei∈S′
M ISSsince there the term under the log-arithm isqi˜ ∝ qi which is close to zero. The divergence then simplifies to
DKL({pi˜}||{qi˜}) (35)
where on the second line we inserted the form ofqi˜ from (31). Further leaving out all but the dominating terms, this simplifies to
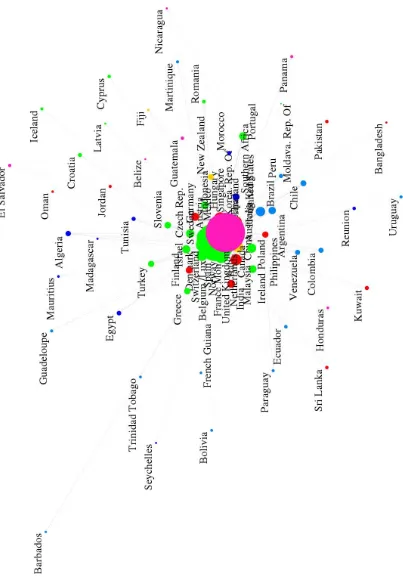
+constant (39)
=NM ISS
+constant (40)
=(1−recall)hlog1
+constant (41)
whereNM ISS = |SM ISS′ |is the number of initial nodes not chosen based on the display that were chosen based on original data, and recall= 1−NM ISS
R is the corresponding standard definition of recall.
The last line of (41) provides an information retrieval inter-pretation of the divergence between the marginal distribu-tions. The term at left evaluates recall of the initial nodes. The term on the right is again a weighting term evaluat-ing the cost of initial nodes left out (missed). The misses here denote points with lowqithat are far from other nodes and would not be chosen as initial nodes based on the vi-sual arrangement on the display. The weighting term dis-counts missing high-degree nodes (more precisely, nodes with high degreedi and high degreeGi of nearby neigh-bors), and thus allows them to be placed in sparser areas of the display than in an unweighted setting; this allows the high and low-degree nodes to be placed more evenly on the display.
Conclusion. Based on the separation of the ws-SNE cost function into two kinds of divergences, and the informa-tion retrieval interpretainforma-tion of both kinds of divergences, we conclude that the ws-SNE cost function corresponds to a two-stage information retrieval task of first choosing ini-tial nodes and then choosing neighbors for them. For both retrieval tasks, the method minimizes cost of errors in such retrieval which are dominated by costs of misses, and the degree (importance) of nodes is taken into account by dis-counting the costs of high-degree nodes in order to avoid crowding of the high-degree nodes on the display.
3. Additional visualizations
Figure 1 in the paper is high resolution, and readers can find more details by zooming in. The visualizations in this supplemental document provide extra information that can-not fit to the paper due to space limit. Moreover, we also provide the results of two other datasets.
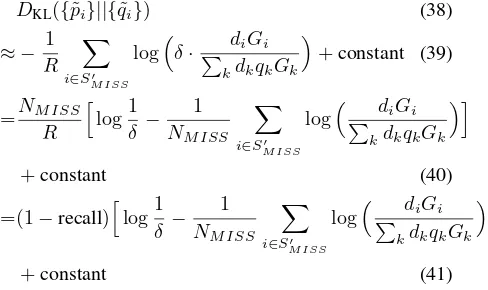
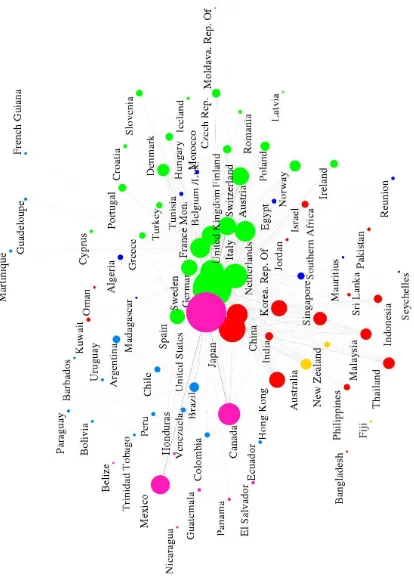
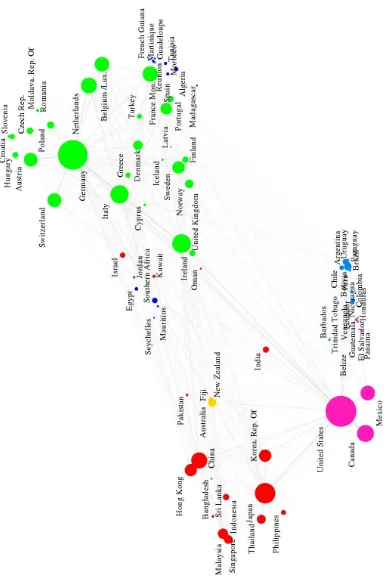
• Figures 1 to 4 shows the large visualization of the worldtradedataset using ws-SNE. It also displays the countries names and different node sizes to facili-tate comparison to our common knowledge.
• Figures 5 to 8 shows the large visualization of the usair97dataset using ws-SNE. It also displays the airport names and different node sizes to facilitate comparison to our common knowledge.
• Figures9 to12shows the large visualization of the mirex07dataset using ws-SNE. It also displays the class names and different node sizes to facilitate com-parison to our common knowledge.
• Figure 13 shows the geographical layout (ground truth) of theluxembourgdataset, which can be used to compared the sixth row in Figure 1 in the paper.
• Figure 14 shows the visualizations of the jazz dataset using graphviz, LinLog, t-SNE, and ws-SNE.
• Figure15shows the visualizations of theca-GrQc dataset using graphviz, LinLog, t-SNE, and ws-SNE.
• Figure 16 shows the full visualization of the shuttledataset using EE withλ= 1.
• Figure 17 shows the full visualization of the shuttledataset using ws-SNE.
Supplemental Document
Supplemental Document
Supplemental Document
Supplemental Document
Supplemental Document
Supplemental Document
Supplemental Document
Supplemental Document
Supplemental Document
Supplemental Document
Supplemental Document
Supplemental Document
Supplemental Document
Supplemental Document
Supplemental Document
Figure 15.Visualizations of theca-GrQcdataset using A) graphviz, B) LinLog, C) t-SNE, and D) ws-SNE. Cauchy kernel was used
in ws-SNE.Leskovec et al.(2009) has shown that for large coauthor networks, there is a central big community, as well as one or
Supplemental Document
Supplemental Document
Supplemental Document
Supplemental Document
References
Chen, Y., Garcia, E., Gupta, M., Rahimi, A., and Cazzanti, L. Similarity-based classification: Concepts and algo-rithms.Journal of Machine Learning Research, 10:747– 776, 2009.
Leskovec, J., Lang, K., Dasgupta, A., and Mahoney, M. Community structure in large networks: Natural cluster sizes and the absence of large well-defined clusters. In-ternet Mathematics, 6(1):29–123, 2009.