Infrared and Raman spectroscopic characterization
of the phosphate mineral kosnarite KZr
2(PO
4)
3in comparison
with other pegmatitic phosphates
Ray L. Frost•Yunfei Xi •Ricardo Scholz•
Fernanda M. Belotti
Received: 22 August 2012 / Accepted: 24 September 2012 / Published online: 4 October 2012
ÓSpringer Science+Business Media Dordrecht 2012
Abstract In this research, we have used vibrational spectroscopy to study the phosphate mineral kosnarite KZr2(PO4)3. Interest in this mineral rests with the ability of
zirconium phosphates (ZP) to lock in radioactive elements. ZP have the capacity to concentrate and immobilize the actinide fraction of radioactive phases in homogeneous zirconium phosphate phases. The Raman spectrum of kosnarite is characterized by a very intense band at 1,026 cm-1assigned to the symmetric stretching vibration of the PO43-m1symmetric stretching vibration. The series
of bands at 561, 595 and 638 cm-1are assigned to the m4
out-of-plane bending modes of the PO43- units. The
intense band at 437 cm-1 with other bands of lower wavenumber at 387, 405 and 421 cm-1is assigned to the
m2in-plane bending modes of the PO43-units. The number
of bands in the antisymmetric stretching region supports the concept that the symmetry of the phosphate anion in the kosnarite structure is preserved. The width of the infrared spectral profile and its complexity in contrast to the
well-resolved Raman spectrum show that the pegmatitic phos-phates are better studied with Raman spectroscopy.
Introduction
Kosnarite is a pegmatitic phosphate of formula KZr2(PO4)3.
The colour is variable and can be colourless, pale blue to pale green and orange. Other natural minerals related to kosnarite and their structure have been reported [1,2]. The mineral is found in several regions worldwide including the type locality in Mt Mica, near Paris, Maine USA, in the Black Mountain quarry, Maine USA, at Wycheproof, Victoria, Australia, and at Jenipapo district, Itinga, Brazil. The mineral is hexagonal– pseudocubic [3,4]. The cell data are space groupR3barcwith a=8.687 andc=23.877 withZ=6 [5].
It is interesting that the synthesis of analogues with a kosnarite structure has been forthcoming [3]. However, no spectroscopic measurements have been undertaken. Other natural minerals with a kosnarite structure, namely wyc-heproofite, have been reported [1]. The crystal structure of wycheproofite has been elucidated [6]. Another zirconium phosphate mineral is selwynite [2]. The reason why there is strong interest in the formation of zirconium phosphates [7] and rare earth phosphates is that these minerals can be used to lock in radioactive elements [8]. Synthetic orthophosphates are analogues of the natural mineral kosnarite that exhibits a wide range of distinctive physical and chemical properties including a tendency to wide isomorphism [9]. The presence of U, Np and Pu actinides (IV) of the total NZP crystalline modifications formulas KZr2(PO4)3 brings together the
crystal chemistry of the d- and f-elements to some extent. The knowledge of the crystal structures of kosnarite and related synthetic inorganic phases is important for better understanding the genesis of uranium deposits, interaction Electronic supplementary material The online version of this
article (doi:10.1007/s11243-012-9652-x) contains supplementary material, which is available to authorized users.
R. L. Frost (&)
Y. Xi
Science and Engineering Faculty, School of Chemistry, Physics and Mechanical Engineering, Queensland University of Technology, GPO Box 2434, Brisbane, QLD 4001, Australia e-mail: [email protected]
R. Scholz
Geology Department, School of Mines, Federal University of Ouro Preto, Campus Morro do Cruzeiro, Ouro Preto, MG 35,400-00, Brazil
F. M. Belotti
Federal University of Itajuba´, Campus Itabira, Itabira, MG 35,903-087, Brazil
of uranium mine and mill tailings with the environment, actinide transport in soils and the vadose zones and the performance of geological repositories for nuclear waste. Uranyl minerals are also observed as products of alteration (hydration–oxidation weathering) of spent nuclear fuel. Phosphate minerals exhibit considerable structural and chemical diversity and reflect geochemical conditions dominant during their formation. Uranyl oxide hydrates, such as the studied uranyl minerals, schoepite, becquerel-ite, billietbecquerel-ite, curite and vandendrieschebecquerel-ite, may be under-stood especially as weathering products of uraninite in the oxidized zone of uranium deposits. This suggests the pos-sibility of concentration and immobilization of the actinide fraction of radioactive phases in homogeneous NZP phases [9]. The synthesis and crystal chemistry of phosphates containing the actinide elements offers a mechanism for the capture and immobilization of radioactive nuclides [10].
In this work, samples of a pure, monomineral kosnarite from the Jenipapo pegmatite district, located in the municipality of Itinga, Minas Gerais, Brazil, were ana-lysed. Studies include spectroscopic characterization of the structure with infrared and Raman spectroscopy. To sup-port the mineral characterization, chemical analysis via electron microprobe analysis in the WDS mode (EMP) and using a scanning electron microscope was carried out.
Geological setting, occurrence and general appearance
The studied samples were collected from a granitic peg-matite in the Jenipapo district, located in the Piauı´ valley, municipality of Itinga. The region is well-known as an important source of rare phosphates and gemological minerals. The pegmatite is located in the Arac¸uaı´ pegmatite district, one of the subdivisions of the Eastern Brazilian Pegmatite province (EBP) [11]. The Arac¸uaı´ pegmatite district covers an area of about 10,000 km2, in the northern region of Minas Gerais, in the Jequitinhonha River basin, about 560 km north of Belo Horizonte.
The pegmatite is heterogeneous with well-developed mineralogical and textural zoning. The pegmatite is hosted by cordierite–biotite–quartz schists with minor intercalations of calcsilicate rocks of the Salinas Formation. Tourmalinization is observed in the contact between the pegmatite and the host rock. Hydrothermal and metasomatic fluids were responsible for the development of miarolitic cavities. Primary phosphates were not observed. The primary mineral association is rep-resented by quartz, muscovite, microcline, schorl and almandine–spessartine. The secondary association is mainly composed by albite, Li-bearing micas, cassiterite, elbaite and hydrothermal rose quartz. In the Jenipapo pegmatite district, secondary phosphates, namely eosphorite, fluorapatite, zan-azziite, montebrasite and ushkovite, occur in miarolitic
cavities in association with albite, quartz and muscovite. Kosnarite grows usually along the surface of albite, muscovite and montebrasite.
Experimental
Sample description and preparation
The kosnarite sample studied in this work was collected from a granitic pegmatite in the Jenipapo district and was incorporated in the collection of the Geology Department of the Federal University of Ouro Preto, Minas Gerais, Brazil, with sample code SAA-071. The crystals occur in association with albite in miarolitic cavities.
The sample was gently crushed, and the associated minerals were removed under a stereomicroscope Leica MZ4. The kosnarite sample was phase-analysed by X-ray diffraction. Electron microprobe and scanning electron microscopy were applied to support the mineralogical characterization.
Scanning electron microscopy (SEM)
Experiments and analyses involving electron microscopy were performed in the Center of Microscopy of the Uni-versidade Federal de Minas Gerais, Belo Horizonte, Minas Gerais, Brazil (http://www.microscopia.ufmg.br).
Kosnarite crystals were coated with a 5 nm layer of evaporated Au. Secondary electron and backscattered electron images were obtained using a JEOL JSM-6360LV. Qualitative and semi-quantitative chemical analysis in the EDS mode was performed with a ThermoNORAN equip-ment model Quest and was applied to support the mineral characterization.
Raman microprobe spectroscopy
The Raman spectrum of kosnarite is provided in the RRUFF data base [see http://rruff.info/kosnarite/display= default/]. The origin of the kosnarite was from Jenipapo District, Itinga, Minas Gerais, Brazil. No assignment of the bands is given in the RRUFF data base. The spectra were downloaded and are presented in the supplementary information as Figures S1 to S4.
Infrared spectroscopy
Infrared spectra were obtained using a Nicolet Nexus 870 FTIR spectrometer with a smart endurance single bounce diamond ATR cell. Spectra over the 4,000–525 cm-1range were obtained by the co-addition of 128 scans with a resolu-tion of 4 cm-1and a mirror velocity of 0.6329 cm/s. Spectra were co-added to improve the signal to noise ratio. The infrared spectra are given in the supplementary information.
Spectral manipulation such as baseline correction/ adjustment and smoothing were performed using the Spectracalc software package GRAMS (Galactic Industries Corporation, NH, USA). Band component analysis was undertaken using the Jandel ‘Peakfit’ software package that enabled the type of fitting function to be selected and allows specific parameters to be fixed or varied accord-ingly. Band fitting was done using a Lorentzian–Gaussian cross-product function with the minimum number of component bands used for the fitting process. The Lo-rentzian–Gaussian ratio was maintained at values[0.7, and fitting was undertaken until reproducible results were obtained with squared correlations ofr2[0.995.
Results and discussion
Chemical characterization
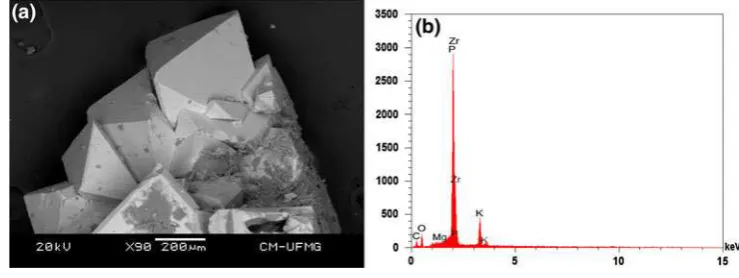
The SEM image of kosnarite sample studied in this work is shown in Fig.1. Kosnarite crystals show typical trigonal rhombohedra form. Qualitative chemical composition
shows a pure and homogeneous Zr and K phosphate as expected for kosnarite. A minor amount of Mg was also observed.
Spectroscopy
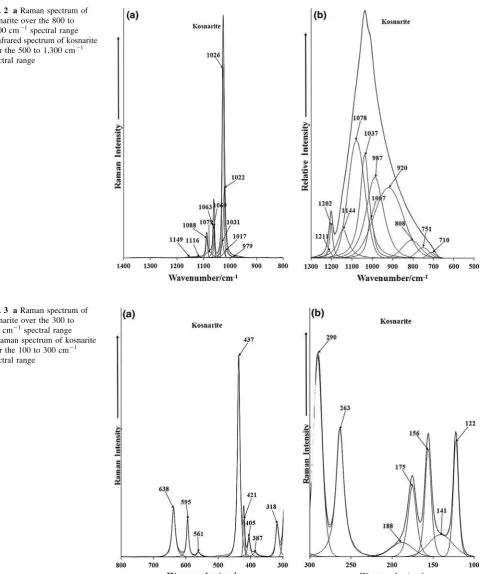
It is obvious that there is minimal intensity in the bands in the 2,600–4,000 cm-1spectral range. This region is where the OH stretching region occurs. The lack of intensity supports the fact that there are no OH groups in the structure of kosnarite. Some intensity may be due to adsorbed water. The spectra are subdivided into subsec-tions based upon the type of vibration being studied. Fig-ure2a displays the Raman spectrum of kosnarite over the 800–1,400 cm-1 spectral range. Figure2b illustrates the infrared spectrum expanded to the 500 to 1,300 cm-1 spectral range. In comparison, the infrared spectrum dis-plays a broad spectral profile which may be decomposed into component bands. In contrast, the Raman spectrum shows quite well-resolved bands.
The Raman spectrum is characterized by a very intense band at 1,026 cm-1assigned to the symmetric stretching vibration of the PO43-m1symmetric stretching vibration.
Two bands at 1,063 and 1,088 cm-1are attributed to the PO43- m3 antisymmetric stretching vibration. Other low
intensity bands are also found at 1,116 and 1,149 cm-1 which are assigned to this vibration. The Raman spectra of kosnarite given in Figures S1 and S2 show a very intense band at 1,025 cm-1with a shoulder at 1,020 cm-1. Raman bands were also found at 1,062 and 1,088 cm-1. The position of these bands is in good agreement with that reported in this work. The infrared spectrum shows a broad spectral profile which is attributed to the PO43-m3antisymmetric stretching
modes. A sharp peak at 1,202 cm-1is observed.
In some ways, the Raman spectrum of kosnarite does show a resemblance to the spectrum of beryllonite NaBePO4. The spectrum of beryllonite is dominated by a
single very sharp band at 1,011 cm-1. Often, the position of the symmetric stretching mode at lower wavenumbers,
for example, the band position for lithiophilite LiMnPO4,
occurs at 950 cm-1. The position of the band seems to be a function of the cation size. This band is assigned to them1
PO43-symmetric stretching vibration. Another pegmatitic
phosphate is hureaulite (MnFe)5(PO4)2-(HPO4)24(H2O).
The Raman spectrum of hureaulite is noteworthy for a very intense band at 950 cm-1which is assigned to the HPO42
-PO stretching vibrations. This band has a shoulder at 941 cm-1. This band is given the same assignment, the implication of which is that all the hydrogen phosphate Fig. 2 aRaman spectrum of
kosnarite over the 800 to 1,400 cm-1spectral range
bInfrared spectrum of kosnarite over the 500 to 1,300 cm-1 spectral range
Fig. 3 aRaman spectrum of kosnarite over the 300 to 800 cm-1spectral range bRaman spectrum of kosnarite over the 100 to 300 cm-1
units are not equivalent. A low intensity Raman band is found at 989 cm-1and is assigned to the phosphate PO43
-symmetric stretching vibration.
The series of bands at 1,046, 1,053 and 1,068 cm-1of kosnarite are attributed to the m3 PO43- antisymmetric
stretching vibration. For pegmatitic phosphates, often the spectrum of the PO43- stretching region is complex with
quite a number of phosphate bands which are assigned to the presence of not only PO43-but also HOPO32-units. In
the case of the Raman spectrum of kosnarite and beryllo-nite, the spectrum of the PO43- spectral region is simple,
thus indicating that the phosphate anion symmetry is maintained. It would appear that if the pegmatitic phos-phate contains water or OH groups, then the likelihood of HOPO32- unit formation increases and the complexity of
the phosphate stretching bands increases.
The Raman spectra of kosnarite in the 300 to 800 cm-1 and in the 100 to 300 cm-1region are reported in Fig.3a, b. The series of bands at 561, 595 and 638 cm-1 are assigned to them4out-of-plane bending modes of the PO43
-units. The intense band at 437 cm-1with other bands of lower wavenumber at 387, 405 and 421 cm-1is assigned to the m2 in-plane bending modes of the PO43- units. In
comparison, the Raman spectrum of beryllonite is more complex. A significant number of bands in the Raman spectrum of beryllonite in the 522 to 612 cm-1 are assigned to them4out-of-plane bending modes of the PO43
-units. The lesser number of bands in the Raman spectrum of kosnarite seems to indicate the preservation of the symmetry of the PO43- anion. The Raman spectrum of
kosnarite given in the RRUFF data base seems to show a lack of signal; nevertheless, Raman bands are noted at 523, 593 and 636 cm-1in good agreement with the position of bands reported in this work. Raman bands were observed at 420 and 437 cm-1 in harmony with the position of the Raman bands reported in this work. The Raman peaks at 263, 290 and 318 cm-1 may be associated with metal– oxygen stretching vibrations. The other bands at 122, 156 and 175 cm-1are simply described as lattice vibrations.
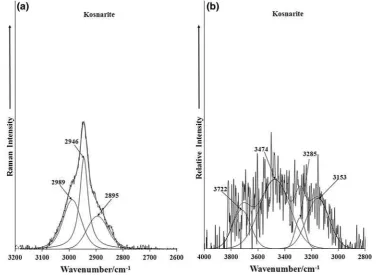
The Raman spectrum of kosnarite in the 2,600 to 3,200 cm-1 spectral range is reported in Fig.4a. These bands are ascribed to an organic impurity on the surface of the kosnarite. The infrared spectrum of kosnarite in the 2,800 to 4,000 cm-1 region is shown in Fig.4b. The spectrum is of a very low intensity and suffers from a lack of signal. Nevertheless, infrared bands are found at 3,153, 3,285, 3,474 and 3,722 cm-1 and may be attributed to water stretching vibrations of adsorbed water.
Conclusions
the Raman spectrum of kosnarite from the RRUFF data base. A comparison is also made with the Raman spectrum of beryllonite. The mineral is characterized by an intense sharp Raman band at 1,026 cm-1, assigned to the PO43-
sym-metric stretching mode. Raman bands at 1,060 and 1,088 cm-1 are attributed to the PO43- antisymmetric
stretching vibrations. The number of bands in the antimetric stretching region supports the concept that the sym-metry of the phosphate anion in the kosnarite structure is preserved. This concept is supported by the number of bands found in the out-of-plane bending region. Multiple bands are also found in the in-plane bending region with Raman bands at 405, 421 and 437 cm-1. Strong Raman bands at 263, 290 and 318 cm-1are attributed to metal oxygen vibrations.
Bands in the Raman spectrum are narrow and well-resolved in comparison with the infrared spectrum where a complex spectral profile may be resolved into component bands. We conclude from this that the pegmatitic phos-phate minerals such as kosnarite are more readily studied by Raman spectroscopy.
Acknowledgments The financial and infra-structure support of the Discipline of Nanotechnology and Molecular Science, Science and Engineering Faculty of the Queensland University of Technology is gratefully acknowledged. The Australian Research Council (ARC) is thanked for funding the instrumentation. The authors would like to acknowledge the Center of Microscopy at the Universidade Federal de Minas Gerais (http://www.microscopia.ufmg.br) for providing the equipment and technical support for experiments involving electron
microscopy. R. Scholz offers thanks to FAPEMIG–Fundac¸a˜o de Amparo a` Pesquisa do estado de Minas Gerais (grant No. CRA–APQ-03998-10).
References
1. Birch WD, Pring A, Bevan DJM (1994) Kharisun. Mineral Mag 58:635–639
2. Birch WD, Pring A, Foord EE (1995) Can Mineral 33:55–58 3. Asabina EA, Pet’kov VI, Rusakov DA, Lazoryak BI,
Kurazh-kovskaya VS (2010) J Solid State Chem 183:1980–1984 4. Pet’kov VI, Shchelokov IA, Kurazhkovskaya VS, Orekhova NV,
Ermilova MM, Tereshchenko GF (2008) Zh Neorg Khim 53:1073–1080
5. Brownfield ME, Foord EE, Sutley SJ, Botinelly T (1993) Am Mineral 78:653–656
6. Kolitsch U (2003) Euro J Mineral 15:1029–1034
7. Sukhanov MV, Pet’kov VI, Firsov DV, Kurazhkovskaya VS, Borovikova EY (2011) Russ J Inorg Chem 56:1351–1357 8. Zaripov AR, Slunchev OM, Shmakova MG, Orlova VA, Galuzin
DD, Rovny SI, Asabina YA, Pet’kov VI (2007) Voprosy Radi-atsionnoi Bezopasnosti: 28–35
9. Tomilin SV, Orlova AI, Lukinykh AN, Lizin AA (2006) Special Publ Royal Soc Chem 305:421–423
10. Orlova AI, Kitaev DB, Kemenov DV, Orlova MP, Kazantsev GN, Samoilov SG, Kurazhkovskaya VS (2003) Radiochemistry (Moscow, Russian Federation) 45: 103–109