Refer to Important disclosures on the last of this report Source: Bloomberg
Positive outlook for nickel
EV battery evolution allows limonite to have economic value.
Despite trade tension, China’s trade surplus to the US expanded.
Nickel deficit is expected to persist further in 2019.
We maintain our positive outlook for nickel and price est. of $13k/t.
Limonite – an overburden which became valuable material. We attended Asian Nickel Conference held by Metal Bulletin on 12-13 September 2018. During the event we found out that limonite ore (which were dumped as overburden by nickel miners) is suitable to be processed as EV battery materials. Limonite seams are located above the saprolite seam (Fig. 1), thus requires lower operational costs. With hydrometallurgy process EV battery material could be produced from limonite which contains lower nickel content but higher cobalt property than saprolite ores (mostly mined and processed for stainless steel applications). The costs for hydrometallurgy process is lower than pyrometallurgy (with heat / furnace) while producers would obtain additional benefit from the cobalt content as limonite ore contains roughly 0.1-0.2% of cobalt. China ENFI Engineering Corporation is currently running a project to process EV battery materials from low-grade lateritic ore (limonite).
China recorded the highest trade surplus to the US. According to Xiao Fu, head of commodity strategy of Bank of China International (BOCI), despite trade tension between the two countries, China’s trade surplus to the US remained high. We note that China posted the highest monthly trade surplus to the US of US$31.05bn in August 2018 (Fig. 2), up from US$28.09bn in July and also higher than the previous record monthly surplus of US$28.9bn posted in June 2018. These bring China trade surplus to the US to increase 14% yoy to US$193bn in 8M18. Some speakers on the Asian Nickel Conference shared the same view that even with the additional 25% import tax imposed by the US, price of imported steel from China (including tax) would remain competitive against US’ domestic steel price.
Nickel deficit to sustain in 2019. Jim Lennon, a senior commodities consultant of Macquarie Capital believes that nickel deficit to persist further in 2019. Nickel price has been supported by stainless steel demand growth which reached around 9% in 1H18. Supply disruptions in New Caledonia and China’s planned pollution global nickel industry last week. However, we are closely following the impact of escalating trade tension to the nickel industry. At this stage we maintain our nickel price forecast of US$13k/t for FY18F (YTD18 avg: $13.7k/t) and $14k/t - $15k/t for FY19F-20F, respectively. Nonetheless, given 33% upside potential to our unchanged TP of Rp4,500 for INCO, we upgrade our rating to Buy (from:
Indonesia Mining
17 September 2018
Sector Update
Overweight
(Unchanged)
Sector Index Performance (JAKMINE)
3M 6M 12M
Absolute (%) (2.9) 3.8 31.8 Relative to JCI (%) (0.2) 11.3 32.5 52w high/low (Rp) 2,189/1,371
Frederick Daniel Tanggela
PT Indo Premier Securities [email protected]
19-Apr 19-Jul 19-Oct 19-Jan 19-Apr 19-Jul
Sector Update - Mining
2 Refer to Important disclosures on the last of this report
Fig. 1 : Tropical Laterite Profile
Source : http://www.scribd.com/doc/77241272/nikel-laterit
Fig. 2 : China posted record trade surplus to the US in Aug’18
Source : Bloomberg
-5 5 15 25 35
(U
S$
b
il
li
o
n
Refer to Important disclosures on the last of this report Stock Data
Target price (Rp) Rp4,500
Prior TP (Rp) Rp4,500
Shareprice (Rp) Rp3,390
Upside/downside (%) +32.7
Sharesoutstanding (m) 9,936 Marketcap. (US$ m) 2,270 Sumitomo Mtl Mining Co. Ltd. 20.1%
PT Indo Premier Securities [email protected] +62 21 5793 1170
A buying opportunity
Potential value add from limonite which currently regarded as an OB.
Nickel matte capacity upgrade to 90k tons pa to continue.
INCO’s share price excessive sell-off is a buying opportunity.
Upgrade rating to Buy (from: Hold) with 33% upside to our TP.
Growth potential from limonite. INCO and Sumitomo are currently reviewing the opportunity to develop processing unit to produce raw material for EV batteries. EV battery evolution with NCM (nickel-cobalt-manganese) and NCA (nickel-cobalt-aluminum) technology on battery cathode will shape nickel industry in the future. Additional nickel demand for EV batteries is expected to reach approximately 1mn tons by 2030. During the last Asian Nickel Conference we found out that low-grade lateritic limonite which in the past was considered as an overburden (OB) is suitable to be processed in to nickel sulfate, a raw material to produce EV battery. Additionally, limonite’s higher cobalt content vs. saprolite ores is beneficial for nickel sulfate producers as cobalt (current price US$61,700 per ton) is also used as raw material in EV battery production.
INCO to continue nickel matte capacity upgrade. INCO is planning to increase production capacity to 90k tons per annum (pa) from current capacity of 80k tons pa. The company expects capex for machinery upgrade and technology optimization to reach US$250mn. Thus, in the next several years nickel matte production could improve further on top of several key projects in INCO’s concession areas in Pomala, Bohodopi and Sorowako. We note that currently INCO and several potential partners are conducting visibility study on three new nickel projects. The company expects details on these new projects will be publicly released by 1H19.
Excessive sell-off is a buying opportunity. We see INCO’s share price excessive sell-off in the past one month as a buying opportunity. LME Nickel price dropped 19% from the peak while INCO’s share price decreased 27% from the peak in Jul’18. Please note that with the recent price correction, nickel price YTD18 average of ~US$13,700 per ton remains higher than our price forecast of US$13,000 per ton for FY18F. Our price forecast for FY18F would remains intact as long as 4Q18 average does not drop to below $11,500 per ton. As nickel price currently stable at around $12,500 per ton, we are comfortable to maintain our price forecast and our earnings estimates for INCO.
Upgrade to Buy with 33% upside. We maintain our nickel price assumption of US$13,000-14,000 per ton for FY18F-19F, respectively. Thus, we maintain our earnings forecast for INCO and our DCF-based (WACC: 12.7%; TG: 3%) target price of Rp4,500. With 33% upside potential to our TP we upgrade INCO rating to a Buy (prev: Hold).
Source: INCO, IndoPremier Share Price Closing as of : 14 September 2018
INCO Company Update
4 Refer to Important disclosures on the last of this report
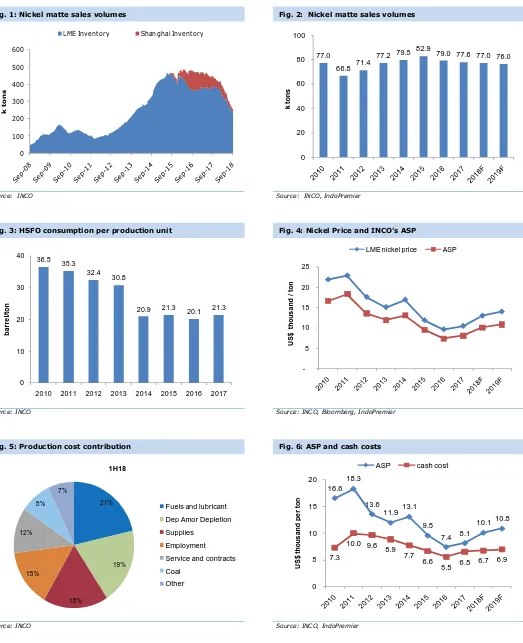
Fig. 1: Nickel matte sales volumes Fig. 2: Nickel matte sales volumes
Source: INCO Source: INCO, IndoPremier
Fig. 3: HSFO consumption per production unit Fig. 4: Nickel Price and INCO’s ASP
Source: INCO Source: INCO, Bloomberg, IndoPremier
Fig. 5: Production cost contribution Fig. 6: ASP and cash costs
Source: INCO Source: INCO, IndoPremier
0
77.2 79.5 82.9 79.0 77.6 77.0 76.0
0
2010 2011 2012 2013 2014 2015 2016 2017
INCO Company Update
5 Refer to Important disclosures on the last of this report
Year To 31 Dec (US$Mn) 2016A 2017A 2018F 2019F 2020F
Income Statement
Net Revenue 584 629 805 889 976 Cost of Sales (550) (623) (658) (690) (733) Gross Profit 34 7 147 199 242 SG&A Expenses (12) (11) (12) (13) (14) Operating Profit 22 (5) 136 186 228 Net Interest (7) (2) (3) (2) (1) Forex Gain (Loss) 3 8 0 0 0 Others-Net (12) (24) (23) (26) (28) Pre-Tax Income 5 (23) 110 158 198 Income Tax (3) 8 (29) (42) (53) Minorities 0 0 0 0 0 Net Income 2 (15) 80 116 145
Balance Sheet
Cash & Equivalent 186 222 345 461 530 Receivable 147 166 80 88 97 Inventory 130 118 106 117 129 Other Current Assets 137 92 227 251 275 Total Current Assets 599 597 759 917 1,031 Fixed Assets - Net 1,533 1,494 1,451 1,421 1,423 Goodwill 0 0 0 0 0 Non Current Assets 94 94 88 97 106 Total Assets 2,225 2,185 2,297 2,435 2,560 ST Loans 36 37 37 37 37 Payable 64 61 0 96 106 Other Payables 31 32 27 30 33 Current Portion of LT Loans 0 0 0 0 0
Total Current Liab. 132 129 151 163 175 Long Term Loans 73 36 36 36 36 Other LT Liab. 186 200 210 220 231 Total Liabilities 391 365 397 419 443 Equity 414 414 414 414 414 Retained Earnings 1,420 1,405 1,486 1,601 1,703 Minority Interest 0 0 0 0 0 Total SHE + Minority Int. 1,835 1,819 1,900 2,016 2,117 Total Liabilities & Equity 2,225 2,185 2,297 2,435 2,560
INCO Company Update
6 Refer to Important disclosures on the last of this report
Year to 31 Dec 2016A 2017A 2018F 2019F 2020F
Cash Flow
Net Income (Excl.Extraordinary&Min.Int) 2 (15) 80 116 145
Depr. & Amortization 123 127 113 110 108 Changes in Working Capital (16) (1) (140) (147) (101) Others (96) 42 145 123 76
Cash Flow From Operating 13 153 199 201 228 Capital Expenditure (70) (75) (70) (80) (110) Others 90 0 0 0 0
Cash Flow From Investing 20 (75) (70) (80) (110) Loans (37) (37) 0 0 0 Equity 0 0 0 0 0 Dividends (0) 0 0 0 (44) Others (6) (5) (5) (5) (6) Cash Flow From Financing (43) (42) (5) (5) (49) Changes in Cash (9) 36 124 116 69
Financial Ratios
Gross Margin (%) 5.8 1.0 18.3 22.3 24.8 Operating Margin (%) 3.8 (0.8) 16.9 20.9 23.4 Pre-Tax Margin (%) 0.9 (3.7) 13.6 17.8 20.3 Net Margin (%) 0.3 (2.4) 10.0 13.0 14.9 ROA (%) 0.1 (0.7) 3.6 4.9 5.8 ROE (%) 0.1 (0.8) 4.3 5.9 7.0 ROIC (%) 0.2 (0.7) 4.3 5.9 7.0 Acct. Receivables TO (days) 70.2 90.5 55.6 34.4 34.5 Acct. Receivables - Other TO (days) 0.0 0.0 0.0 0.0 0.0 Inventory TO (days) 4.7 5.0 5.9 6.2 6.0 Payable TO (days) 49.7 36.7 41.1 48.6 50.3 Acct. Payables - Other TO (days) 0.0 0.0 0.0 0.0 0.0 Debt to Equity (%) 6.0 4.0 3.8 3.6 3.4 Interest Coverage Ratio (x) 0.4 (1.0) 0.0 0.0 0.0 Net Gearing (%) (4.1) (8.2) (14.3) (19.3) (21.6)
Head Office
PT INDO PREMIER SECURITIES
Wisma GKBI 7/F Suite 718 Jl. Jend. Sudirman No.28 Jakarta 10210 - Indonesia p +62.21.5793.1168 f +62.21.5793.1167
INVESTMENT RATINGS
BUY : Expected total return of 10% or more within a 12-month period HOLD : Expected total return between -10% and 10% within a 12-month period SELL : Expected total return of -10% or worse within a 12-month period
ANALYSTS CERTIFICATION.
The views expressed in this research report accurately reflect the analysts personal views about any and all of the subject securities or issuers; and no part of the research analyst's compensation was, is, or will be, directly or indirectly, related to the specific recommendations or views expressed in the report.
DISCLAIMERS