IOP Conference Series: Materials Science and Engineering
PAPER • OPEN ACCESS
Discrimination of several Indonesian specialty
coffees using Fluorescence Spectroscopy
combined with SIMCA method
To cite this article: D Suhandy and M Yulia 2018 IOP Conf. Ser.: Mater. Sci. Eng.334 012059
View the article online for updates and enhancements.
Related content
Excitation–emission matrices and synchronous fluorescence spectroscopy for the diagnosis of gastrointestinal cancers
Ts Genova, E Borisova, N Penkov et al.
-The Classification of Ground Roasted Decaffeinated Coffee Using UV-VIS Spectroscopy and SIMCA Method
M Yulia, A R Asnaning and D Suhandy
-Indonesian palm civet coffee discrimination using UV-visible spectroscopy and several chemometrics methods
M Yulia and D Suhandy
1234567890‘’“”
3rd ICChESA 2017 IOP Publishing
IOP Conf. Series: Materials Science and Engineering 334 (2018) 012059 doi:10.1088/1757-899X/334/1/012059
Discrimination of several Indonesian specialty coffees using
Fluorescence Spectroscopy combined with SIMCA method
D Suhandy1,3 and M Yulia2
1 Department of Agricultural Engineering, Faculty of Agriculture, The University of
Lampung, Jl. Prof. Dr. Soemantri Brojonegoro No.1, Bandar Lampung, 35145, Indonesia
2 Department of Agricultural Technology, Lampung State Polytechnic, Jl. Soekarno
Hatta No. 10, Rajabasa Bandar Lampung, Indonesia
E-mail: [email protected]
Abstract. Indonesia is one of the important producers of several specialty coffees, which have a particularly high economic value, including Civet coffee (‘kopi luwak’ in Indonesian language) and Peaberry coffee (‘kopi lanang’ in Indonesian language). The production of Civet and Peaberry coffee is very limited. In order to provide authentication of Civet and Peaberry coffee and protect consumers from adulteration, a robust and easy method for evaluating ground Civet and Peaberry coffee and detection of its adulteration is needed. In this study, we investigate the use of fluorescence spectroscopy combined with SIMCA (soft independent modelling of class analogies) method to discriminate three Indonesian specialty coffee: ground Peaberry, Civet and Pagar Alam coffee. Total 90 samples were used (30 samples for Civet, Peaberry and Pagar Alam coffee, respectively). All coffee samples were ground using a home-coffee- grinder. Since particle size in coffee powder has a significant influence on the spectra obtained, we sieved all coffee samples through a nest of U. S. standard sieves (mesh number of 40) on a Meinzer II sieve shaker for 10 minutes to obtain a particle size of 420 µm. The experiments were performed at room temperature (around 27-29°C). All samples were extracted with distilled water and then filtered. For each samples, 3 mL of extracted sample then was pipetted into 10 mm cuvettes for spectral data acquisition. The EEM (excitation-emission matrix) spectral data of coffee samples were acquired using JASCO FP-8300 Fluorescence Spectrometer. The principal component analysis (PCA) result shows that it is possible to discriminate types of coffee based on information from EEM (excitation-emission matrix) spectral data. Using SIMCA method, the discrimination model of Indonesian specialty coffee was successfully developed and resulted in high performance of discrimination with 100% of sensitivity and specificity for Peaberry, Civet and Pagar Alam coffee. This research has opened the possibility to develop a promising method to detect and evaluate authentication of Indonesian specialty coffees using fluorescence spectroscopy.
1.Introduction
Indonesia is well known as one of the main exporting coffee country especially for robusta type with average production is around 540 million kg in 2014 [1]. Indonesia is also rich with some specialty
3
2
1234567890‘’“”
3rd ICChESA 2017 IOP Publishing
IOP Conf. Series: Materials Science and Engineering 334 (2018) 012059 doi:10.1088/1757-899X/334/1/012059
coffee with unique taste and high price. Some specialty coffee is associated with specific origin of coffee plantation like Gayo coffee in Aceh (arabica), Pagar Alam coffee in South Sumatera (robusta) and others. Some specialty coffee is very delicious and very limited production due to special fermentation like Civet coffee. Peaberry coffee is also one of the specialty coffee in Indonesia with very limited production and unique taste.
Food authentication is the process that verifies that a food is in compliance with its label description [2]. The declaration of specific quality attributes in high-value products is of particular interest since these products are often target of fraudulent labeling. Proof of provenance is an important topic for food safety, food quality and consumer protection, as well as the compliance with national legislation, international standards, and guidelines [3]. In coffee trading, authentication is becoming important issue. Specialty coffee is limited in production, with unique taste and high price compare to normal coffee. Unfair trading is usually happen by mixing normal coffee with some specialty coffee. In this step, the discrimination between authentic specialty coffee and mixed or fake specialty coffees is highly required. The discrimination and authentication process is becoming very difficult and highly complex in roasted and ground coffee considering that after roasting and grinding, the addition of others materials cannot be detected visually [4].
The use of several conventional methods to identify the adulteration of roasted and ground coffee have been reported including the use of optical and electron microscopy [4]. Recently, other techniques have been studied in order to provide new analysis method that are more reliable, reproducible, and able to identify the many different types of possible adulteration include chromatographic analysis and infrared spectroscopy. Several spectroscopic based method include NIR spectroscopy and mid infrared have been reported for successful application in adulteration detection in coffee [5], [6], [7]. The use of spectroscopic method for authentication in coffee is also frequently combined with the power of pattern recognition methods such as soft independent modeling of class analogy (SIMCA), partial least square discriminant analysis (PLS-DA), back propagation neural network (BPNN) and least squares-support vector machine (LS-SVM) [8]. Recently, ultraviolet-visible (UV-Vis) spectroscopy also has been used for promising application of authentication in ground coffee [9]. Suhandy et al. [10] used UV-vis spectroscopy combined with SIMCA for authentication of Civet coffee. The discrimination between Peaberry and normal coffee was studied and successfully separated using UV-vis spectroscopy combined with SIMCA and PLS-DA [11].
Fluorescence spectroscopy has been extensively used for the classification of food [12]. The advantages of fluorescence spectroscopy as analytical method are fast, selective, and sensitive. However, the report for application of fluorescence spectroscopy for coffee discrimination is very limited. Fluorescence spectroscopy was recently reported has been used as tool for the geographical discrimination of coffees in Brazil [13]. As far as the authors are aware, no record has been found in the literature on the discrimination of Indonesian specialty coffee using fluorescence spectroscopy techniques. In this study, the feasibility of the technique in discrimination of Indonesian specialty coffee was evaluated, and models were established using SIMCA.
2.Methodology/ Experimental
2.1. Coffee samples
1234567890‘’“”
3rd ICChESA 2017 IOP Publishing
IOP Conf. Series: Materials Science and Engineering 334 (2018) 012059 doi:10.1088/1757-899X/334/1/012059
2.2. Fluorescence spectral data acquisition
All the EEM (excitation-emission matrix) spectral data of coffee samples were acquired using a spectrofluorometer (JASCO model FP-8300, Tokyo, Japan) in the excitation range from 200 nm to 500 nm (5 nm steps) and the emission range from 210 nm to 750 nm (1 nm steps). The excitation and emission bandwidth were both 5.0 nm. The software of Spectra Manager (JASCO Co., Tokyo, Japan) was used to control EEM spectral data acquisition. This software was also used for spectral data pre-treatment such as fluorescence correction and finding peak for high intensity of EEM spectral data.
2.3. Data analysis
First, the fluorescence spectra were analysed using principal component analysis (PCA) [15]. In PCA, the main systematic variation in data was extracted by breaking down the information into principal components (PCs) based on equation (1).
(1)
The emission or fluorescence spectra data are contained in a matrix, X, and decomposed into a score matrix, T, and a loading matrix, P. The scores contain information about the amount of each PC in every sample and the loadings hold information about the contribution of the variables to each PC. The residuals, which are the variations that are not described by the scores and loadings, are collected in a residual matrix, E.
SIMCA is a supervised pattern recognition technique in which an individual PCA sub-model is created for each class and its boundary is calculated. The established PCA sub-models are then used to assess to which classes the new samples belong. Moreover, the results of SIMCA analysis allow us to evaluate the discrimination power of the individual wavelength variables. In SIMCA, the samples were separated into two groups: training and prediction sample set. Training sample set consist of 20 samples for each type of coffee and was used to develop SIMCA calibration model for each type of coffee. Prediction sample set consist of 10 samples for each type of coffee and was used to perform prediction step. To evaluate the result of SIMCA discrimination in prediction step, two parameters were used: sensitivity (samples belonging to the class and classified correctly in this class) and specificity (samples not belonging to the modeled class and correctly classified as not belonging) [16].
PCA and SIMCA analysis were performed with a statistical software package of ‘The Unscrambler’
V9.7 (CAMO AS, Trondheim, Norway). SIMCA was calculated at 10% of significance level in the F test.
3.Results and Discussion
3.1.Excitation and fluorescence spectra of coffee samples
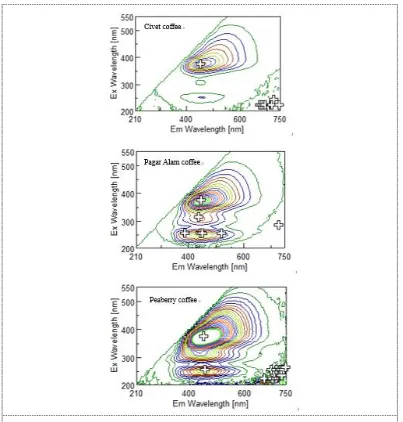
Figure 1 shows the EEM spectra of Peaberry, Pagar Alam and Civet coffee with emission spectra in horizontal axis and excitation spectra in vertical axis. It can be seen that there is no data recorded in the area that wavelength of excitation is higher than that of emission. Using peak finder option in Spectra Manager (JASCO Co., Tokyo, Japan) software, we can identify several peaks with high intensity of emission or fluorescence spectra. Based on Figure 1, it can be inferred that the peak at excitation wavelength of 370 nm resulted in high intensity of fluorescence at 453 nm.
4
1234567890‘’“”
3rd ICChESA 2017 IOP Publishing
IOP Conf. Series: Materials Science and Engineering 334 (2018) 012059 doi:10.1088/1757-899X/334/1/012059
Figure 1. The contour of excitation emission spectra of three types of coffee samples.
1234567890‘’“”
3rd ICChESA 2017 IOP Publishing
IOP Conf. Series: Materials Science and Engineering 334 (2018) 012059 doi:10.1088/1757-899X/334/1/012059
3.2.Principal component analysis
In order to evaluate the discriminating ability of fluorescence spectra regarding the type of coffee (Peaberry, Pagar Alam and Civet), a principal component analysis was performed. Figure 3 shows the score plots (PC1×PC2) resulting from the application of PCA to the raw spectra. Figure 3 shows a clear of separation between Peaberry, Pagar Alam and Civet coffee using the raw spectra. Thus, it can be verified that the data pre-processing of obtained fluorescence spectra is not necessary.
Figure 3. PC1×PC2 score plots for the 90 studied coffee samples using the raw spectra. Peaberry coffee (green), Pagar Alam coffee (red circle), Civet coffee (blue square). The explained variance in each PC is indicated in parentheses.
3.3.Soft independent modelling of class analogy (SIMCA)
SIMCA, a superior pattern recognition method, applied in fluorescence spectroscopy to develop classification models. SIMCA describes each class separately in a PC space. When building SIMCA model, the three classification models (Peaberry, Pagar Alam and Civet) were developed by PCA method, respectively. The samples of the calibration and prediction sets were used to calibrate SIMCA model and evaluate its performance. The determination of the appropriate number of PCs is a critical step for developing SIMCA model. The number of PCs was determined by the full-cross validation method. In our case, two PCs were used for Civet coffee, Pagar Alam and Peaberry coffee, respectively.
Table 1. Discrimination results between Peaberry, Pagar Alam and Civet samples in training and prediction samples using the soft independent modeling of class analogy (SIMCA) method using original fluorescence spectra at 370 nm of excitation wavelength.
Types of
6
1234567890‘’“”
3rd ICChESA 2017 IOP Publishing
IOP Conf. Series: Materials Science and Engineering 334 (2018) 012059 doi:10.1088/1757-899X/334/1/012059
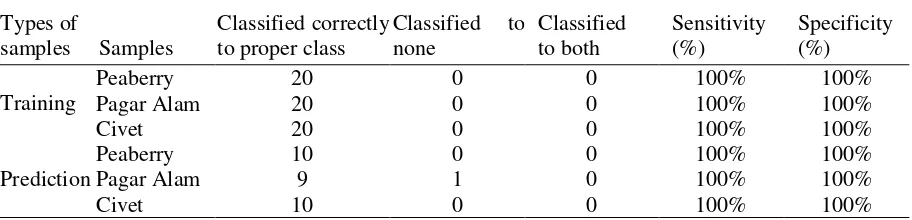
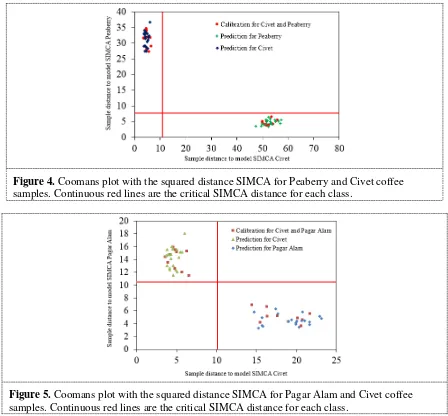
where the Coomans plots of the SIMCA models used are shown. It can be seen that none of the models built admitted samples from the other category, and thus the specificity is 100% in all cases. The sensitivity of the three models is also 100% for all coffee samples.
Figure 4. Coomans plot with the squared distance SIMCA for Peaberry and Civet coffee samples. Continuous red lines are the critical SIMCA distance for each class.
Figure 5. Coomans plot with the squared distance SIMCA for Pagar Alam and Civet coffee samples. Continuous red lines are the critical SIMCA distance for each class.
4.Conclusion
In this study, the discrimination of Indonesian specialty coffee using fluorescence spectroscopy and SIMCA method has been successfully conducted. Analysis of excitation emission spectral data showed that the peak of fluorescence spectra was located at 453 nm, which is based on previous report, may be related to the typical emission spectra of flavonoid content in coffee. The PCA on fluorescence spectral data at 370 nm of excitation wavelength resulted in a clear separation between the three types of Indonesian specialty coffees. Classification using SIMCA method showed a high degree of sensitivity and specificity. This result has shown a great potential of using fluorescence spectroscopy and SIMCA for accurate discrimination of Indonesian specialty coffees.
Acknowledgement
1234567890‘’“”
3rd ICChESA 2017 IOP Publishing
IOP Conf. Series: Materials Science and Engineering 334 (2018) 012059 doi:10.1088/1757-899X/334/1/012059
Research Program). Some part of this research is also funded by Kemenristekdikti Indonesia (Hibah Strategis Nasional/STRANAS 2016–2017 No. 585/UN26.21/KU/2017).
References
[1] ICO 2014 World coffee trade 1963–2013 http://www.ico.org
[2] Danezis G P, Tsagkaris A P, Camin F, Brusic V and Georgiou C A 2016 Trends Analyt. Chem.
85 123–32.
[3] Aung M M and Chang Y S 2014 Food Control. 39 172–84.
[4] Toci A T, Farah A, Pezza H R and Pezza L 2016, Crit. Rev. Anal. Chem. 46 83–92. [5] Pizarro C, Esteban-Diez I and Gonzalez-Saiz J M 2007 Anal. Chim. Acta. 585 266–76.
[6] Tavares K M, Pereira R G F A, Nunes C A, Pinheiro A C M, Rodarte M P and Guerreiro M C 2012 Quim. Nova. 35 1164–68.
[7] Reis N, Franca A S and Oliveira L S 2013 LWT - Food Sci. Technol. 50 715–22. [8] Li X, Yi S, He S, Lv Q, Xie R, Zhen Y and Deng L 2016 Precis. Agric. 17 365–74.
[9] Souto U T C P, Barbosa M F, Dantas H V, Pontes A S, Lyra W S, Diniz P H G D, Araújo M C U and Silva E C 2015 LWT - Food Sci. Technol. 63 1037–41.
[10] Suhandy D, Yulia M, Waluyo S, Sugianti C, Iriani R, Handayani F N and Apratiwi N 2016 Proc. of the USR International Seminar on Food Security (Bandar Lampung: Universitas Lampung) pp 245–53.
[11] Suhandy D and Yulia M 2017 Int. J. Food Prop. In press. [12] Sádecká J and Tóthová J 2007 Czech J. Food Sci. 25 159–73.
[13] Botelho B G, Oliveira L S and Franca A S 2017 Food Control. 77 25–31.
[14] Yulia M, Suhandy D, Waluyo S and Sugianti C 2016 Proc. of the USR International Seminar on Food Security (Bandar Lampung: Universitas Lampung) pp 254–61.