Vol.x, No.x, September 201x, pp. xx~xx
ISSN: 2088-8708 31
Modeling and Simulation of Fuzzy Logic Based Maximum
Power Point Tracking (MPPT) for PV Application
Departement of Electrical Engineering, University of Lampung, Bandar Lampung, Indonesia
Article Info ABSTRACT tracking (MPPT) used in solar PV power systems. The Fuzzy logic algorithm is used to minimize the error between the actual power and the estimated maximum power. The simulation model was developed and tested to investigate the effectiveness of the proposed MPPT controller. MATLAB Simulink was employed for simulation studies. The proposed system was simulated and tested successfully on a photovoltaic solar panel model. The Fuzzy logic algorithm succesfully tracking the MPPs and performs precise control under rapidly changing atmospheric conditions. Simulation results indicate the feasibility and improved functionality of the system.
Keyword:
Maximum power point tracking Fuzzy logic algorithm
Photovoltaic Simulink
MPPT Copyright © 201x Institute of Advanced Engineering and Science.
All rights reserved.
Corresponding Author:
Ahmad Saudi Samosir,
Departement of Electrical Engineering, University of Lampung,
No.1, Jln. Prof. Soemantri Brojonegoro, Bandar Lampung, 35152, Indonesia Email: [email protected]
1. INTRODUCTION
The growing energy demand of the world and the tremendous risk of climate change associated with the use of fossil fuels have driven research and development of alternative energy sources that are clean, efficient, renewable and environmentally friendly. Among all renewable energy sources, solar power systems attract more attention because they have several advantages such as pollution-free, low maintenance costs and low operating costs. Their sources of energy, which is derived from solar energy, are also widely available and it is free [1-4].
In solar power system, the solar energy is directly converted into electrical energy by solar PV module. The main components of solar PV systems are solar cells made from semiconductor materials that have a photovoltaic effect, which serves to convert solar energy into direct current electricity. When exposed to sunlight; the solar panels will generate the direct current electricity, which is ready to supply power to the load.
Solar Panels do not need much maintenance and have no moving parts. The unfavorable issue with solar PV systems is the high installing cost and the variation of energy form the solar panel with environmental conditions. In order to attain the maximum efficiency from the solar panel, it is important to obtain the maximum available power at any operating condition. Also, the power distribution across the system has to be managed. Storage devices are used so that the energy is stored or supplied according to the availability of sufficient power and the load requirements [5].
The efficiency of solar cells depends on many factors such as temperature, irradiance, spectral characteristics of sunlight, dirt, shadow, and so on. Changes in insolation on panels due to fast climatic changes such as cloudy weather and increase in ambient temperature can reduce the photovoltaic (PV) array
output power. In other words, each PV cell produces energy pertaining to its operational and environmental conditions [6].
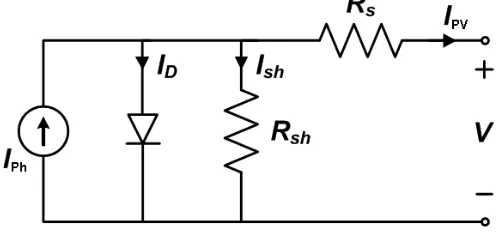
Figure 1. Solar Cell Equivalent Circuit
In addressing the poor efficiency of PV systems, some methods were proposed, among which is a new concept called “maximum power point tracking” (MPPT). All MPPT methods follow the same goal which is maximizing the PV array output power by tracking the maximum power on every operating condition.
2. SOLAR PHOTOVOLTAIC MODEL
The mathematical model of the PV cell can be developed by using equivalent circuit of PV Cell. The most common of PV cell model is the single diode circuit model that represents the electrical behavior of the pn-junction [4],[7-8]. Figure 1 shows the single diode equivalent circuit model of Solar cell.
From the single diode equivalent circuit in Figure 1, the equation for the output current is given by:
pv ph D sh
I
=
I
−
I
−
I
(1)The current through the diode follow the Shockley diode equation:
D O the reverse saturation current, n is diode ideality factor, q is the electron charge, k is the Boltzmann constant, T is the absolute temperature, VD is the voltage across diode and resistor Rsh, Vpv is the output terminal voltage, and RS is the series resistance of the PV cells.
By substituting equation (2), (3) and (4) into the first equation, the characteristic equation of a PV cell, which relates solar cell parameters to the output current and voltage, is given by the following temperature. As the references, the PV module manufacturers normally provided specified data at Standard Test Conditions where the irradiance is 1000W/m2 and the cell temperature is 25OC [7-8].
characteristic of the ICA100 module under different irradiance and Figure 3 illustrates the P-V characteristic under different temperature conditions.
Figure 2. P-V characteristics at irradiance variation
Figure 3. P-V characteristics at temperature variation
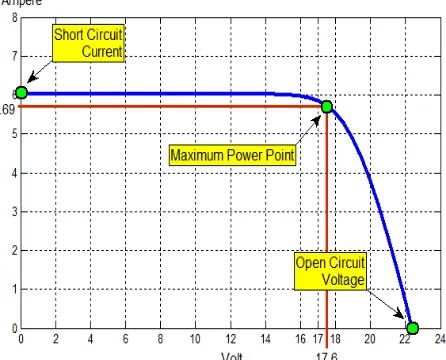
Figure 4 shows the current-vs-voltage curve of the PV module. It gives an idea about the significant points on each I–V curve: open-circuit voltage, short-circuit current, and the operating point where the module performs the maximum power (MPP). This point is related to a voltage and a current that are Vmpp and Impp, respectively, and is highly dependent on solar irradiation and ambient temperature [7].
Table 1. Specification of ICA100 PV Module Parameters Symbol Value Maximum power Pmax 100 W Voltage at max power Vmp 17.6 V Current at max power Imp 5.69 A Open circuit voltage Voc 22.4 V Short circuit current Isc 6.03 A Number of Series Cells Ns 36 Number of Parallel Cells Np 1
3. MAXIMUM POWER POINT TRACKING (MPPT)
The Maximum Power Point Tracking (MPPT) is an algorithm that included in charge controllers used for extracting maximum available power from PV module under certain conditions. The MPPT algorithm moves the electrical operating point of the PV modules to its Maximum Power Point, so that the modules are able to deliver maximum available power.
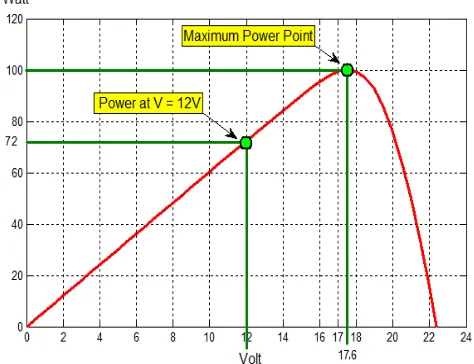
The voltage at which PV module can produce maximum power point is called maximum power voltage (or peak power voltage). The Maximum Power Point of PV module varies with solar radiation, ambient temperature and solar cell temperature. From Power – vs – Voltage curve in Figure 5, the ICA100 PV module produces power with maximum power voltage of around 17.6 V when measured at a cell temperature of 25°C, it can drop to around 16 V on a very hot day and it can also rise to 19 V on a very cold day.
Figure 5. Power – vs – Voltage curve of PV module
When a load is directly connected to the PV panel, the PV panel operating point is usually not at peak power. In Figure 5, it is clear when a 12V dc load is directly connected to the PV panel, the PV output power is only 72W, which is less then the maximum available power of PV module.
solar panel circuit to the load circuit. Changing the duty ratio of the DC-DC converter results in the impedance seen by the panel being changed. In order to maximize the extraction power of solar photovoltaic systems, the DC-DC converter must be able to track a particular duty ratio that make the operating point will be at the maximum power point (MPP).
There are a large number of algorithms that are able to track the MPPs. Some of them are simple, such as voltage and current feedback control base, while some are more complicated, such as hill cimbing method, Perturbation and Observation (P&O) method and Incremental Conductance method. They vary in complexity, sensor requirement, speed of convergence, cost, range of operation, popularity, ability to detect multiple local maxima, and their applications [9-11].
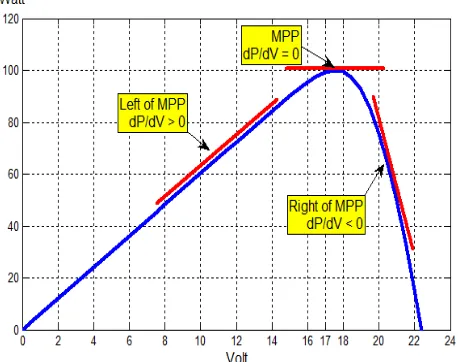
Figure 6. Basic idea of the MPPT method
Most of MPPT method focuses directly on power variations and the slope of the P–V characteristic curve. In Figure 6, we can see that the MPP is located at the peak of the Power – vs – Voltage curve of PV module. Here the value of PV power is maximum. Figure 6 shows that the slope of the PV array power curve, dP/dV, is zero at the MPP, positive on the left of the MPP and negative on the right-hand side of the MPP. The basic equations of this method are as follows :
=0
dP
dV
, at MPP (6)>0
dP
dV
, left of MPP (7)<0
dP
dV
, right of MPP (8)where P and Vare the PV array output power and voltage, respectively.
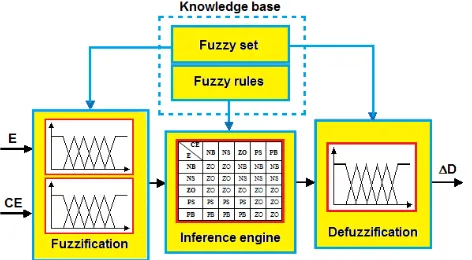
4. MPPT FUZZY LOGIC CONTROLLER
Figure 7. Structure of fuzzy logic controller
4.1. Fuzzification
During fuzzification, numerical input variables are converted into linguistic variable based on a membership function. For this MPPT, the actual voltage and current of PV module measured continuously and the power can be calculated as P=VxI. The control is determined based on satisfaction of two proposed input control variable, namely the error E (which represents the slope of P-V characteristic) and change of error CE at the instant sampling k. The variable E and CE are exprexed as follows:
( )
(
1)
DC-DC Converter is used as the output of the controller. Therefore, the control is done by changing this duty ratio according to the slope E(k) in order to track the operation point to the optimal point where the slope is zero.As shown in Figure 7, the input variables of the fuzzy controller (E, CE) are converted to the liguistic variables such as PB (positive big), PS (positive small), ZO (zero), NS (negative small), and NB (negative big) using basic fuzzy subset. Figure 8 shows the membership grades of five basic fuzzy subsets for input and output variables.
4.2. Inference Engine
The inference engine applies a rule to the fuzzy input to determine the fuzzy output. Therefore, before the rule can be evaluated, the real input value must be fuzzified to obtain an appropriate linguistic value. Table 2 shows the fuzzy controller rule table, where all the matrix entries are fuzzy sets of the error (E), the change of error (CE) and the change of duty ratio (∆D) to converter.
The rule table in table 2 containt 25 rules of fuzzy controller. These rules are employed to control the DC-DC converter so that the MPP of the PV module is reached.
The main idea of the rules are to bring the operation point of PV module to the MPP by increasing or decreasing the duty ratio of DC-DC Converter depending on the position of the operation point from the MPP.
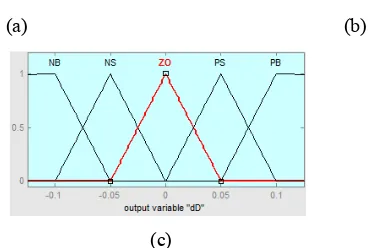
(a) (b)
(c)
Figure 8. Membership function for (a) Input E, (b) Input CE, (c) Output ∆D
4.3. Defuzzification
Since the DC-DC converter require a precise control signal D at its entry, it is necessary to tranform the output of fuzzy controller from fuzzy information into deterministic information. This tranformation is called defuzzification. In the defuzzification stage, the fuzzy logic controller output is converted from a linguistic variable to a numerical variable.
Defuzzification can be performed normally by two algorithms; Center of Area (COA) and the Max Criterion Method (MCM). The most widely used defuzzification method is the determination of the center of gravity (COA) of the final combined fuzzy set.
The final combined fuzzy set is defined by the unification of all outputs of the fuzzy rule set, using the maximum aggregation method. The center of gravity (∆D) is computed by,
1
and the actual duty ratio D is calculated by:
( )
(
1)
D( )
D k
=
D k
− +
S
∆i
∆
D k
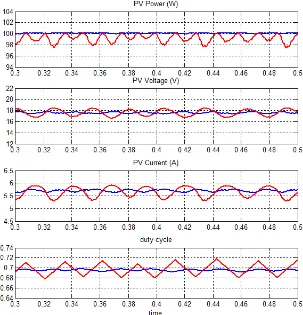
(12)5. RESULT AND ANALYSIS
In order to evaluate the performance of the proposed Fuzzy Logic based MPPT controller, a simulation analysis was conducted. The simulation model was developed using MATLAB Simulink. The simulink model of PV system is shown as Figure 9. The PV module considered in the simulation is the
Figure 9. Simulink model of PV system
Figure 10. Block diagram of fuzzy MPPT algorithm
ACKNOWLEDGEMENTS
The authors would like to thanks the Directorate General of Higher Education Indonesia (DIKTI) for the financial support via PUPT Research Grant, and Lampung University for providing the facilities to conduct the research.
REFERENCES
[1] Azadeh Safari and Saad Mekhilef, “Simulation and HardwareImplementation of Incremental Conductance MPPT With Direct Control Method Using Cuk Converter”, IEEE Transactions On Industrial Electronics, Vol. 58, No. 4, April 2011.
[2] M. Abdulkadir, A.S. Samosir and A.H.M. Yatim, “Modelling and simulation of maximum power point tracking of photovoltaic system in Simulink model”, PECon 2012 - IEEE International Conference on Power and Energy, 2012.
[3] M. Abdulkadir, A.S. Samosir and A.H.M. Yatim, “Modeling and Simulation of a Solar Photovoltaic System, Its Dynamics and Transient Characteristics in LABVIEW”, ARPN Journal of Engineering and Applied Sciences. Vol. 3, No.2, Jun 2013.
[4] A. S. Samosir, A. Trisanto, A. Sadnowo, "Development of dynamic evolution control for pv inverter in solar power plant application”, ARPN Journal of Engineering and Applied Sciences, Vol. 12, No.12, Jun 2017.
[5] Z. Almukhtar, A. Merabet, “Fuzzy MPPT Control and Power Regulation for Standalone Photovoltaic Energy Conversion System”, International Journal of Advanced Engineering Research and Applications (IJA-ERA), Vol. 2, No. 7, Nov 2016.
[6] F. Liu, S. Duan, F. Liu, B. Liu, and Y. Kang, “A variable step size INC MPPT method for PV systems,” IEEE Trans. I nd. Electron., vol. 55, no. 7, pp. 2622–2628, Jul. 2008.
[7] Pandiarajan, N, Ranganath Muthu. “Mathematical Modeling of Photovoltaic Module with Simulink”. International Conference on Electrical Energy System, ICESS 2011.
[8] H. Gusmedi, E. Komalasari, “DocumentFeasibility and optimal design of micro-hydro and photovoltaic hybrid system in support to energy independent village”, Proceedings - ICPERE 2014: 2nd IEEE Conference on Power Engineering and Renewable Energy, 2014.
[9] T. Esram and P. L. C hapman, “Comparison of photovoltaic array maximum power point tracking techniques,” IEEE Trans. Energy Conversion, vo l. 22, no. 2, pp. 439–449, Jun. 2007.
[10] V. Salas, E. Olias, A. B arrado, and A. Lazaro, “Review of the maximum power point tracking algorithms for stand-alone photovoltaic systems,” Solar Energy Materials and Solar Cells, vol. 90, no. 11, pp. 1555–1578, Jul. 2006