1
SOCIAL AND ECONOMIC IMPACTS
OF THE SIDOARJO MUDFLOW:
COMMUNITY RESETTLEMENT AFTER DISASTER
Prasojo Bayu Suwondo Putro
Contents: Abstract
1. Introduction
2. Sidoarjo Mudflow Disaster Impacts 2.1. The Disaster Area at a Glance
2.2. Geological and Environmental Impacts 2.3. Economic Impacts
2.4. Disaster Response and Compensation Scheme 3. Evidence on the Resettlement Process
3.1. Overview
3.2. Resettlement Behavior and Economic Loss 4. Empirical Study
4.1. Analytical Framework 4.2. Preference for a New Area
4.3. Household Income after Resettlement
4.4. Change in Household Income after Resettlement 5. Conclusion
2
Social and Economic Impacts of the Sidoarjo Mudflow:
Community Resettlement after Disaster
Prasojo Bayu Suwondo Putro Graduate School of Agricultural Science
Tohoku University of Japan
Abstract
On May 29, 2006, a large-scale mudflow eruption was caused by a technical error during an oil exploration in the Sidoarjo District of the East Java province of Indonesia. The mudflow spread widely, encompassing 12 villages and forcing around 40,000 people to relocate. The mudflow is still spreading, and will continue to do so for the next 30 years. We must learn more from the relocation programs that were implemented in order to design better models for future displacement actions.
This paper presents the critical socio-economic impact on the displaced victims affected by the Sidoarjo mudflow disaster. In March 2012, a survey was conducted to understand the villagers’ decision-making process on where to be resettled and the change in household income after resettlement. We randomly selected 104 households who had lived in Renokenongo, a village that was entirely covered by mud. These households were displaced to three different resettlement areas. This study identified the three eviction patterns by job: 1) workers tended to choose locations near the city center; 2) farmers preferred to move as a group, maintaining their social network with other community members; and 3) traders, self-employed workers, and others lost their jobs and were forced to live in severe hardship because of the relocation.
3 was that Lapindo did not install one of the pipes necessary for exploration because of its high price and was attempting to lower production costs (Hartono, 2006 in Turtiningtyas, 2009: 2)).
This was the first time in the world that a mudflow has been observed from the beginning of its explosion. It has been noted that mudflows have occurred in other parts of the world, such as Lokbatan (Azerbaijan) in 2001, Koturdag (Azerbaijan) in 1950–present, and Piparo (Trinidad-Tobago) in 2001 (BPK-RI, 2007: 3). China has experienced mud volcanoes in Xinjiang province; there are mud volcanoes at the Arakan Coast in Myanmar; South Taiwan has two active mud volcanoes in South Taiwan and several inactive ones (Richards, 2011: 9).
The Sidoarjo Mudflow has had an impact on the surrounding areas: it is releasing approximately 100,000 cubic meters of mud per day, thus far inundating a 641-hectare area that includes 12 villages. Moreover, with the inevitable impact on infrastructure, social and economic issues have emerged, including the relocation of approximately 14,000 households (approximately 40,000 people) and the closing of factories leading to the laying off of labor. Thus, it is evident that the Sidoarjo area has experienced economic loss (BPLS, 2010: 3-6).
4
include alterations of behavior patterns, social relationships, institutions, and social structure (Turtiningtyas, 2009: 1). In order to handle these social problems, with government approval, Lapindo Brantas Inc. gradually bought the communities’ proofed land (Presidential Regulation 14/2007).
With regard to the long-term effects of the mudflow disaster, scientists have estimated that in the near future, the affected area will become wider and the permanent resettlement of communities will become necessary as well. Hence, we must learn lessons from past resettlement behaviors and microeconomic evidence in order to design a good relocation model.
Previous studies have adopted three types of approaches to relocation issues. First, some researchers have studied the impact of the resettlement by studying the experience of the relocated households (Hori and Schafer, 2009; Ali Badri et al., 2006). Hori and Schafer’s study, conducted on temporary settled households after hurricanes in the US, considered different characteristics from the Sidoarjo mudflow’s permanent resettlement. Further, Ali Badri et al.’s study, undertaken 11 years after Iran’s earthquake disaster (a substantial period), could make data from households inaccurate.
The second approach to relocation issues has focused on the policy process, particularly on the planning process. Turtiningtyas (2011) studied housing resettlement preferences and recommended that the government include a resettlement scheme in the spatial plan. Furthermore, Achmad (2011) emphasized cultural planning as the solution to mudflow disaster displacement and recovery. However, these studies did not include the original data or data on households’ behavior.
The third approach focused on impact evaluation, including macroeconomic and environment impacts (McMichael, 2009; BPK-RI, 2007). However, in order to derive policy implications on resettlement after disaster, we still need to clarify the detailed evidence on
5
households’ resettlement behavior and the microeconomic impact suffered by the surrounding community.
In order to fill the gaps stated above, the aim of this study is to show how households determined where to relocate and to provide evidence on how household income has changed after the Sidoarjo mudflow. Based on the analysis, we derive some implications on designing a post-disaster relocation policy.
This paper is organized in the following manner. An overview of the impacts of the Sidoarjo mudflow is provided in the second section. Data on resettlement behavior and economic loss are summarized in the third section. Analytical frameworks on the empirical study and estimation results are discussed in the fourth section. Finally, a summary and conclusions are provided in the fifth section.
2.
Impact of the Sidoarjo Mudflow Disaster
2.1.
The Disaster Area at a Glance
The cause of the Sidoarjo mudflow disaster remains controversial among researchers. Their views can be categorized into two types. According to the first, the Sidoarjo mudflow is considered a manmade disaster. Davies (2007) concluded that the eruption of hot mud was triggered by drilling activity. According to the second view, it is considered a natural disaster. BPLS (2010) stated that the Yogyakarta earthquake on May 27, 2006 (two days before the first appearance of the Sidoarjo mudflow) triggered the Sidoarjo mudflow. The mudflow was also declared a natural disaster at the Sidoarjo Mud Volcano International Workshop on February 20–21, 2007.
6
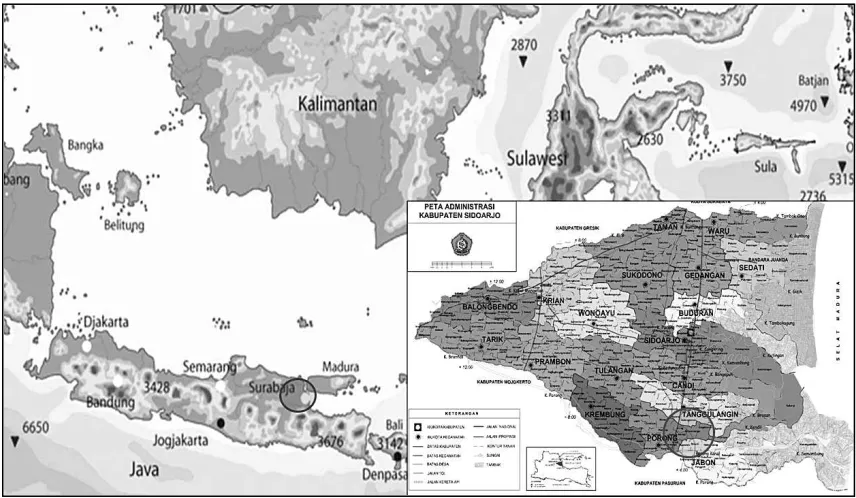
Renokenongo, one of the affected villages2, has been totally covered by the mudflow, while other villages are only partially affected. In order to understand the villagers’ resettlement process, we focus on the relocation that occurred in Renokenongo in the following sections. Before it was inundated, Renokenongo’s 195.40-hectare area was occupied by 6,437 persons from 1,808 households. An interview with an NGO revealed that two resettlement areas were chosen by the communities: the Kahuripan Nirvana Village (KNV) and the Renojoyo area. The KNV housing estate, established by Lapindo Brantas Inc., is located close to the center of Sidoarjo regency. The aim of this establishment is to provide a place to live for people from devastated villages and to allow them to remain close to the center of the city. However, approximately 400 households from Renokenongo village decided to build a new village in Kedungsolok, on land that at the time was used for sugarcane cultivation. They named that location Renojoyo. Hence, people from Renokenongo village were distributed more widely than those from other villages, which means that we can conduct research to measure the different impacts of the Sidoarjo mudflow on KNV and Renojoyo. The details of the locations are depicted on the map below:
2
7
Figure 1. Map of the Sidoarjo Mudflow Area
2.2.
Geological and Environmental Impacts
The Sidoarjo mudflow is a new type of disaster, one that involves both man-made activity and natural phenomena. The duration of this disaster is estimated to be 23–35 years, much longer than other types of disaster—earthquakes last seconds; tornadoes, minutes; tsunamis, hours; floods, days or weeks (BPLS, 2010: 6).
8
This would disrupt 1,500 hectares of traditional shrimp aquaculture in the area (BPK-RI, 2007: 238-239).
Mudflow eruptions are associated with the release of bubbles and toxic gas. Some bubbles comprising a mixture of gases and water have been found in residential areas. Some of these reached 15 meters in height (BPLS, 2010: 14). Moreover, toxic gases, such as hydrogen sulphide (H2S), have been released from the mudflow’s epicenter. The Ministry of Environment in Indonesia stated that on the first day of eruption, H2S levels reached 700 parts per million (ppm), which can be deadly to humans (UN-UNDAC, 2006).
The Research and Development Agency of the Ministry of Public Works stated that fresh water quality surrounding the mudflow area is unsuitable for consumption; for example, the turbidity level reached 47-169 NTU, where 25 NTU is the maximum for safe consumption3 (BPK-RI, 2007).
2.3.
Economic Impacts
The Sidoarjo mudflow has also had an impact on the economic infrastructure and assets of Sidoarjo Regency and East Java. The following assets were inundated:
- Land and houses of the community - Paddy, sugarcane, and other potency crops - Plants’ buildings and equipment
- Utilities, such as toll roads, electricity lines, irrigation lines, fresh water pipelines, telecommunication lines, and gas pipelines
In addition to the loss of assets, the mudflow has also caused loss of economic revenue to the surrounding area. The estimated total economic cost for 2006–2015 is ¥328,959,700,000 (1 ¥ = 100 IDR). Details are given Table 1.
3
9 Table 1. Economic costs
No. Cost component Loss (¥) %
1 Direct economic cost 198,903,700,000 60.46 2 Indirect economic cost 74,064,400,000 22.51 3 Relocation economic cost 55,991,600,000 17.02 328,959,700,000 100.00 Source: BPK-RI, 2007
BPK-RI (2007) stated three issues in its audit report on the mudflow disaster. First, direct economic cost incurred in the mudflow area and comprises asset loss and revenue loss from the mudflow for the period 2006–2015. Second, indirect economic cost includes the loss of revenue, increased costs, and assets lost in areas surrounding the mudflow area that were not directly affected (indirect effects include asset prices, transportation business revenue, hotel and restaurant business revenue, and fishery business). These effects are felt throughout a much greater area, which includes Surabaya city, Pasuruan, Gresik, Jember, Malang, Banyuwangi, and Probolinggo regency. Third, relocation economic cost is the increasing cost that is higher than compensation/reimbursement costs for residences, micro- and small businesses, and plant relocation.
2.4.
Disaster Response and Compensation Scheme
10
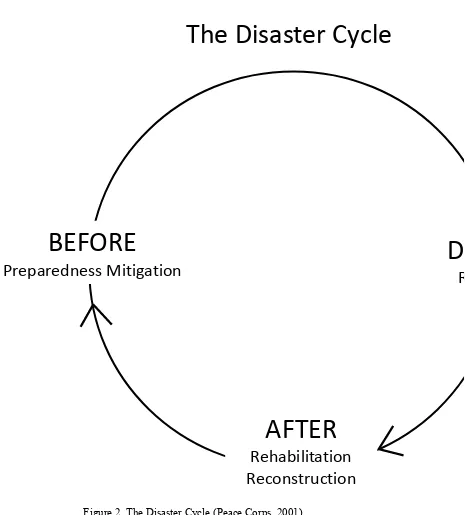
Figure 2. The Disaster Cycle (Peace Corps, 2001)
Moreover, UNEP (2006) stated that mitigation is closely related to disaster management. The well-known model among nations is the Hyogo Framework for Action 2005– 2015, which was announced at the World Conference of Disaster Reduction in Kobe, Hyogo, Japan on January 18–22, 2005. There are several options for mitigation:
1) Develop alternatives that are environmentally better
The Disaster Cycle
BEFORE
Preparedness Mitigation
DUR
Res
AFTER
Rehabilitation
11 2) Make changes in planning and design
3) Implement impact monitoring and management 4) Compensate for
- Residual impacts - Monetary payments - Site remediation bonds - Resettlement plans
- In-kind measures and offsets
After the Sidoarjo mudflow explosion, the first response was conducted by Lapindo Brantas Inc., the oil drilling operator. The Sidoarjo Regency government arranged the standard operating procedures for the Sidoarjo mudflow mitigation via the Local Planning and Development Board, including rehabilitation, reconstruction, and relocation procedures. However, these procedures were not followed and no rehabilitation, reconstruction, and relocation action reports are available (BPK-RI, 2007).
In order to prevent the widespread impact of the mudflow, the government of the Republic of Indonesia issued a mitigation policy conducted by Badan Penanggulangan Lumpur Sidoarjo (BPLS), the Sidoarjo Mudflow Management Board. The aims of this mitigation action were to overcome the infrastructure and social problems surrounding the mudflow area, with attention to the smallest environmental risk, and regulate the compensation of land and assets affected by the mudflow (Presidential Regulation 14/2007).
12
In order to establish a compensation agreement, some community leaders organized discussions and negotiations with Lapindo and the government in November 2006 that led to a consensus “cash and carry” agreement on December 4, 2006. The following were the main points of this agreement.
- It was a purely cash compensation deal for physical loss or damage of property. - An initial down payment of 20% was to be paid immediately upon proof of ownership. - The value of the property to be compensated was determined by a formula that did not take
into account the relative values of properties due to location, quality, or age; as a result, it was set at the high end of property values at that time. The following were the values: buildings @ IDR 1,500,000 (¥ 15,000) per m2; land @ IDR 1,000,000 (¥ 10,000) per m2; and rice fields @ IDR 120,000 (¥ 1,200) per m2.
- The remaining 80% was to be distributed after June 2006, one month before the end of a two-year period.
During the 2008 global economic crisis, Lapindo Brantas Inc. claimed that cash and carry payments were overstretching its fund resources. The company suggested alternative schemes. The first included resettlement in new homes at the KNV housing estate KNV in Jati village in Sidoarjo district, plus compensation for property loss (less the value of the new home), paid in installments of IDR 15 million (¥150,000) per month. This was termed “cash and resettlement.” Second, compensation was made for property lost, paid in installments of IDR 15 million per month, without resettlement to new homes. This alternative was still referred to as “cash and carry” (Richard, 2011. p. 114-118).
13
For further analysis, we call the Renojoyo area Place A, the KNV area Place B, and Others, and examine how households chose where to move and how their economic condition was changed due to the disaster.
3.
Evidence on the Resettlement Process
3.1.
Overview
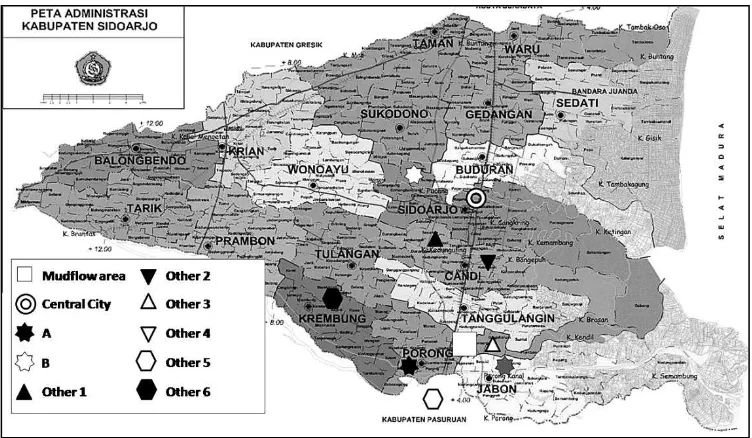
In order to investigate households’ economic impact and resettlement behavior, 104 resettled households that had moved from Renokenongo to Place A, Place B, and Others were selected as the sample. We conducted a survey and interviewed the household members in March and April 2012. The questions encompassed the following categories: 1) general data (identity, etc.); 2) household member data (age, job, education level, etc.); 3) asset and income data; and 4) brief opinions regarding the relocation. The distance from the mudflow area and the central city of Sidoarjo Regency are depicted in Figure 3 and Table 2.
Figure 3. The Locations of Resettlement Areas
14
Resettlement Area Distance from (km) Sample
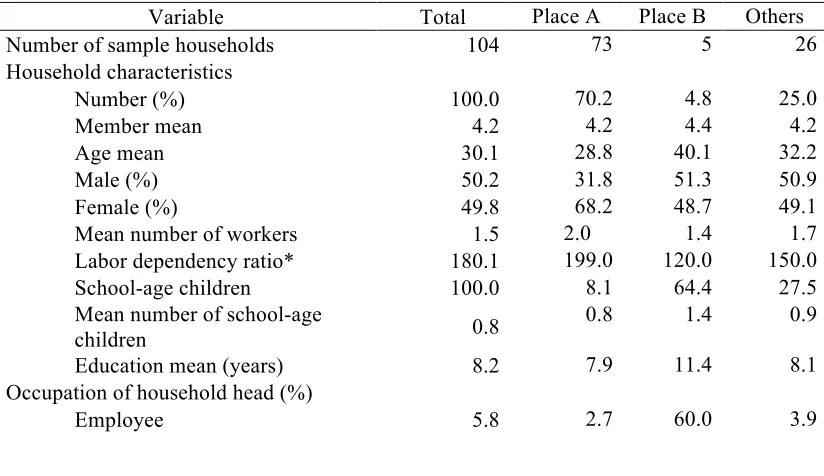
Mudflow Center of City education is 8.2 years, or the second year of junior high school. The villagers who live in Place B had a better education level than Others, on average (11.4 years or Senior High School). Another feature of Place B is that it had fewer school-age children in each household (1.40 persons per household). Further, we divided occupation into six categories; the largest proportion of the people were found to be self-employed (44.23%).
Table 3. Basic data of the resettlement areas
Variable Total Place A Place B Others
Labor dependency ratio* 180.1 199.0 120.0 150.0
15
Note: * represents dependency of household members on labor in household for every 100 laborers.
Source: Author’s survey.
3.2.
Resettlement Behavior and Economic Loss
After the eruption of the mudflow erupted on May 29, 2006, refugees from Renokenongo village appeared in Wangkal (hamlet a), Balungnongo (hamlet b), Sengon (hamlet c), and Reno (hamlet d); these have been divided into two refugee streams, as shown in Table 4:
Table 4. Renokenongo villagers’ refugee streams after the Sidoarjo mudflow disaster (2006–2009)
Stage Time Origin of hamlet Number of households
I August–November 2006 Hamlet a ±1,108
16
and negotiating the compensation scheme. Based on Presidential Decree 14/2007, the compensation payment is “cash and carry,” where the first down payment is 20% and the other 80% was paid within two years (May 2008). However, not all community members agreed with this and they each established an advocacy group to fight for their interests (there are at least four groups: GEPPRES, Tim 16 Perumtas, Pagar Rekorlap, and GKLL).
In order to resolve the conflict, Lapindo Brantas Inc. offered to relocate them to KNV, which is located near central Sidoarjo city (see Figure 2 and Table 2). In addition to receiving houses in KNV, they also received cash money equal to the value of their assets; the group that did not accept this was called GKLL. Otherwise, of approximately 700 households of Renokenongo refugees, approximately 400 decided to relocate to a new area called Renojoyo (see Fig. 4); this group was called Pagar Rekorlap.
In brief, the resettlement of Renokenongo village’s communities was divided into three major choices:
1. Place A: The decision of the Pagar Rekorlap group, the majority of the second-stage refugee stream that chose compensation with cash money (cash and carry system). This group bought a sugar cane cultivation area and built their new residential area in Kedungsolok village.
2. Place B: Supported by the oil drilling company (Lapindo Brantas Inc.). Its establishment was based on a compensation scheme (cash and resettlement) where the company relocated the communities into a new area and gave them new houses and cash money equivalent to the value of their assets. It is located near Sidoarjo’s city center.
17
Figure 4. Resettlement Flowchart
Table 5 presents the number of household members and relatives in the same village before and after resettlement. Interestingly, wherever people chose to resettle, they typically had relatives living around them.
Table 5. Household members and relative numbers before and after resettlement
Variable Total Place A Place B Others
Household members:
Before resettlement 5.1 5.2 5.2 4.7
After resettlement 4.2 4.2 4.4 4.2
Difference -0.9 -1.0 -0.8 -0.5
Relative number:
Before resettlement 2.5 2.9 4.8 1.0
After resettlement 1.7 2.2 2.6 0.2
Difference -0.8 -0.7 -2.2 -0.8
Sample number 104 73 5 26
18
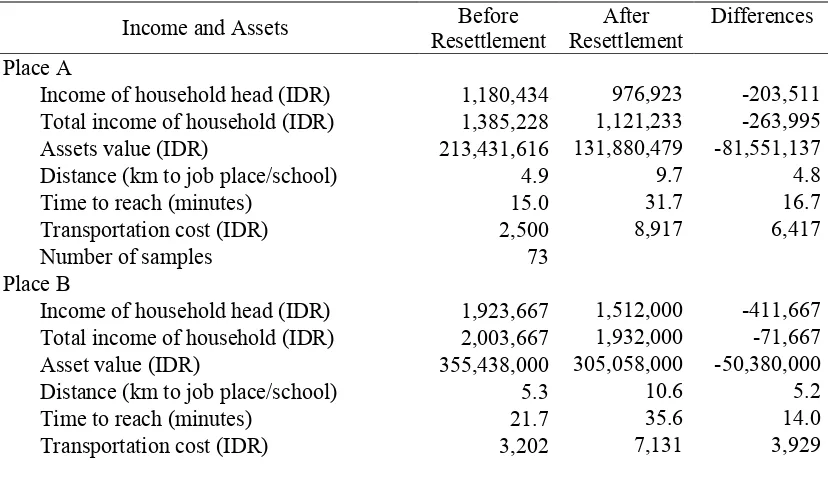
Table 6 describes the households’ economic data. It shows that income and asset values decreased after the disaster. It is evident that there was an increase in transportation aspects, such as distance, time to reach, and cost. The details of the economic data are shown in Table 7. The data indicate that asset values decreased least at Place A (-81,551,137 IDR); the increases in distance, transportation time, and cost were lowest at Place A as well.
Table 6. Household economic data (all samples)
Income and Assets Before
Income of household head (IDR) 1,219,936 932,308 -287,628 Total household income (IDR) 1,595,417 1,290,240 -305,177
Asset value (IDR) 211,525,462 137,226,827 -74,298,635
Transportation (to job place/school)
Table 7. Household economic data of each resettlement area
Income and Assets Before
Income of household head (IDR) 1,180,434 976,923 -203,511 Total income of household (IDR) 1,385,228 1,121,233 -263,995
Assets value (IDR) 213,431,616 131,880,479 -81,551,137
Distance (km to job place/school) 4.9 9.7 4.8
Time to reach (minutes) 15.0 31.7 16.7
Transportation cost (IDR) 2,500 8,917 6,417
Number of samples 73
Place B
Income of household head (IDR) 1,923,667 1,512,000 -411,667 Total income of household (IDR) 2,003,667 1,932,000 -71,667
Asset value (IDR) 355,438,000 305,058,000 -50,380,000
Distance (km to job place/school) 5.3 10.6 5.2
Time to reach (minutes) 21.7 35.6 14.0
19
Number of samples 5
Others
Income of household head (IDR) 1,195,513 976,923 -218,590 Total income of household (IDR) 2,107,051 1,641,346 -465,705
Asset value (IDR) 178,498,077 119,962,500 -58,535,577
Distance (km to job place/school) 5.6 7.1 1.5
Time to reach (minutes) 23.8 31.7 7.9
Transportation cost (IDR) 4,092 6,421 2,329
Number of samples 26
1 ¥ = 100 IDR
Source: Author’s survey
4.
Empirical Study
4.1.
Analytical Framework
The aims of this study are 1) to understand villagers’ resettlement behavior and 2) to examine the impact of disaster on the rural area, particularly the impact of income change after the Sidoarjo mudflow disaster. For these purposes, we analyzed the villagers’ choice of resettlement and examined the determinants of economic loss after resettlement.
The community resettlement types following the Sidoarjo mudflow disaster can be divided into two groups of households: (1) those that chose the cash and resettlement payment scheme to live in Place B, provided by the company (Lapindo Brantas Inc.), and (2) those who chose the cash and carry payment scheme and resettled independently. The survey indicated that some of the households that chose the cash and carry payment scheme decided to live together in the same new area (Place A) in Kedungsolok village. Furthermore, community resettlement behavior was examined by comparing the social and economic impacts among Place A, Place B, and Others.
20
reveal that some villagers prefer a familiar situation to accessibility. This implies that the social cohesion of villagers, particularly relatives, was the main aspect of resettlement preference.
Table 8. Degree of resettlement preference: Accessibility and social cohesion Self-report regarding the statement, “The accessibility of the new resettlement area
is more important than having a familiar neighborhood situation.”
(5) (4) (3) (2) (1)
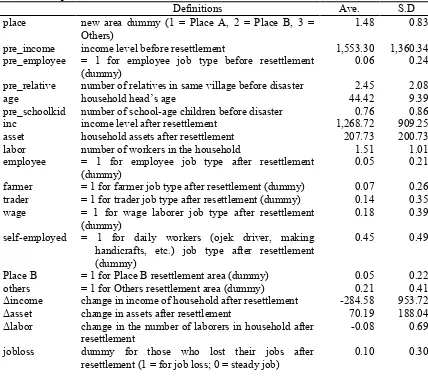
Table 9. Independent variables for the estimation
Definitions Ave. S.D
place new area dummy (1 = Place A, 2 = Place B, 3 = Others)
1.48 0.83
pre_income income level before resettlement 1,553.30 1,360.34 pre_employee = 1 for employee job type before resettlement
(dummy)
0.06 0.24
pre_relative number of relatives in same village before disaster 2.45 2.08
age household head’s age 44.42 9.39
pre_schoolkid number of school-age children before disaster 0.76 0.86
inc income level after resettlement 1,268.72 909.25
asset household assets after resettlement 207.73 200.73
labor number of workers in the household 1.51 1.01
employee = 1 for employee job type after resettlement (dummy)
0.05 0.21
farmer = 1 for farmer job type after resettlement (dummy) 0.07 0.26 trader = 1 for trader job type after resettlement (dummy) 0.14 0.35 wage = 1 for wage laborer job type after resettlement
(dummy)
0.18 0.39
self-employed = 1 for daily workers (ojek driver, making handicrafts, etc.) job type after resettlement (dummy)
0.45 0.49
Place B = 1 for Place B resettlement area (dummy) 0.05 0.22
others = 1 for Others resettlement area (dummy) 0.21 0.41
Δincome change in income of household after resettlement -284.58 953.72
Δasset change in assets after resettlement 70.19 188.04
Δlabor change in the number of laborers in household after resettlement
-0.08 0.69 jobloss dummy for those who lost their jobs after
resettlement (1 = for job loss; 0 = steady job)
0.10 0.30
21
Here, we examined how households chose their resettlement area. It is assumed that the households face three choices for resettlement: 1) Place A, 2) Place B, 3) Others. The probabilities of preferring these areas are denoted as P1, P2, and P3, respectively. Let X2 be the vector of the characteristics’ variables that determines each household’s choice. Then, the multinomial logit estimation method is employed to estimate Pj (j = 1, 2, 3) in the following households’ resettlement behavior, such as previous income, the dummy for the employee’s previous job type, previous number of relatives, household head’s age, and previous number of school-age children (Table 9 summarizes the definitions of the various explanatory variables).
β1 is a coefficient vector that reflects the effects of these variables; u1 is an error term.
We also collected data on households’ evaluations of the statement, “The Sidoarjo mudflow has had an economic impact on households.” The collected data reveals that more than 80% of households experienced an economic impact after the disaster based on a 5-point scale (1 = strongly disagree to 5 = strongly agree), as depicted in Table 10.
Table 10. Degree of agreement: Economic impact of Sidoarjo mudflow on households Self-report regarding “The Sidoarjo mudflow has had an economic impact on
22
In order to examine the economic impact of the disaster, we regressed the households’ economic level after resettlement. Furthermore, in order to examine the determinants of the impact on change in household income, we regressed the income change of households as the following equation by applying an ordinary least squares (OLS) estimation:
(2) income = β20 + β21asset + β22labor + β23employee+ β24farmer + β25trader +
β26wage + β27self-employed + β28placeB + β29others.
(3) Δincome = β30 + β31Δasset + β32Δrelative + β33Δlabor + β34employee +
β35farmer + β36trader + β37wage + β38self-employed + β39jobloss
+ β40placeB + β41others.
The coefficients of income and income change reflect the economic impacts of the Sidoarjo mudflow through the households’ income levels (equation 2) and the change in these levels caused by the disaster (equation 3).
4.2.
Preference for a New Area
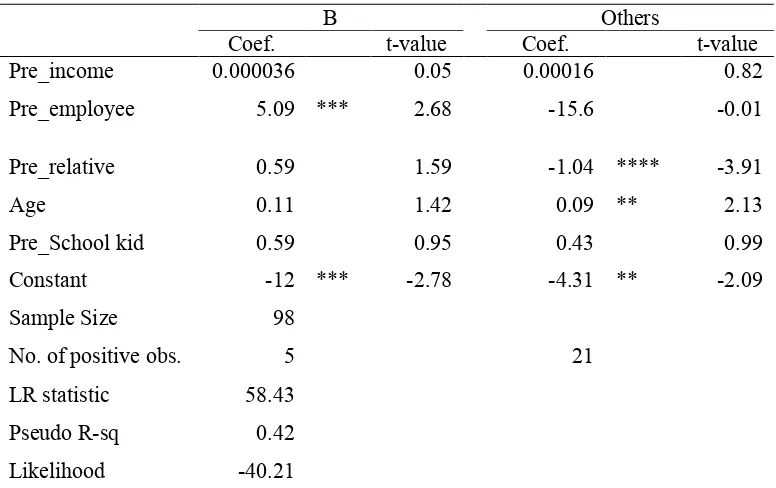
In terms of location preferences, according to the estimation result in Table 11, employees tended to choose Place B more than Place A. This is understandable because Place B is located nearer to the center of the city (4 km) than Place A (17 km). Furthermore, villagers who had more relatives before the disaster chose Place A over Others because of their social bond, which led them to move with other households in a community. Moreover, the elderly tended to resettle in Others rather than Place A because they were mature enough to decide independently (i.e., they were not influenced by the group’s choice of Place A); moreover, they had sons or daughters who had already settled in Others.
23
all members should share mutual respect and mutual happiness. Moreover, their living system generally includes grouping and kinship (gemeinschaft).
With regard to the non-significance of the number of school-age children variable that represents the education factor, it is evident that job type and relative relationship between villagers were considered more important factors than education when determining the new resettlement area.
Table 11. Result of multinomial logit estimation of area preference
B Others
Coef. t-value Coef. t-value
Pre_income 0.000036 0.05 0.00016 0.82
Pre_employee 5.09 *** 2.68 -15.6 -0.01
Pre_relative 0.59 1.59 -1.04 **** -3.91
Age 0.11 1.42 0.09 ** 2.13
Pre_School kid 0.59 0.95 0.43 0.99
Constant -12 *** -2.78 -4.31 ** -2.09
Sample Size 98
No. of positive obs. 5 21
LR statistic 58.43
Pseudo R-sq 0.42
Likelihood -40.21
1) The coefficient based on resettlement preference of Place A
2) *, **, ***, **** indicate significance at the 10%, 5%, 1%, and 0.1% levels, respectively.
24
4.3.
Household Income after Resettlement
Estimation results of household income level demonstrate relationships between household income after resettlement and other aspects such as age, number of laborers, job types, and new chosen area (Table 12). The result shows that increasing labor will also increase household income. This result is understandable because more laborers and workers in a household will increase household income. Furthermore, the results show that households in Place A earned less income than households in Others.
Table 12. Results of OLS estimation of households’ income level Coefficient t-value
Constant -181.115 -0.618
Asset 0.556 1.404
Number of laborers 467.161 6.401 ****
Employee 1,532.808 3.602 ****
Trader 806.538 2.635 ***
Wage-labor 813.196 2.713 ***
Farmer 734.579 1.969 *
Self-employed 346.690 1.296
Place B 61.440 0.145
Others 348.868 1.825 *
Sample size 98
1) The coefficient based on the resettlement preference to Place A 2) *, **, ***, **** indicate significance at the 10%, 5%, 1%, and 0.1%
levels, respectively.
25
The number of laborers affects income (467.161) at the 0.1% significance level; the income variable is in thousand IDR units. This means that increasing the number of laborers in a household will increase its income by 467,161 IDR (¥ 4,672) per month.
Compared to unemployment, all types of jobs have a significant income impact. We found that the highest income among other job types is earned by employees; the lowest income is earned by the farmer. Based on these results, the income level of the self-employed is not significant. This shows that employees, such as civil servants and salaried workers, tend to have more stable jobs than other job types.
The results also show that Place A’s income is less than that of Others (-348,868 IDR or ¥3,489) at the 10% significance level, while Place B has no significant income effect among households.
Further, the results reveal a difference in income level among job types and a higher income level in Others than in Place A. However, it is not clear whether these differences are due to the disaster impact or the resulting resettlement action. We will attempt to determine this in the next analysis of change in household income after resettlement.
4.4. Change in Household Income after Resettlement
Table 13 shows the change in household income after resettlement. Traders and freelancers had the most significant income change. Communities that lost their jobs also felt the impact of income change.
Table 13. Results of OLS estimation of change in household income Coefficient t-value
Constant 855.0700 1.609
Asset change -0.6997 -1.250
Relatives number change 83.8890 1.434
Labor number change -33.2400 -0.236
26
1) The coefficient based on the resettlement preference for Place A 2) *, **, ***, **** indicate significance at the 10%, 5%, 1%, and 0.1%
levels, respectively.
Source: Author’s survey and estimation
Income change has a significant effect on the trader job type at the 5% significance level; the income of traders decreased by -1,452,585 IDR (¥-14,526) after resettlement. Income change also has a significant effect on the change in income of the self-employed at the 10% significance level; their income decreased by -1,007,607 IDR (¥ -10,076) after resettlement. It is understandable that traders and freelancers felt significant effects of income change because the activities associated with their job types depend on social links and relatives. Hence, their loss of customers and relatives would affect their business. However, the relative change did not significantly impact income change.
The job loss variable also has a significant effect on income change at the 5% significance level; this means that when workers change jobs, their income decreases by -1,318.106 IDR (¥-13,181). This is understandable because, based on the survey, 75% of job changes result in self-employment and it is a challenge for them to establish businesses in new resettlement areas.
27
activities and were forced to find a new place and new customers. Some established new business activities at locations farther away than before; others began new business activities in their houses. As trader and freelancer business activities depend on social connections and relatives’ availability, more such links and an increased number of relatives would result in greater opportunities as well.
According to the results, there is no significant economic impact caused by resettlement to Place B and Others. Hence, the lower income level at Place A compared to Others is not due to resettlement. Furthermore, with regard to the economic impact mentioned in the previous analysis, income level differs across job types. However, only traders and the self-employed have been significantly impacted by the resettlement.
5.
Conclusion
After the 2006 Sidoarjo mudflow, Lapindo Brantas Inc., the company responsible for the disaster, provided a resettlement residential area at the most strategic location of the eight relocation areas: KNV or Place B. However, some villagers, who wanted to move with their relatives, chose to build a new area called Renojoyo (Place A) in former sugarcane land, farther from the center of the city.
In terms of location preferences, employees tended to choose Place B because its location is nearer to the city center. Villagers with more relatives tended to choose Place A because they wanted to move with other households in a community. However, along with location, the education factor that we predicted—the number of school-age children—was considered by the villagers to be less important than job type and number of relatives.
28
Based on the above results, we highly recommend the following actions in terms of the mitigation policy and future resettlement:
1. Mitigation Policy (on-going action)
With regard to the economic impact of the Sidoarjo mudflow, traders and self-employed workers were most significantly impacted by resettlement after the disaster. Hence, in order to recover their income level, policy makers and other stakeholders should give aid and assist them in order to broaden their marketing channels.
Moreover, there have been many job losses because of the disaster. Numerous people are still struggling to get new jobs and some have become self-employed workers. Hence, policy makers should provide job hunting and skill training programs.
2. Future Resettlement
29
References
Achmad R.F. 2011. “Cultural Planning as a Solution at Displacement and Recovery Problem in the Porong Mud Volcano Disaster.” Journal of US-China Public Administration, 8 (11),
pp. 1227-1241.
Ali Badri, S., Ali Asgary, Eftekhari, A.R., and Levy Jason. 2006. “Post-disaster resettlement, development and change: A case study of the 1990 Manjil earthquake in Iran.”
Disasters, 30 (4), pp. 451-468.
Badan Penanggulangan Lumpur Sidoarjo (BPLS). 2010a. Rencana Strategis 2010-2014 (Strategic Plan 2010-2014). Surabaya: Sidoarjo Mudflow Mitigation Agency, vii 156pp. ______________. 2010b. “Kemajuan Penanggulangan Lumpur Sidoarjo (Sidoarjo Mudflow
Mitigation Progress).” Surabaya: Sidoarjo Mudflow Mitigation Agency, 21pp.
30
Davies, R.J., Swarbrick, R.E., Evans, R.J., and Huuse, M. 2007. “Birth of a mud volcano: East Java, 29 May 2006”. Geologocial Society of America Today, 17 (2), pp. 4-9.
Garatwa, W. and Bollin, C. 2002. Disaster Risk Management. Working Concept. Eschborn: Gesellschaft für Technische Zusammenarbeit (GTZ), 48pp.
Gunadharma. 2012. “Masyarakat Pedesaan dan Masyarakat Perkotaan,” Bab 7: Bahan Mata Kuliah Ilmu Sosial Dasar. (“the Rural and Urban Communities”, in Chapter VII:
Introduction of Social Science Lecture’s Material.” Jakarta: Gunadharma University, pp. 145-183.
Maddala 1983. Limited Dependent and Qualitative Variables in Econometrics. Cambridge: Cambridge University Press, xiii 401pp.
Makiko H., Mark J. S. 2009. “Social costs of displacement in Louisiana after Hurricanes Katrina and Rita.” Population and Environment Journal. 31, 64-86pp.
McMichael H. 2009. “The Lapindo Mudflow Disaster: Environmental, Infrastructure and Economic Impact.” Bulletin of Indonesian Economic Studies. 45 (1). pp. 73-83.
Peace Corps. 2001. Disaster Preparedness and Mitigation (DPM): A Pre-Service Training Module. Washington: Peace Corps, vi 113pp.
Richard, J. R. 2011. Report into the Past, Present and Future Social Impacts of Lumpur Sidoarjo. Sidoarjo: Humanitus Sidoarjo Fund, 181pp.
Turtiningtyas, Ayu R., Deguchi Chikashi, and Yoshitake Tetsunobu. 2011. “Disaster Risk Reduction to Municipal Spatial Plan: A Case Study of Mudflow Disaster in Sidoarjo, Indonesia.” European Journal of Social Science, 23 (4), pp. 646-659.
Turtiningtyas, Ayu R.. 2009. “The Shift of Housing Preferences Post Disaster.” Aceh: Tsunami and Disaster Mitigation Research Center, Syiah Kuala University, 12pp.
31
United Nations Disaster Assessment and Coordination Mission (UN-UNDAC). 2006.
Environmental Assessment Hot Mudflow East Java, Indonesia. Switzerland: United Nations Environment Programme, iii 59pp.
Zhang, J., Okada, N., Tatano, H. 2005. Integrated Natural Disaster Risk Management: Comprehensive and Integrated Model and Chinese Strategy Choice. Proceeding of Fifth Annual International Institute for Applied System Analysis (IIASA) on September 14-18, 2005. Beijing: Beijing Normal University, 14pp.
http://prokum.esdm.go.id/perpres/2007/perpres_14_2007.pdf. 2012. “Peraturan Presiden Nomor 14 Tahun 2007 tentang Badan Penanggulangan Lumpur Sidoarjo (Presidential Regulation Number 14 of the Year 2007 of Sidoarjo Mudflow Management Board), article 1, paragraph 2.” Jakarta: website of Ministry of Energy and Mineral Resources Republic Indonesia.