CHAPTER III
METHODOLOGY OF RESEARCH
A. Location and Research Design A.1 Location
The research took place in MAL UIN SU Medan. This research conducted at
tenth year in academic year 2015 / 2016. There was reason for choosing this school because:
1. The researcher found the problem on the students’ ability in listening comprehension.
2. The researcher has done teaching practice (PPL) there.
3. There researcher found that students have difficulties in make a sentences. 4. From this location writer get easy to get the data that is needed in this research
A.2 Research Design
This study is an Experimental research which consists of pre-test and post-test
in order to know the effect of using audio-visual on the students’ ability in listening comprehension which had two purpose to provide answer to research questions and to control variance with two different group, namely control group and experimental
group. The design of this research can be illustrated below.
Group Type Treatment Type Control Pre-Test Using Audio Post Test
Experimental Pre-test Using Audio –
Visual
Post Test
B. Population and Sample
B.1 Population
According to Sugiyono (in Riduwan’s book) say that: "Population is the
generalization region consisting of objects or subjects that are of particular quantity and characteristics defined by the researchers to be studied and then drawn conclusions.1
According to Riduwan and Tita Lestari says that “Population is the whole and the characteristics or unit of measurement results the research object”
Population is a whole number that consists of an object or a subject that has certain characteristics and qualities defined by researchers to investigate and subsequently drawn conclusions. 2
Population is the set of all individuals or objects that become the subject or materials study by researchers.3
1 Riduwan, Dasar-Dasar Statiska, (Bandung, ALFABETA, 2009). P: 7-8
2Wiratna Sujarweni, Metodologi Penelitian, (Yogyakarta, PUSTAKABARUPRESS, 2014). P: 65
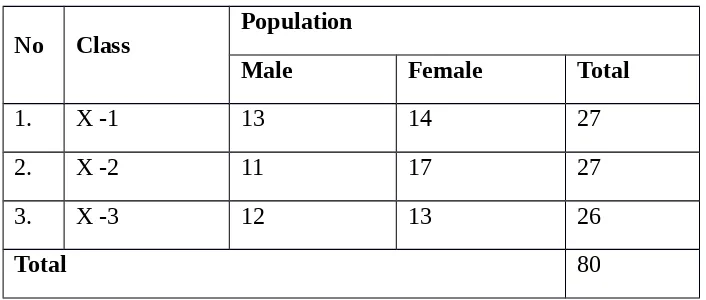
Base on the definition above, the population of this research was the tenth
years students at, MAL UIN SU Medan that consist of three classes, they was X-2 , X-3, so the number of population are 80 students. The number of the students each
classes as follow:
The Distribution of Population Based on Class Table 1.2
No Class Population
Male Female Total
1. X -1 13 14 27
2. X -2 11 17 27
3. X -3 12 13 26
Total 80
B.2 Sample
According to Riduwan say that: "The sample is part of the population that has
characteristic or certain situations to be examined. Because not all data and information will be processed and not all the persons or things to be studied but
simply by using a representative sample.
The sample is a subset of the population chosen for the researchers observed.4
Table 1.3
The Distribution of Sample
No Class Group Sample meaning of each variable research aims to understand the meaning of each of the
variables prior to analysis.5
To avoid misunderstanding of operational definition in this thesis, the following clarification was probably required:
1. Independent variable (X) Audio – Visual is a media can help students become a better listener. The indicators of Audio – Visual are:
- Students can find the important information from the movie.
2. Students can understanding and retail Dependent variable (Y) the students’ ability in listening comprehension is their comprehension and ability in
listening comprehension Narrative Text. The indicators of the students’ ability in listening comprehension are:
- Students can listen very well
- Students can answer the question Students can find the main topic or main
idea of text and generic structure
- Students can find the specific information of text using own words.
- Students can answer based on the text
D. Instrument of Collecting Data
In this research, the researcher uses some instruments to collect data. There
are test and documentation. Test is an important part of every teaching and learning experience
According to Suharsimi Arikunto (in Riduwan’s book) says that instruments of collection data are the tools selected and used by researchers in its activities in order to collect these activities become systematic and facilitated by it.6
1. Test
Data in the study were divided into three, namely the facts, opinions and
abilities. Test instrument used to measure the presence or absence and the amount of objects that we examine capabilities. The test can be used to measure basic skills and attainment or achievement.7
Test as a data collection instrument is a set of questions or exercises that are used to measure the skills of knowledge, intelligence, ability, or talent possessed by
individuals or group. Data in the study, divided into three, namely the facts, opinions
6 Riduwan, Dasar-Dasar Statiska, (Bandung, ALFABETA, 2009). P: 51
and abilities. Instrument test used to measure the presence or absence and the amount
of objects that we examine capabilities. The test can be used to measure basic skills and attainment or achievement.8
According to Arikunto (in Riduwan’s book) test is a set of question or exercise or by any means which is used to measure the skill and the knowledge, intelligence, ability or talent proposed by individual or a group of people.
As mentioned before in this research, the research instruments are test. There are two tests that is used in this research, pre-test and post-test.
1. Pre-Test
Here, the researcher gives a test to the student by taking the previously material. Pre-test was conducted to know students listening comprehension before
getting the treatment. The test consists of 20 questions.
2. Post-test
A post-test was given to the students after conducting the treatment. As the pre-test, it consis of 20 questions in the form of fill in gap. The type of the test is achievement test means the test must representative of structure and skill that will be
tested then the test must appropriate with the grade. The purpose of this kind of test is to establish how successful individual students, group of students, or the courses
themselves have been in achieving objectives. Its means that, achievement test that is used to measure the process that students making after learn something in achieving
objectives. This test used to measure the students' ability in listening comprehension
before and after they taught by using Audio – Visual in MAL UIN SU Medan. The test contsins simple listening comprehension that they learnt or the material that they
got in the class.
Every test consist of 20 questions. The test had given to the students as pre-test and post-pre-test based on agreement from English teacher on this school.
Furthermore, the scoring for the tests was done with the same way. Since the form of test was all objectives test, so the researcher treats them without any difference.
Means, there was only one correct answer for each items. The scoring guide is as the formula follow:
Score = Number of correct items
20 x 100
2. Documentation
The documentation is intended to obtain data directly from the study, includes
books relevant legislation, activity reports, photographs, and relevant data research.9
E. Technique of Collecting Data
In the first meeting, the researcher will give the students pre-test. Pre-test that has been made will be given to all of the students both in control group and
Experimental group. The students will be asked to do the pre-test to the given time. It
will be held on 40 minutes.
In the second meeting, the researcher will give come in the Experimental class
and the control class too. Here, the researcher will review about definition narrative text, generic structure and function.
In the third meeting, the researcher will give the treatment in Experimental
class. The students will be taught by using audio – visual in listening comprehension. Meanwhile the other class (control class) will be taught as usual (without audio
-visual) about how to listening comprehension
After all of the activity is done, in the last meeting the researcher will give all of the students post-test. The students have to do the test in 40 minutes. In each
meeting the researcher will make documentation as evidence that the activities are done.
F. Technique of Analyzing Data
The data to be analyzed was obtained by giving the listening comprehension test to the students in order to know their listening comprehension on narrative text. It
is calculated by using scores of listening comprehension test in both the Experimental group and control group. To know whether the usage of audio – visual has
a. The Validity of the Test
To know whether the test is valid or not, the writer used Product Moment Correlation formula:
Rxy= N
∑
xy−∑
x∑
y√
{
(N∑
x2−(
∑
x)
2}{
N∑
y2−(
∑
y)
2}
Rxy = The comparison of pre-question and role turning over questionnaire
strategy on the students ability in comprehending text
N = Number of sample
X = The sum of mastering pre-question and role turning over questionnaire
Y = The sum of students’ ability in comprehending text.
XY = The total sum of X and Y.
If r score > r table level 0, 05 can be concluded that the items is valid. After the test was done, the result all of the items were valid.
b. The Data Normality Test
The writer use Liliefors test to test the data normality with the following
steps10:
Calculating average and standard deviation by the formula:
X=
∑
xi fi∑
fi Perception x1, x2, …xn made permanent number z1, z2, z3,…zn by using the
formula:
Zi= xi−x
S
Where, x = average value, S = standard deviation.
To every this permanent number and using by enlist of permanent normal distribution, and then calculating the opportunity
F (Zi) = P (Z < Zi)
Here, after calculating a proportion Z1, Z2, …Zn, the smaller equal to Zi.
Counting the difference F(Zi) – S(Zi), and then determine its absolute price.
Taking the biggest price among absolute price of the difference and
mentioning the price by Lo. If Lo < L obtained from the critical value test, the
Liliefors with the real level = 0.05, hence the distribution is normal.
a. Homogeneity Test
To test whether variants of both homogenous sample, variants equality test,
that is:
The rule of take a conclusion is with compare the value of F test with F table
. The criteria is if F test ˃ F table so H o is accepted and H a is rejected it
means the variants are not homogeny. If F test ˂ F table so H o is rejected and H
a is accepted or variants is homogeny.11
b. Hypothesis Test
The hypothesis test which will be used is “t” test with the formula12 :
t=
Ma = the mean of Experimental group
Mb = the mean of control group
x2
=¿
∑
¿ deviation of Experimental group∑
y2 = deviation control group11 Indra Jaya, Statistik Penelitian Untuk Pendidikan (Bandung : Citapustaka Media Perintis, 2010), p. 186.