Chinese Business Review, ISSN 1537-1506 January 2012, Vol. 11, No. 1, 99-108
Economic Valuation of Lead Impact to Human Health
in Yogyakarta Urban Area, Indonesia
*
Evi Gravitiani
Sebelas Maret University, Surakarta, Indonesia Arief Failasuffuddien
Janabadra University, Yogyakarta, Indonesia
The urban economic development needs transportation facilities. People moves form one location to the other rapidly. The amount of vehicle increases, it also increases lead content in the air. As a research topic is the human health cost increases as lead content in the air increases. Lead impacts increase public health cost. This research identifies the determinant of public health cost and estimates the respondent’s willingness to pay (WTP). The respondents are 146 people in three areas of study, Yogyakarta City, Sleman Regency, and Bantul Regency. Dose response method determinates the valuation of lead impact caused by emission to human health. Contingent valuation method estimates the respondents’ WTP to take care human health by keeping the environmental condition. It is analyzed by ordered probit model. By increasing lead pollutant, the health impacts are 123,647 cases of incremental child IQ, 15,783 cases of hypertension, 17 cases of coroner core, and 127 cases of premature mortality. Total health compensation cost because of lead impact is 1,469,594,723,409 (US $ 122,466,226.95). The increasing of the probability of respondent’s WTP is only 0.00000233 percent, if the dependent variables increase one percent. It indicates that people’s awareness to keep their environment and to decrease lead content is not good enough, despite the fact that there is some increase of awareness for example.
Keywords: air pollution, lead, human health, willingness to pay
Introduction
The growth of economy along with technological development and industrial activities gives negative
impacts to environment, especially in urban area. The economic and physical development must be followed by environmental management to reduce their impacts and to create sustainable development.
The urban transportation facilities are important for economic activity. The growth of economy is signed by the increase of income per-capita, which subsequently will increase the public purchasing power to purchase
vehicles. The increasing number of vehicles will make the traffic on central business district more crowded.
*
Thanks to Department of Higher Education of Republic of Indonesia, for supporting the research funding; Prof. Adi Heru Sutomo and Dr. Latief Sahubawa for advises to this study.
Dr. Evi Gravitiani, SE, M.Si, Economics Faculty, Sebelas Maret University. Arief Failasuffuddien, SE, M.Si, Economics Faculty, Janabadra University.
Correspondence concerning this article should be addressed to Dr. Evi Gravitiani, SE, M.Si, Griya Kencana Permai B III-12 Sedayu Bantul Yogyakarta, Indonesia. E-mail: e_gravity2000@yahoo.com.
DAVID PUBLISHING
According to Dixon (1996), the negative impacts of pollution in urban area are:
(1) Impacts on public health, they can be calculated with economic valuation; (2) Impacts on productivity, they also can be calculated with economic valuation;
(3) Impacts on environment, these are difficult to calculate because they occur during a long period of time; (4) Pollution impacts on urban area, these influence public health. Everybody has the willingness to pay, in
order to get a clean environment. The rich has more ability to pay than the poor in getting a clean environment. The most dangerous air pollutant for public health is lead from emission.
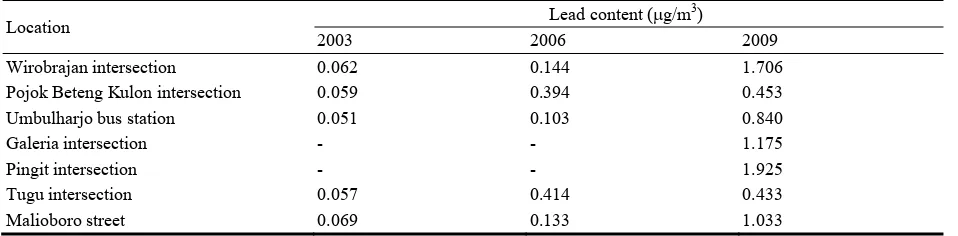
The content of leadin the air of Yogyakarta City is under the environment standards, 2 g/m3 per day. But this condition must be controlled, the content will increase because of the increasing of economic activity. The
content of lead in the air is shown in Table 1.
Table 1
Lead Content in Yogyakarta City, 2003, 2006, 2009
Location Lead content (g/m
3)
2003 2006 2009
Wirobrajan intersection 0.062 0.144 1.706
Pojok Beteng Kulon intersection 0.059 0.394 0.453
Umbulharjo bus station 0.051 0.103 0.840
Galeria intersection - - 1.175
Pingit intersection - - 1.925
Tugu intersection 0.057 0.414 0.433
Malioboro street 0.069 0.133 1.033
Note. Source: Health Dept., and Environmental Control Bureau, DIY Province, 2010.
Research Problems
The research questions are as follows:
(1) The increase of lead from emission in urban area gives negative impacts on human health. Lead impacts
increase public health cost, how much is it?
(2) How much the willingness to pay to take care human health by keeping the environemental condition?
Literature Review
Air Pollution
Air is non-economic goods. It is atmosphere around the earth and has important function to mortal. Air has
ability to absorb pollutant in certain level, but if pollutant over limit, there is air pollution. Environment change in air pollution is because of nature process and human activities, so the air quality decreases. Sources of air
pollution are moving source form vehicle, and non-moving source form industry and household. Emission occurs atmosphere diffussion and chemical reaction which are decrease air quality. It happen because the increase of
lead content. Traffic density in urban area causes high lead content in the air. Lead from emission stains environment 88 percent from total lead in the air.
Sources of air pollution are devided in to two moving source, e.g., industrial and household activities, and
non-moving source, says emission. Pollutants are solid and liquid.
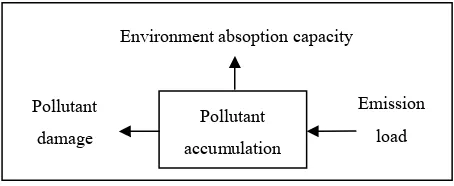
Pollutant is classified by ascendancy area, vertical and horizontal area. Horizontal area is source of local
pollutant damage at emission source inspite of regional pollutant at a wider area from emission source. Vertical area is damage of pollutant consentration at surface, called “surface pollutant”, and atmosphere is “global
pollutant”. Figure 1 shows vertical and horizontal pollutant area (Tietenberg, 1998).
Figure 1. Emission and pollution damage.
Lead in Human Body
Lead is toxin causes illness of heart, kidney, neuro system, and brain. Lead binds enzime production and haemoglobine, so the body lack of oxigen and it will broken in certain time. The 1 μg/m3 increases of lead content in the air causes the 4-10 μg/l increases of lead content in human body with 8 hours per-week exposed (Health Dept, 2007). Besides blood, lead content in human body can be detected by urine and hair. Sunoko study
(Bapedalda, 2007) said that lead content on hair is higher than on blood. Sutomo (Bapedalda, 2007) shows lead content on children urine is higher than normal limit, 0.1786 mg/l in average. Normal limit of lead content on
urine for adult is 0.15 mg/l and for children is 0.08 mg/l (Bapedalda, 2007).
People who live in urban area has higher lead content in their blood than in rural area. Normal limit of lead
content on blood is 0.05-0.4 ppm; 0.4-0.6 ppm is exposed because of their work; 0.6-0.8 ppm is high level of lead
content; and above 0.8 ppm causes lead exposed venom (Lee, 1999). Lead enters human body biologically by three phases:
(1) Expose, un-organic lead enters through respiratory and absorption system, and by skin contact for organic lead;
(2) Toxochinetic, lead is absorted and distributed by blood flow to all body. Lead enters to human body through respirator is 20 μg and through food and drink is 300 μg when lead content in the air increases 1 μg/m3 (Lee, 1999). Lead enters through food only 5 percent is absorbed and by respirator is 40 percent. It means if lead content in the air increases 1 μg/m3, lead absorbed by human body increases 23 μg. Lead exposure through respiratory system is 5-50 μg per day and 20-50 percent of it will be absorbed by human body;
(3) Toxodynamic, 15 percent lead in human body restipitates on soft and hard network body system.
Economic Valuation of Air Pollution
Economic valuation is defined as a contribution to people willingness. Marginal value is related with the
change of uses. Based on the theory of market value, the relation between price, buyer’s marginal benefit, and seller’s marginal cost can be minutelly. If price increases, quantity of goods decreases, vice versa. Non-market
value theory says environmental good is non-market values. It is assumed as public goods which are consumed Pollutant
accumulation Pollutant
damage
by everyone.
Basic technic of economic valuation is services and household relationship. Utility function is the asumption of services and environment relation, it is :
U = Y0.5 - E0.5 (1)
where U is utility, Y is household income, and E is impact. The equation shows in certain level of income, utility
is derivated as the decreasing of environmental quality.
Econometric model which is used to analyze WTP is ordered probit model, with multinominal-choice and
ordinal for dependent variables (Common, 1996). This model is a discrete choiceto analyze data from contingent valuation survey. Linear model can be used, where WTP* is linear function of independent variables.
WTPi = 0, if WTPi*≤μ0
WTPi = 1, if μ0< WTPi*≤μ1
WTPi = 2, if μ1 < WTPi*≤μ2
...
WTPi = j, if WTPi* >μj-1 (2)
where: WTPi* = index (unobservable)to determinate WTP max for object i;
β’ = coeficient, effect of change of x to WTP’s probability;
xi = independent variables, characteristic of observed object;
ε = error term.
Research Method
This study analyzes economic cost of the impacts of emission for human health, adopted from the studies of Dixon (1996), and Ostro et al. (1994, 1996, 1998). Dixon’s and Ostro et al.’s studies use dose-response
relationship method. They use the basis data from United States, Canada, and England.
Contingent valuation method is also used in this study to analyze the willingness to pay to take care human
health by keeping good environmental condition.
Data and Variables
This study is using the secondary data from Public Hospital, Department of Public Health, Statistic Bureau (2006), Environment Control Bureau of DIY Province (2007) and Regional Development Planning Board; and
also other research institutions and laboratories. There are Yogyakarta population and density, lead ambient, and lead emission. Economic valuation needs data Purchasing Power Parity (PPP), the comparison of Gross National
Product percapita (GNP/capita) Indonesia and America, and exchange rate US $ to Rupiah from Indonesian Bank Report. The PPP is used because there is productivity in Indonesia and America (Todaro, 2000; World Bank,
1992, 2002). The formula is :
capAmerika GNP
ia capIndones GNP
PPP
/ /
(3)
where: PPP = purchasing power parity;
GNP/cap Ind = Gross National Product percapita Indonesia;
GNP/cap US = Gross National Product percapita America.
impacts of the diseases are determined by incremental IQ of child, hypertension, heart disease, and premature
mortalility (Ostro, 1994).
The primary data is used survey method through direct interviews with respondent questionaire. The
primary data are income, willingness to pay the health risk cost of lead exposed to human, hospital cost, morbidity cost, self-cure, income lost, income, gender, and water source.
Population and Sample
Selected population of this study is people who have disease because they are exposed by lead. Random
technic based on respondent’s acceptance and refuse are used in this study. Lead in respondent’s blood is tested by blood sample on laboratory. The sample formula is (Common, 1996):
2 2 ½ 1 .4 p p
n
(4)where: n = sample size;
p = proportion of success from sample;
q = proportion (1 - p);
Z½ = coeficient of confidence;
= tolerance of error from population average on left (L) and right limit (R), so = L + R.
The amount of sample is 146, the assumption is p = 85% and q = 15%, = 5% and Z½= 1.96; L = R = 5% so
= 10%. It is devided to three areas, Yogyakarta City is 117, Sleman Regency is 23, and Bantul Regency is five.
Methodology
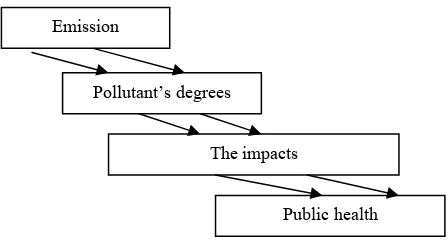
Valuation on the pollution impact on health is avoided. It is because of the difficulty to conduct it (Ostro,
1994). To analyze the impacts, the researcher needs knowledge about chain form emission to the impact to human health, as shown in Figure 2.
Figure 2. The chain of air pollution impact.
The pollutant impacts are filtering by four steps process (Common, 1996) :
(1) Is the impact internal one? (2) Is the impact relatively small?
If the answers for the questions 1 and 2 are yes, the impacts excluded from quantitative calculation with the reasons:
(3) Is the impact sensitive if predicted objectively? Emission
Pollutant’s degrees
The impacts
If yes, the impact is describe qualitatively and quantitatively calculated;
If no, provide the reason why the impact can’t be quantitatively. (4) Can the impact be provided ?
If yes, conduct the calculation process of the impact.
Analysis Tools
Dose-response method. Most studies using the dose response method have been done in industrial countries (Lvovsky, 1998). However, this method can be used in developing countries with extrapolation and the
result is proven.
Economic valuation of the impact of air pollution caused by emission to human health is done by four
factors determinant. Those are dose-response coefficient, a number of people exposed, the change of the pollutant content in the air and economic valuation toward human health.
In Harmaini’s study (1996), economic valuation (Garrod, 1999) can be conducted after the filtering process of pollution impacts, with willingness to pay (WTP) and cost of illness (COI) approaches.
Monetary value per case needed from those approaches can be obtained by using purchasing power parity in the country where the study is carried out (Lvovsky, 1998). Monetary value is multiplied by the number of cases
for every impact and then the result is summed up. The final result is the total of health impacts for every change of air quality.
The first step is to estimate the air pollution’s impact on human health, by calculating dose-response coefficient. It describes the estimation of change of public health cases, because of the change of air quality. The
next step is multiplying dose-response coefficients with the number of people exposed. The impact of pollution
can affect a number of people in certain areas or all. The third step is calculating the impact of air pollution with public health, by calculating the change of air quality. Actual change depends on air quality standard and the data
which we obtain. Air quality standard depends on the local standard of a country, Environmental Protection Agency (EPA) United States, and World Health Organization (WHO).
Several Ostro’s studies (1996) used this method to estimate the air pollutant impact to health. This method is also called dose-response relationship because it describes relationship between the pollutant concentration (dose)
and the physical impact (response) toward human health. The formula is (Ostro, 1994):
dA Popi bi
dHi . . (5)
where: dHi = the risk change of human health in region i;
bi = dose-response coefficient;
POPi = the number of people exposed;
dA = the change of air ambient pollutant under consideration.
The last step is economic valuation by calculating the benefit estimation of human health. The economic valuation depends on willingness to pay estimation to decrease the risk of premature mortality. The cost of illness
approach is used to estimate the change of morbidity.This study is focused on the air pollution impact on health. The impacts of non-health, such as the building damage, vegetation damage, and the environment degradation
are not discussed (Cesar, 2002; Gallasi, 2000; Salt Lake, 1998).
of 10 μg/m3 lead is 0.96 percent. The average of estimation variations is, between 0.31 percent and 1.49 present. The lead pollution impacts on health are premature mortality, hypertension, coroner core, and the incremental intelligentsia question (IQ) of children. Central estimation coefficients dose-response function for
lead are used to calculate the impact estimation.
Contingent valuation method (CVM). It is the direct survey method on certain population of their willingness to pay (WTP) and willingness to acceptt (WTA). CVM is used to use alternative path in peak hours, to analyze how much money that their willing to pay to reduce lead content in the air and to keep the environment,
in order that impact can be minimized. CVM has two benefits comparing with indirect method. First, CVM can get two values, use value and non-use value. Second, the answer of WTP or WTP question can be corrected
directly by monetary in the change.
This study is used ordered probit model that dependent variables has two or more options and there are
quantitative variables. The model is :
WTPtbl= f (HC, MbC, SC, IL, Inc, DJK, Dair) (6)
where: WTPtbl = willingness to pay the health risk cost of lead exposed to human;
HC = hospital cost;
MbC = morbidity cost;
SC = self-curation;
IL = income lost;
Inc = income;
DJK = gender, dummy variable, 1 = man, 0 = woman;
Dair = water source, dummy variable, 1 = PDAM, 0 = others.
Conclusion
Health Compensation Cost
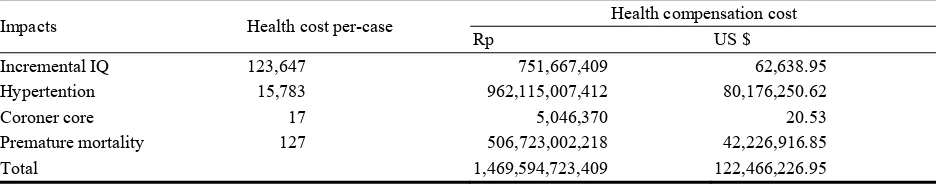
The calculation of health impacts by using dose response method caused by of lead is 123,647 cases incremental child IQ, 15,783 cases of hypertension, 17 cases of coroner core, and 127 cases of premature
mortality. Economic valuation because of lead pollution for incremental IQ cases is Rp 751,667,409 (US $ 62,638.95), hypertension is Rp 962,115,007,412 (US $ 80,176,250.62); coroner core is Rp 5,046,370 (US
$ 20.53), and premature mortality is Rp 506,723,002,218 (US $ 42,226,916.85). Total health compensation cost because of lead is Rp 1,469,594,723,409 (US $ 122,466,226.95). It shows in Table 2.
Table 2
Estimation the Lead Impact to Human Health
Impacts Health cost per-case Health compensation cost
Rp US $
Incremental IQ 123,647 751,667,409 62,638.95
Hypertention 15,783 962,115,007,412 80,176,250.62
Coroner core 17 5,046,370 20.53
Premature mortality 127 506,723,002,218 42,226,916.85
Total 1,469,594,723,409 122,466,226.95
Willingness to Pay
Variables of hospital cost, morbidity cost, self-cure, income lost, income, gender, and water source influence the probability of respondent’s willingness to pay the health risk cost of lead exposed. WTPmax is
maximum willingness of respondent to pay the health cost. Respondent who has WTPmax less than Rp 50,000 (WTP = 0) is 88.36 percent; 8.22 percent has WTPmax Rp 50,000, until less than Rp 100,000 (WTP = 1).
Respondent who has WTPmax Rp 100,000, until less than Rp 150,000 (WTP = 2) is 0 percent; 0.68 percent has WTPmax Rp 150.000, until less than Rp 200,000 (WTP = 3); and 2.74 percent has WTPmax more than Rp
200,000, (WTP = 4).
The first step to analyze using ordered probit model is estimating all independent variables in model with
ordinary least square to indicate the variables are significant or not. The un-significant variables are tested by redundant variables and the result is in Table 3.
Table 3
Redundant Variables
Redundant variables: DJK DAIR
F-statistic 1.257968 Probability 0.287566
Log likelihood ratio 2.641422 Probability 0.266945
The ratio log likehood is 2.641422 with probability 0.266945 or 26.6945 percent, bigger than F-satistic
value, so the variables is out from model.
Second step is ordered probit model regression. There are four variables that influence the rank order
probability of WTP, i.e., hospital cost, morbidity cost, self-cure, income lost, and income, is shown in Table 3. Interpretation of this model is used marginal effect, and it need previous calculation of predicted value by retires
average value of each independent variable to latent indeks (β’x). This value is used to estimate predicted probability for each group of WTP by count probability of normal standart cumulative density function (CDF).
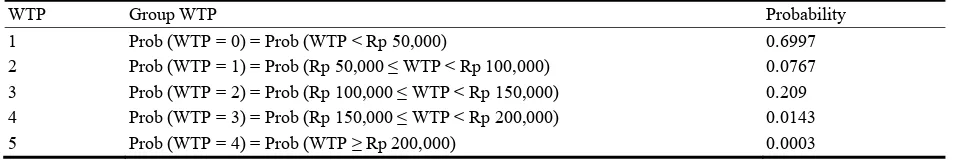
Estimation of group WTP’s is shown in Table 4.
Table 4
Estimation of Group WTP’s Probability of Respondent
WTP Group WTP Probability
1 Prob (WTP = 0) = Prob (WTP < Rp 50,000) 0.6997
2 Prob (WTP = 1) = Prob (Rp 50,000 ≤ WTP < Rp 100,000) 0.0767 3 Prob (WTP = 2) = Prob (Rp 100,000 ≤ WTP < Rp 150,000) 0.209 4 Prob (WTP = 3) = Prob (Rp 150,000 ≤ WTP < Rp 200,000) 0.0143
5 Prob (WTP = 4) = Prob (WTP ≥ Rp 200,000) 0.0003
Note. Source: Analysis result, 2008.
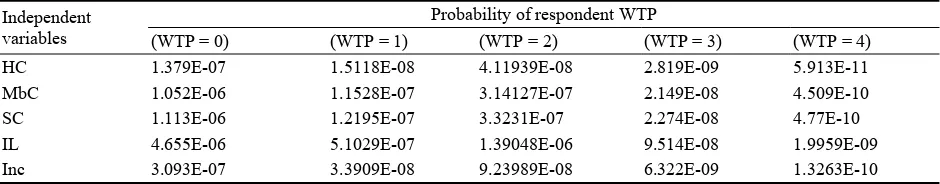
Marginal effect is estimated after counting the probability of each variable with the formula that illustrates the influence of independent variables to respondent WTP:
Marginal effect the influence of independent variables to probability of respondent’s WTP is shown in Table 5.
Table 5
Marginal Effect—The Influence of Independent Variables to Probability of Respondent’s WTP
Independent variables
Probability of respondent WTP
(WTP = 0) (WTP = 1) (WTP = 2) (WTP = 3) (WTP = 4)
HC 1.379E-07 1.5118E-08 4.11939E-08 2.819E-09 5.913E-11
MbC 1.052E-06 1.1528E-07 3.14127E-07 2.149E-08 4.509E-10
SC 1.113E-06 1.2195E-07 3.3231E-07 2.274E-08 4.77E-10
IL 4.655E-06 5.1029E-07 1.39048E-06 9.514E-08 1.9959E-09
Inc 3.093E-07 3.3909E-08 9.23989E-08 6.322E-09 1.3263E-10
Note. Source: Analysis result, 2010.
Multicolinierity is detected by software Eviews 5.0, autocorrelation by correlogram and heteroscedasticity by generalized residual method and Park test. The results of all the tests indicate that there is not classical
assumption problems on the model.
Discussion
Variables of hospital cost, morbidity cost, self-curation, income lost, and income influence the rank order probability of respondent WTP to keep the environmental condition. If they increase one percent, it will increase
the probability of respondent’s WTP 0.00000233 percent. It indicates the increasing of people’s awareness to keep the environmental condition, despite the awareness is still low.
Government role is necessary to reduce lead content in the Yogyakarta air, for example lead reduction integrated system that involves community active participation. The system is arranged by several variables, such
as transportation management, public transportation mode, and lead absorbance tree planting.
References
Cesar, et al. The Mexico Air Quality Management Team. (2002). Improving air quality in metropolitan Mexico City: An economic valuation. The World Bank, Washington D.C..
Common, M. (1996). Environmental and resources economics: An introduction (2nd ed.). Addison Wesley Longman Publishing. New York
Controlling Board of Regional Environmental Impact DIY Province. (2007). Monitoring report of environment quality. Bapedalda DIY Province. Yogyakarta. Indonesia
Dixon, J. A. (1996). The economic valuation of health impacts. Working paper No. 1304. World Bank.
Gallasi, C. (2000). Exposure to PM10 in the eight major Italian cities and quantification of health effects. World Health Organization, European Centre for Environmental and Health. Rome Division. Italy.
Garrod, G., & Willis, K. G. (1999). Economic valuation of the environment. Edward Elgar, UK. Health Department and Environmental Control Bureau. (2007). DIY province. Yogyakarta, Indonesia.
Lee, J. A. (1999). Natural resources and environmental economic (2nd ed.). Pearson Education Limited, London
Ostro, B. D. (1994). The health effect of pollution: A methodology with application to Jakarta. Working paper series No. 130. The World Bank, Washington D.C..
Ostro, B. D., Eskeland, G. S., Aranda, C., & Sanchez, J. M. (1996). Air pollution and mortality: Result from a study of Santiago, Chile. Working paper series No. 1453. The World Bank, Washington D.C..
Ostro, B. D., Eskeland, G. S., Feyzioglu, T., & Sanchez, J. M. (1998). Air pollution and health effects : A study of respiratory illness among children in Santiago. Chile, The World Bank, Washington D.C..
Salt Lake City-County. (1998). Governing the motor vehicle emission. Inspection/maintenance program for control of air contaminant emissions from motor vehicles. USA.
Statistical Beurau DIY Province. (2006). DIY in number. BPS DIY Province, Yogyakarta.
Todaro, M. P. (2000). Economic development in the third world (7th ed.). London: Addison Wesley. Longman Limited. Tom Tietenberg. (1998). Environmental economics and policy (2nd ed.). USA: Addison Wesley.