TOP OF MIND AWARENESS (TOMA) STRATEGY
FOR HYPERMARKET ‘X’ IN SURABAYA
Indri Hapsari, Theresia A. Pawitra, Christine Natalia
Industrial Engineering – Universitas Surabaya Jl. Raya Kalirungkut – Surabaya, 60293
Abstract - Surabaya as one of the biggest cities in Indonesia has great demands for retail industry. There are 5 hypermarkets in Surabaya, with 3 of them dominate 88.5% total revenue in 2009. This competition has causes every hypermarket to rearrange and refresh their marketing strategies in order to win the competition. The questions that the hypermarket X’s manager has to answer are mostly about these 3 questions. The first one is ‘Does my brand is the first retrieved brand?’. Using Top-of-Mind Awareness concept, a self-administered questionnaire was used to gain the data from 150 respondents, with 138 were completely filled. The result is Carrefour leads with 43.48%, meanwhile Hypermarket X only gains 20.29%. The second one is ‘Do consumers purchase at the first retrieved brand?’ The Chi-square test with significant level below 0.05 proves that there is a relationship between TOMA Hypermarket and future purchased hypermarket. And the last question is ‘How my hypermarket will be able to be the first retrieved brand?’ Paired t-test, Chi-square, Discriminant, and Quadrant analysis will explain it. Hypermarket X needs to maintain their ‘empathy', improve their ‘reliability’ and ‘price guarantee’ by ‘advertisement’, in order to win the competition.
Keywords: Top of Mind Awareness, Retailing, Hypermarket, Discriminant, Chi-square
INTRODUCTION
The top 3 of most well known retail formats in Indonesia are supermarket, mini market (convenience store), and hypermarket. Large companies run hypermarket since it requires more than IDR 10 billions to run a hypermarket, while individuals usually own supermarket. In terms of size, a hypermarket is larger than a supermarket. Usually a hypermarket has more than 5,000 square meters. It is located at the street corner and it sells more than 25,000 various items.
The Hypermarket in Indonesia has a very good performance. In 2008, its total revenue was 41.7% from the entire modern retail industry in Indonesia. Hypermarket has dominated the retail industry since 2004 and it was getting stronger in 2005 with the growth average of 16.4% per year, higher than supermarket and mini market, although its first introduction in the market happened in 2000.
From the network distributions, 83% are located in Java; with its main distributions are in Jakarta, West Java and East Java. This decision is based on the heavy population and due to the higher income that earned by the local populations of that areas. The tough competition causes hypermarket has to have good strategies in order to win the competition.
traditional and modern retail industry can prevent hypermarkets’ movement in winning the competition.
Surabaya as one of the biggest cities in Indonesia, with 2.9 million population has 5 hypermarkets. It is assumed that the revenue composition in Surabaya has the same number as in Indonesia. It has 7 Carrefour, 3 Hypermart and 4 Giant. They are scattered around Surabaya, and always crowded during the weekend.
Syamsul Munir as a retail observer explained that it is due to most of the consumers are the weekly buyers that use weekend as an occasion to shop and recreation at the same time. Relating with that issue, in addition of well preparation and well implementation for every variables in the retail industry, they have to advertise the available items and the benefits that consumers will gain from shopping at their hypermarket. The main objective of the publication is not mainly about increasing the sales, but also for the brand image so that consumers will shop at there.
There are some questions that every hypermarket manager has to answer, does my brand is the first retrieved brand? How can my hypermarket be the first retrieved brand? Do consumers purchase at the first retrieved brand? Nowadays consumers' mindsets are different then before. It's hard for them to trust someone, they will not make a commitment if they don't see the whole picture, also they are tired with sales pressure due to many choices that they have. As a result they are confused with this situation. Consumers will gain as many information as possible before they purchase an item. They believe by gaining more information about a specific product or service, they will make a better decision. Usually the steps begin with gathering information, reviewing alternatives, choosing one alternative and evaluating the decision. The step of gathering information is critical in order to have a successful business.
To measure the effectiveness of brand image and advertising, Top of Mind Awareness (TOMA) is the best alternatives. The first question that marketers must answer when examining the intensity of a brand's position is: how strong do the consumers associate the brand with the product category? If most consumers are not aware of the brand, it obviously does not have a very intense position in their minds. When consumers think about a product class, one or two brands usually come first to their mind. The brand that most consumers think at first when considering a product category has the most intense position in the market.
Hypermarket X, as one of hypermarket leaders, has strategies to win the competition. We observed that its strategies are almost the same with the entire brands of hypermarket. They promote in the newspaper on weekend by offering these three things: lower price than other retail format, great number of items, and price guarantee. Since every hypermarket use the same strategies, Hypermarket X worry with the issue of ineffectiveness.
This study aims at answering the following questions:
1. Which hypermarket becomes a TOMA hypermarket and future purchased hypermarket? 2. Is there any relationship between TOMA and future purchased hypermarket?
3. Is there any relationship between respondents’ demography and respondents’ TOMA hypermarket?
4. Are there any expectation level differences among respondents’ TOMA hypermarket? 5. Is there any significant difference between expectation and satisfaction level?
BACKGROUND
Brand awareness is the ability of a potential consumer to recognize or to recall the brand name as a type of retailer or product/service. Thus, brand awareness is the link that strengthens between the brand name and the merchandise or service category in consumers' mind. There is a range of awareness from aided recall to top-of mind awareness. Aided recall is when consumers indicate they know the brand when the name is presented to them (Kapferer, 1997, pp137). TOMA will happen when consumers mention a specific brand name at the first place when they are asked about the type of retailer, a merchandise category, or a type of service (Levy and Weitz, 2007, pp516). High TOMA means a specific retailer typically will be in serious consideration when consumers decide to shop for a type of product or service.
The goal of most advertising and promotional strategies is to increase the possibility for its brand to be included in the consumer's evoked set and considering during alternative evaluation (Belch and Belch, 2004, pp116). One easy way to measure, the intensity of a brand's association within a product category is to compare the proportion of 'first mentions'. It receives relative to other brands using unaided brand recall (consumers are asked to name all the brands they can think of in product category within a specified time limit without any prompting from the interviewer).When consumers think about a product class, one or two brands usually come first to their mind. The brand that most consumers think of the first when considering a product category has the most intense position in the market (Mullins et al, 2008, pp333). This TOMA is particularly important for low involvement products where most consumers do not search for information or compare alternatives before making a purchase (Kapferer, 1997, p408).
Substantial evidence supports the proposition that TOMA (brand or store retrieved first from memory) is associated strongly with choice of the first brand or store retrieved. Certain brand/store attributes and benefits serve as associated cues, which automatically activate the brand or store, name most accessible from a consumer’s long-term memory for each associate.
Consequently, asking a consumer to retrieve (access from memory) the name of the store or brand that is ‘‘best,’’ for each of a limited number of benefits or attributes is likely to be useful for understanding the stores or brands the consumer shops/buys. While unlikely to be observed for all, consumers who report most often buying a given brand or shopping at a given store will retrieve this brand/store first for the same, or a very similar, constellation of benefits (Woodside, 1996, pp36).
In general, advertising is valued because it is recognized as performing five critical communications functions (Shimp, 2010, pp188), namely:
1. Informing 2. Influencing
3. Reminding and increasing salience 4. Adding value
5. Assisting other company efforts
Because advertising is an efficient form of communication capable of reaching mass audiences at a relatively low cost per contact, it facilitates the introduction of new brands and increases demand for existing brands, largely by increasing consumers' TOMA for established brands in mature product categories.
CONCEPTUAL FRAMEWORK AND RESEARCH HYPOTHESES
Hypermarket Expectation
Hypermarket X Satisfaction
TOMA Hypermarket
Demography
Future Purchased Hypermarket
H1
H2 H3
H4
Performance Benefit Perceived Service
Communication Method External Factors
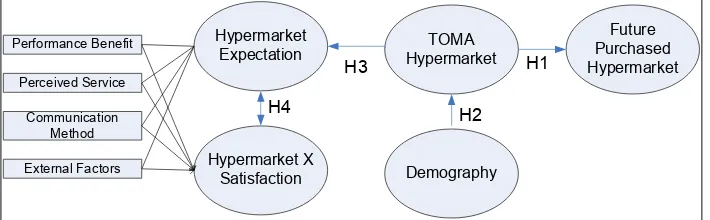
Figure 1. Model for TOMA Hypermarket
The first hypothesis is about relationship between TOMA hypermarket and future purchased hypermarket. We have assumption that TOMA hypermarket will affect consumers to choose the hypermarket as shopping place. Then we want to explore is there any effect the respondents’ demography to their TOMA Hypermarket option, that is in second hypothesis.
We have 4 dimensions or 15 variables for the expectation and satisfaction assessment. The factors have been confirmed with the retail mix on Levy and Weitz (2007, pp121, pp520, pp625) and added with factors in journal of Woodside and Randolph (2001). They are:
1. Performance belief
Retail tries to alter consumers’s belief about retailer’s performance, increasing the retailer’s performance rating on characteristics. It’s costly for a retailer to improve its performance on all benefits. Thus, a retailer should focus efforts on improving performance on benefits that are important to consumers in its target market.
- Affordable price - Convenience shopping - Product availability - Complete information
2. Perceived service
Consumers base on their evaluations of store service by using their perceptions. While these perceptions are affected by the actual service provided, service due to its intangibility is often hard to evaluate accurately.
- Reliability - Tangibility - Empathy - Responsiveness - Assurance
3. Communication method
The classification is based on whether the methods are impersonal or personal and paid or unpaid. - Advertising
4. External factors
Distance and safety environment have affects to consumer's memory and consumer's shopping behaviour.
- Strategic location - Safety environment
The third hypothesis almost same with the second, but this time we want to know if there are any differences between respondents’ TOMA hypermarket and expectation level. The fourth want to prove the differences between expectation and satisfaction level.
METHODS
Population and Sample
The target population of this study is women with range of age below 30 years old up to above 50 years old and living at Surabaya. Because there are three hypermarkets that have big revenue, respondents must have ever shopped to all hypermarkets. These three hypermarkets are Carrefour, Giant and Hypermarket X. Respondents were randomly selected for this study to represent the target population. A structure questionnaire was developed and 150 were distributed based, which 138 returned completely.
The Instrument
The study instrument or questionnaire consists of three parts. Part one included some questions about the demographic information. Part two included five-point scales and 15 variables. One was about consumers’ expectations, and the other one was about their satisfaction about the fulfillment of their expectations. Part three included two open questions about the TOMA hypermarket and future purchased hypermarket.
The questionnaire was developed in a way that allows consumers to grade their responses the expectations scale on a five-point scale: very unimportant = 1, unimportant = 2, neutral = 3, important = 4, and very important = 5. The satisfaction scale ranged from very disagree = 1; disagree = 2; neutral = 3, agree = 4, and very agree = 5.
Validity and Reliability
Four steps were conducted to increase the validity of the questionnaire: The items forming the questionnaire were developed after collecting data by preliminarily survey, reviewing the relevant literature, the comments and suggestions of Hypermarket X manager, and 20 consumers were asked to answer the questionnaire (pilot study). Their suggestion and notes were also taken into consideration.
The reliability of the questionnaire was measured using the Cronbach’s Alpha; it was 85.1% for expectations scale and 83.1% for the satisfaction scale.
Procedures
significant differences between 15 expectation scale items and 15 satisfaction scale items. The significance level used for the inferential statistics was 0.05.
RESULTS
Based on the sampling questionnaires, we can describe the respondents’ demography in Figure 2.
Age
Most of respondents are below 30 years old (45.65%). The reason is many young women like to shop in hypermarket. Opposite with this, elderly women respondents (above 50 years old) choose not to shop in hypermarket (10.86%). They often shop twice a month in hypermarket (47%). ‘Else’ means less than once a week, three times a month or more than once a month. The average purchasing was between IDR 200,000 up to IDR 400,000 (36.23%), followed by under IDR 200,000 (34.78%). From location’s percentage, we discovered that the respondents are spreader around Surabaya, which means they are qualified to represent all Surabaya’s citizen.
TOMA Hypermarket
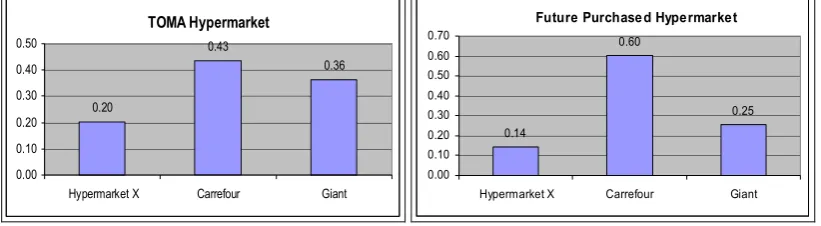
Figure 3. TOMA and Future Purchased Hypermarket
Figure 3 shows Carrefour was the first answer when the respondents were asked to mention a brand name of hypermarket, with percentage of 43.48%. The third one was Hypermarket X with the percentage of 20.29%. The same result was obtained when we did the future purchased hypermarket research, (60.14% mentioned Carrefour, and only 14.49% mentioned Hypermarket X. From this data, we can conclude that Carrefour is the winner.
From this information, we can also prove the hypothesis. By using Chi-square test, the conclusion can be:
H0: There is no relationship between TOMA hypermarket’s mean and future purchased
hypermarket mean, or
H1: There is relationship between TOMA hypermarket’s mean and future purchased hypermarket
mean
means there is a relationship between TOMA hypermarket’s mean and future purchased hypermarket. Therefore, TOMA hypermarket is consumers' first option to shop. Being a TOMA hypermarket is significant in winning the competition.
We did the Chi-square test to analyze any implications of respondents’ demography with their option of TOMA hypermarket. The hypothesis is:
H0: There is no relationship between respondents’ demography and TOMA hypermarket, or
H1: There is relationship between respondents’ demography and TOMA hypermarket
The significant level for all variables are above 0.05, which means respondents’ demography have no implication with their TOMA hypermarket option. For further information the respondents were also asked about their reason why they can remember the hypermarket’s brand name. Most of their reason is they remember because they often go to that hypermarket. Therefore, TOMA hypermarket is not only about image, but also about performance that attracts consumers to buy regularly.
There is an assumption respondents’ TOMA will assess the expectation level differently. The hypothesis for Discriminant Test is:
H0: Respondents’ TOMA hypermarket has no difference expectation level
H1: Respondents’ TOMA hypermarket has difference expectation level
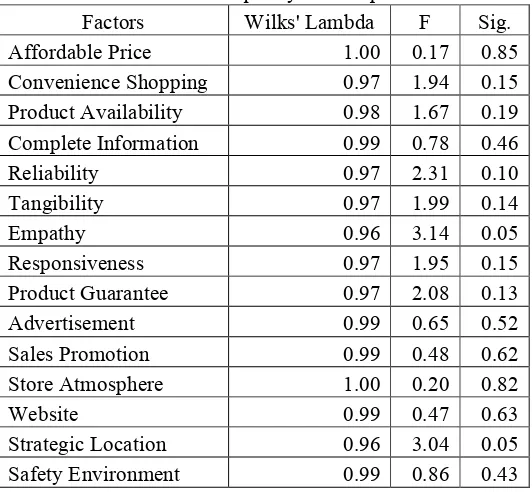
Table 1. Test of Equality of Group Means
Factors Wilks' Lambda F Sig.
Affordable Price 1.00 0.17 0.85
Convenience Shopping 0.97 1.94 0.15
Product Availability 0.98 1.67 0.19
Complete Information 0.99 0.78 0.46
Reliability 0.97 2.31 0.10
Tangibility 0.97 1.99 0.14
Empathy 0.96 3.14 0.05
Responsiveness 0.97 1.95 0.15
Product Guarantee 0.97 2.08 0.13
Advertisement 0.99 0.65 0.52
Sales Promotion 0.99 0.48 0.62
Store Atmosphere 1.00 0.20 0.82
Website 0.99 0.47 0.63
Strategic Location 0.96 3.04 0.05
Safety Environment 0.99 0.86 0.43
among respondents’ TOMA hypermarket, because for all variables the significance level is above 0.05.
5
4.5
4
3.5
3
E
mp
h
a
ty
Giant Carrefour
Hypermarket X
Top Of mind awareness 2
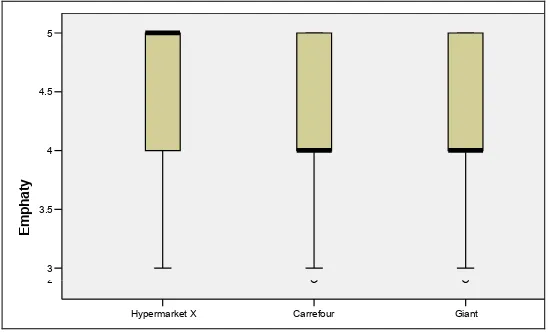
Figure 4. Candle Bar Graph
We used Chi-square test to analyze it, and the result showed respondents who choose Hypermarket X as their TOMA, feel ‘Empathy’ is more important (96.4%) than other hypermarkets (Carrefour 81.6%, and Giant 78%). The same result is showed when we compared it with the ‘Empathy’ satisfaction level for these three hypermarkets. Hypermarket X got the highest satisfaction level with percentage of (77.4%), than other hypermarkets (Carrefour with percentage of 68.9%, and Giant with percentage of 61.2%). Therefore, the respondents expect more empathy from Hypermarket X are not because of Hypermarket X has bad empathy, but they will more remember Hypermarket X as TOMA if its staffs can increase the empathy.
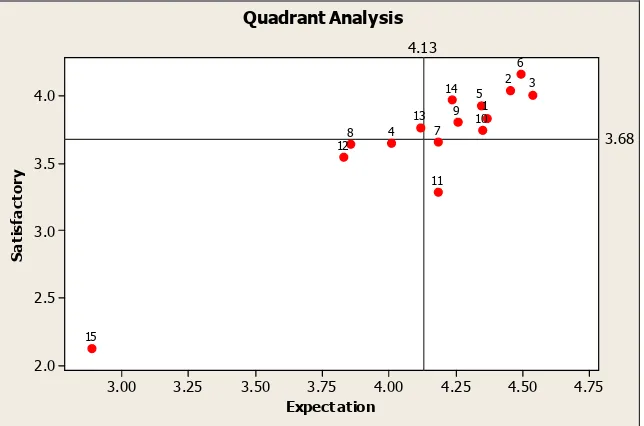
The next question is how to be a TOMA hypermarket. First, we can explore what the respondents want from a hypermarket. Then we measure the satisfaction level of consumers with Hypermarket X. From there we can conclude by quadrant analysis to find the weakest factor that must be improved.
We did Paired Sample Test (t-test) for all variables to discover whether there is any differences between expectation mean and satisfaction mean. The hypothesis is:
H0: There is no difference between expectation mean and satisfaction mean
H1: There is difference between expectation mean and satisfaction mean
Table 2. Paired Samples Correlations
Pair N Correlation Sig.
Pair 1 Expectation Affordable Price & Satisfaction
Affordable Price 138 .011 .900
Pair 2 Expectation Convenience Store & Satisfaction
Convenience Store 138 -.053 .538
Pair 3 Expectation Product Availability & Satisfaction
Product Availability 138 .042 .626
Pair 4 Expectation Product Information & Satisfaction
Product Information 138 .012 .884
Pair 5 Expectation Strategic Location & Satisfaction
Table 2. Paired Samples Correlations (continue)
Pair N Correlation Sig.
Pair 6 Expectation Safety Environment & Satisfaction
Safety Environment 138 -.020 .819
Pair 7 Expectation Reliability & Satisfaction Reliability 138 -.045 .600 Pair 8 Expectation Tangibility & Satisfaction Tangibility 138 -.048 .574 Pair 9 Expectation Empathy & Satisfaction Empathy 138 .066 .444 Pair 10 Expectation Responsiveness & Satisfaction
Responsiveness 138 .123 .150
Pair 11 Expectation Price Guarantee & Satisfaction Price
Guarantee 138 .024 .776
Pair 12 Expectation Advertisement & Satisfaction
Advertisement 138 .217 .010
Pair 13 Expectation Sales Promotion & Satisfaction Sales
Promotion 138 .117 .170
Pair 14 Expectation Store Atmosphere & Satisfaction
Store Atmosphere 138 .052 .549
Pair 15 Expectation Website & Satisfaction Website 138 .013 .881
The statistical significance that is showed in Table 2, all are above 0.05, except for ‘Advertisement’. It means there is a difference between respondents’ expectation and satisfaction. Respondents feel the Hypermarket X effort to advertise its stores or promotion are not enough. After exploring their reasons, we found that the respondents need more banner, newspaper and television advertisement about Hypermarket X’s promotion. Then, we need to analyze the expectation level and satisfaction level separately.
DISCUSSION
TOMA hypermarket explorations involved 138 respondents. Most of them were young women, expend IDR 200,000 up to IDR 400,000 per visit, shop twice a month, and living around Surabaya. The TOMA Hypermarket was Carrefour, and it was same with future purchased hypermarket. There is relationship between TOMA Hypermarket and future purchased hypermarket, which means if hypermarket X wants to win the competition, being the first brand retrieved is very important. There is difference in ‘Empathy’ expectation level among respondents’ TOMA hypermarket, while Hypermarket X consumers expect more than others do.
Variables like ‘Product Availability’, ‘Safety Environment’ and ‘Convenience Store’ are the respondents' main expectation. They said that product availability is a must for hypermarket. They only need one place that can fulfill all their requirements. Safety environment will enhance their shopping experience, since they do not need to worry about their vehicles in the car park, their ingress and egress, or even their safety when they are inside the hypermarket. Since consumers use hypermarket as a one-stop service to buy their needs, a convenience atmosphere is necessary to ensure consumers can enjoy the shopping experience. They do not need to spend time just to queue, they can easily seek the position of merchandise, and they can take a rest for a while if they feel tired. Most Surabaya's citizen, and may be Indonesia's citizen, do the shopping activity in the weekend, because they can bring the whole family to go with them. To ensure their kids happy and the kids will not disturb their shopping experience, respondents suggest that hypermarket should add playground inside.
’Website’ and ‘Tangibility’ are the most unimportant factor for hypermarket. From these 3 hypermarkets, only hypermarket X and Carrefour own a website. After we checked, the website is not up to date. Maybe it can be related with the internet penetration in Indonesia with the amount of 30 million people, or 12.3% in 2010. It is not a common activity to check the hypermarket promotion from the website. That’s why hypermarkets always use newspaper for their weekly promo, and provide nice brochure in each store. Tangibility means the attribute that can be detected with the senses, for example, display and staffs’ appearance. The respondents do not need an interesting display as long as hypermarket can offer a great price. Staffs’ appearance is not necessary. However, they must have empathy and good response to consumers' needs.
Respondents are satisfied with the ‘Safety Environment’, ‘Convenience Store’ and ‘Product Availability’. Since these factors are the most expected variables, Hypermarket X should feel proud for this result. It means that their effort’s focus until this day is still appropriate with respondents' main expectation. However, respondents were unsatisfied with these issues, ‘Website’ and ‘Price Guarantee’. Maybe it is because hypermarket X's website is not up-to-date, so the respondents feel useless to access this website. Hypermarket X guarantees its price is the lowest from other hypermarkets. They offer twice compensation from the price gap with other hypermarkets. But its competitor, Carrefour, offer ten times compensation from the price gap. Maybe that’s why respondents feel Hypermarket X price guarantee is less interesting than its competitor.
Quadrant analysis showed the weakest factors of Hypermarket X, which are ‘Reliability’ and ‘Price Guarantee’. Reliability means respondents can trust the hypermarket system will support their shopping activities. Like Point of Sales (POS) computerize system, service consistency and good product category management. In hypermarket X, this factor is weak so we suggest Hypermarket X to find out more why their system is less reliable.
price gap, but Carrefour offers more compensation, about ten times from the price gap. It will make hypermarkets’ consumers will compare. Otherwise, Hypermarket X also offers product replacement if there is a damaged, defect or an expired product. However, since the publication is less, few consumers know and understand about the price guarantee commitment. According to the result of difference between expectation and satisfaction level for ‘Advertisement’ variable, we suggest them to publish more attractive advertisements and also use other media such as television, radio, banner or brochure to inform the customers.
REFERENCES
1. Kapferer, J. N. (1997). Strategic Brand Management, Kogan Page Publishers.
2. Woodside, A. G. (1996). Measuring The Effectiveness of Image and Linkage Advertising: The
Nitty-Gritty of Maxi-Marketing,Greenwood Publishing Group.
3. Woodside, A. G., & Randolph, J. (2001). Learning why some consumer shop at less convinient stores, Journal Of Business Research, Vol.54, pp. 151-159.
4. Belch, G. E., & Belch, M. A. (2004). Advertising and Promotion: An Integrated Marketing
Communications Perspective, 6th edition, International Edition.
5. Mullins, J. W., Walker, O. C., & Boyd, H. W. (2008). Marketing Management: A Strategic
Decision-Making Approach, 6th edition, New York, McGraw-Hill.
6. Shimp, T. A. (2010). Integrated Marketing Communications in Advertising and Promotion, 8th edition, Australia: South-Western.