A MAP MASH-UP APPLICATION: INVESTIGATION THE TEMPORAL EFFECTS OF
CLIMATE CHANGE ON SALT LAKE BASIN
O. S. Kirtiloglua*, O. Orhan a, S. Ekercin b
a
Dept. of Geomatic Engineering, Selcuk University, Konya, Turkey, [email protected] – [email protected] b Dept. of Geomatic Engineering, Aksaray University, Aksaray, Turkey, [email protected]
KEY WORDS: Konya Closed Basin, Standardized Precipitation Index, Google API, NDVI, Mash-Up
ABSTRACT:
The main purpose of this paper is to investigate climate change effects that have been occurred at the beginning of the twenty-first century at the Konya Closed Basin (KCB) located in the semi-arid central Anatolian region of Turkey and particularly in Salt Lake region where many major wetlands located in and situated in KCB and to share the analysis results online in a Web Geographical Information System (GIS) environment. 71 Landsat 5-TM, 7-ETM+ and 8-OLI images and meteorological data obtained from 10 meteorological stations have been used at the scope of this work. 56 of Landsat images have been used for extraction of Salt Lake surface area through multi-temporal Landsat imagery collected from 2000 to 2014 in Salt lake basin. 15 of Landsat images have been used to make thematic maps of Normalised Difference Vegetation Index (NDVI) in KCB, and 10 meteorological stations data has been used to generate the Standardized Precipitation Index (SPI), which was used in drought studies. For the purpose of visualizing and sharing the results, a Web GIS-like environment has been established by using Google Maps and its useful data storage and manipulating product Fusion Tables which are all Google’s free of charge Web service elements. The infrastructure of web application includes HTML5, CSS3, JavaScript, Google Maps API V3 and Google Fusion Tables API technologies. These technologies make it possible to make effective “Map Mash-Ups” involving an embedded Google Map in a Web page, storing the spatial or tabular data in Fusion Tables and add this data as a map layer on embedded map. The analysing process and map mash-up application have been discussed in detail as the main sections of this paper.
* Corresponding author
1. INTRODUCTION
The climate system has been changed after preindustrial period. Some of the changes over the lakes and their basins are mainly due to reflect changes in precipitation, evaporation and human activities where the general assumption of vital role is played by the emission of greenhouse gasses (Kantarci, 2006).
Many investigations carried out in different parts of the world have noted shrinkage of lakes which are source of water to both humans and livestock. The shrinkage of lakes represents a huge threat due to increasing drought effects and anthropogenic activities. These activities may comprise, but not limited to, land cover and land use change, uncontrolled use of groundwater, deforestation, rising water demands, urbanization, dam construction and irrigation (Orhan et al., 2014; Yıldırım et al., 2011; Du et al., 2001; Yan et al., 2002; Penny and Kealhofer, 2005; Legesse and Ayenew, 2006; Kiage et al., 2007). Temporal climatic fluctuation, especially the change of precipitation, is believed to be the major cause of lake shrinkages (Birkett, 2000; Moln’ar et al., 2002; Mercier et al., 2002; Medina et al., 2008). Increased evapotranspiration could further expand the impact of the increase in temperatures by leading to escalation of summer aridity, potential harms on forests and agricultural lands, detrimental effects on fruit trees and vineyards, and amplified need for irrigation. Therefore, large lake such as Lake Burdur shrank, and shallow lakes such as Lake Aksehir and Lake Eber vanished in Turkey (Kantarci, 2005).
Remote sensing of the water basins became increasingly important over the recent decades due to global climate change and worsening ecology (Ekercin, 2007). Remote sensing has been used to investigate the impacts of climate change studies for many years at local and global scale (Dube, 2001; Nagai et al., 2007; Piwowar and Ledrew, 2002). This technology has application, for instance, in identifying and quantifying areas experiencing drought which is one of the most important hydrological and agricultural problems in the world. In practice, spatial and temporal comparisons can be made for specific locations and/or for certain months/seasons using multi-temporal satellite data (Pozdnyakov et al., 2005).
The widespread use of internet in last 20 years and developments in web technologies, have brought the concept of web mash-ups. The term mash-up originally comes from pop music, where people seamlessly combine music from one song with the vocal track from another—thereby mashing them together to create something new. However, a mash-up, in web development, is a web page, or web application, that uses content from more than one source to create a single new service displayed in a single graphical interface. The term implies easy, fast integration, frequently using open application programming interfaces (API) and data sources to produce enriched results that were not necessarily the original reason for producing the raw source data (Wikipedia, 2016).
These developments are also affected web maps which were published as static maps in early stages of web and evolved
them into map mash-ups which combine data from different sources in a single web application and provide effective geographic information system (GIS) functionality. In this study sharing analysis results with map mash-ups for investigating change of Salt Lake surface area and to examine meteorological drought by using precipitation data in Konya Closed Basin have been focused on. To achieve this goal, the concept of map mash-ups is intended to be the key element.
This study was conducted in Salt Lake Basin that located in the Central Anatolia, Turkey. Multi-temporal and multispectral image series were acquired by Landsat TM/ETM/OLI. 10 meteorological stations data has been used to examine meteorological drought The main goals of this study are;
•To investigate the change of Salt Lake surface area by evaluating water reserve changes through multi-temporal Landsat imagery collected from 2000 to 2014.
•To examine meteorological drought by using precipitation data •To share of the data obtained from this study via a Map Mash-Ups application
2. METHODOLOGY
2.1 Study Area
Salt Lake is the second largest lake in Turkey, only smaller than Lake Van, lying at an elevation of 905 m as a tectonic lake. The lake is very shallow (about 40 centimeters), especially during dry summer months when the water evaporates in huge quantities leaving a tick crust of salt on the surface up to 30 centimeters. This salt is extracted, processed, refined and sold in the local market, thus making this the biggest industry for small towns' economy in the area. It's not only the largest salt lake of Turkey but one of the largest and most saline in the world as well. The density of the water is 1.225 gr/cm3 and salinity is 32.4%. The lake has no outlet, and only few surface streams feed it. Annual rainfall in the surrounding area is as low as 300 mm (AAT, 2007).
2.2 Satellite Remote Sensing Data and Processing
The extraction of coastlines of lakes is mapped by using optical and radar imagery in several ways. Namely supervised classification, unsupervised classification, visual interpretation, density slicing, manual onscreen digitizing approaches are used for water body identification in wetland areas with single-band and multi-band, multi-temporal and multi-sensor imagery (Dechka et al., 2002; Parmuchi et al., 2002; Wang et al,2002; Hung et al., 2008; Durduran., 2010; Yıldırım et al., 2011).
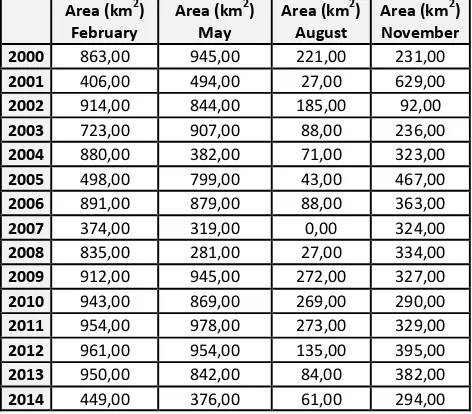
In this study, a total of 71 multi-temporal and multi spectral image series were used as remotely sensed data source for the period of 2000-2014. All satellite imagery was acquired from Landsat satellites. Twenty-four images were obtained from the Landsat Thematic Mapper (TM), forty-two images were obtained from the Landsat Enhanced Thematic Mapper plus (ETM+) and five images were obtained from Landsat 8 Operational Land Imager (OLI). Each image, used to calculate Water surface area, presents the condition of either February, May, August or November months of each year to specify seasonal and temporal variations of Salt Lake’s surface area.
2.2.1 Normalised Difference Water Index (NDWI): Coastline changes and multi-temporal water reserve changes were obtained for Salt Lake using geometrically corrected satellite images. At this process, The normalised difference water index (NDWI) was used to mapped water surface area of Salt lake. NDWI is derived using similar principles to the Normalised Difference Vegetation Index (NDVI). (McFeeters, 1996). The NDWI index is calculated as following equation:
)
The selection of these wavelengths maximises the reflectance properties of water. That is: Maximise the typical reflectance of water features by using green wavelengths, Minimise the low reflectance of NIR by water features and Maximise the high reflectance of NIR by terrestrial vegetation and soil features. The outcomes from this equation are water features that have positive values while soil and terrestrial vegetation have zero or negative values (McFeeters, 1996).
The vegetation suppressed and the open water features enhanced in NDWI. Thus, Land cover and water body has become quite distinguishable. In this study, manual onscreen digitizing was preferred to extraction water body mapping. Principal reason for preferring of manual digitization process on screen is 42 of 56 images used in this study acquired after The Landsat ETM+ Scan Line Corrector (SLC) failed, causing the scanning pattern to exhibit wedge-shaped scan- to-scan gaps, On 31 May 2003. The size of the study area and having linear boundaries of Salt Lake additionally is other reasons for preferring this method. The exact dates of satellite images and related water surface areas are given in Table 1.
Area (km
Table 1. Salt Lake Surface Area for each month and year.
2.2.2 Normalised Difference Vegetation Index (NDVI): The Normalised Difference Vegetation Index (NDVI) is an index which measures this difference, providing a measure of vegetation density and condition. It is influenced by the fractional cover of the ground by vegetation, the vegetation density and the vegetation greenness. It indicates the photosynthetic capacity of the land surface cover.
The NDVI is calculated as a ratio between measured reflectivity in the red and near infrared portions of the electromagnetic spectrum. These two spectral bands are chosen because they are most affected by the absorption of chlorophyll in leafy green vegetation and by the density of green vegetation on the surface. Also, in red and near-infrared bands, the contrast between vegetation and soil is at a maximum (Cai et al. 2010). The NDVI transformation is computed as the ratio of the measured intensities in the red (�) and near infrared (NIR) spectral bands using the following equation: associated with greeness and intensity of vegetation. Bare soil and rocks values are close to zero, while clouds, rain, and snow have negative values. In this study, images of 2003, 2007, 2011 were used to produce NDVI. Visualization of vegetation indexes and comparison between each other was performed via Maps Mash-Ups application
2.3 Standardized Precipitation Index (SPI)
The Standardized Precipitation Index (SPI) is a widely used index to characterize meteorological drought on a range of timescales (e.g. 3, 6,12, or 24 month). On short timescales, the SPI is closely related to soil moisture, while at longer timescales, the SPI can be related to groundwater and reservoir storage.
SPI is obtained by normalized with dividing the difference between the amount of rain (Xi ), which is in an i station and a selected time period, and average rainfall (Xiavr ) with standard deviation (σ) , and the following equation describes given equation 3. This equation is used in the case of rain data having normal distribution. In the opposite condition, from this distribution z-values (SPI) are determined the possibility that correspond to observations which corresponds to the standard normal distribution as series by adapting a normal distribution.
(3)
As a result of making normal the SPI values, both wet and dry periods will be represented in the same way within the selected time period. Drought assessment which made in consideration of values of SPI, It is defined as the dry periods when the index is consistently negative. According to this method, drought categories of violence are given in Table 2. (McKee et al. 1993). 10 meteorological stations data has been used to generate (SPI) from 1975 to 2011 on 12-month periods.
SPI values Drought Category chicagocrime.org and housingmaps.com, Google launched the Google Maps API in June 2005 to allow developers to integrate Google Maps into their websites. Using Google Maps API service users have the ability to embed Google Map to their own web pages and this base map supports some useful overlay support to external data (i.e. kml, ground overlay, Fusion Tables Layer). Another useful option with Google Maps is the support of using Fusion Tables as layers on the map application. Google Fusion Tables is a cloud-based service for data management and integration. Fusion Tables enables users to upload tabular data files (spreadsheets, CSV, KML), currently up to 100MB. The system provides several ways of visualizing the data (i.e., charts, maps, and timelines) and the ability to filter and aggregate the data. It supports the integration of data from multiple sources by performing joins across tables that may belong to different users. Users can keep the data private, share it with a select set of collaborators, or make it public and thus crawlable by search engines. The service launched in June 2009. By the Fusion Tables API, users can copy a small fragment of JavaScript code into the source of their page (e.g., a blog entry) and the visualization will be displayed there, with a live link to the data. That is, when the data is updated in Fusion Tables, the visualization is also updated (Gonzales et al., 2010). It provides client-side visualizations through the Google Visualization API. This is a well-established framework for visualizing data on the client. The visualization is rendered on the browser using JavaScript or Flash, and the data required by the visualization is obtained from a data source interface.
The Salt Lake surface area files were produced as KML (Keyhole Markup Language) files and added on the map as Fusion Tables layers. Also the NDVI images were produced as raster image files and added on the map by using Google Map’s ground overlay function.
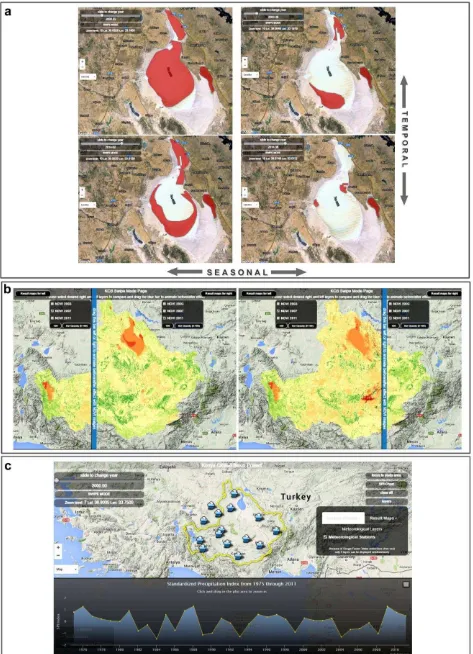
For producing SPI charts, another useful API for drawing interactive charts, HighCharts API, were used. The interface of the mash-up application consist of two main pages. The first page includes time slider for investigate lake surface area change by different dates (Figure 1a) and interactive SPI Chart (Figure 1c). The second page includes a swipe tool for compare two different map interactively (Figure 1b).
3. CONCLUSION
Water surface change in Salt Lake was explored using a total of 56 multitemporal Landsat imagery collected on almost the same days in different months and years. Remotely sensed image processing presented water and salt covered areas of Salt Lake surface for February, May, August and November months from 2000 to 2014.
Landsat TM/ETM+/OLI satellite images show the dramatic seasonal and temporal surface changes in Salt Lake for years 2000, 2003, 2007, 2011 and 2014. Similarly, SPI value indicate that in drought periods for these years. When analyzed meteorological data from 2000 precipitation decreased in the basin and the lake water surface area has shrunk year by year.
When all surface area in Salt Lake (from 2000 to 2014) are compared, 2007,2008,2005 and 2003 respectively are
Figure 1 (a) Loading different salt lake surface area files by time using time slider (b) Comparing different NDVI images by using swipe mode tool (c) Interactive SPI chart produced by High Charts API
Determined as the most arid years. The lake vanished in August 2007 and The Salt Lake has come to the brink of drought during the summer months in recent years particularly due to increasing drought, uncontrolled underground water usage, climatic fluctuations, and especially precipitation.
We proposed a web mash-up application in order to visualize the results and share on the web. Effective visualization tools are very important for evaluating and analyze the time-dependent data. By the concept of mash-ups emerged recently it is possible to use content from more than one source to create a single new service displayed in a single graphical interface. Mash-ups are created by using APIs that are online libraries and functions provided by vendors. Map mash-ups are the most popular among the others. APIs can be defined as a gate to access Web services. Nowadays the Internet users from amateurs to experts can create powerful maps only using these APIS and the services. Taking account of these developments, we have used free of charge services published on the Web for the creation of interactive interfaces that use a GIS infrastructure. For this purpose the leader mapping service Google Maps has been used. There are a lot of mapping service on the web, but neither of them offers a free API with free content, as Google Maps does. Thus, in this study Google Map API with its powerful tools were used.
REFERENCES
AAT., 2007. All About Turkey. Available at: http://www.allaboutturkey.com/tuzlake.htm, (Accessed 27.11.2015).
Birkett, C.M., 2000 Synergistic remote sensing of Lake Chad: variability of basin inundation. Remote Sensing Enviroment. 72,218–236.
Dechka, J.A., Franklin, S.E., Watmough, M.D., Bennett, R.P., Ingstrup, D.W., 2002. Classification of wetland habitat and vegetation communities using multitemporal IKONOS imagery in southern Saskatchewan. Canadian Journal of Remote Sensing 28,679–685.
Du, Y., Cai, S., Zhang, X., Zhao, Y., 2001. Interpretation of the Environmental Change of Dongting Lake, Middle Reach of Yangtze river, China, by 210pb Measurement and Satellite Image Analysis. Geomorphology. 41,171–181.
Dube, O.P., 2001. Remote sensing, climate change and land-use impacts in semi-arid lands of Southern Africa. In Geoscience and Remote Sensing Symposium, 2001. IGARSS'01. IEEE 2001 International (Vol. 6, pp. 2686-2688). IEEE.
Durduran, S.S., 2010. Coastline change assessment on water reservoirs located in the Konya Basin Area, Turkey, using multitemporal landsat imagery. Environmental monitoring and assessment, 164(1-4), pp.453-461.
Ekercin, S., 2007. Water quality retrievals from high resolution ikonos multispectral imagery: A case study in Istanbul, Turkey. Water, Air, and Soil Pollution. 183, 239–251.
Cai, G., Du, M. and Liu, Y., 2010. Regional drought monitoring and analyzing using MODIS data—a case study in Yunnan
Province. In Computer and Computing Technologies in Agriculture IV (pp. 243-251). Springer Berlin Heidelberg.
Gonzalez, H., Halevy, A., Jensen, C.S., Langen, A., Madhavan, J., Shapley, R. and Shen, W., 2010, June. Google fusion tables: data management, integration and collaboration in the cloud. In Proceedings of the 1st ACM symposium on Cloud computing (pp. 175-180). ACM.
Hui, F., Xu, B., Huang, H., Yu, Q. and Gong, P., 2008. Modelling spatial‐temporal change of Poyang Lake using multitemporal Landsat imagery. International Journal of Remote Sensing, 29(20), pp.5767-5784.
Kantarci, M. D., 2005. Forest ecosystems knowledge, Istanbul University published book no: 4594. Forest Faculty published no: 488, Istanbul (in Turkish).
Kiage, L.M., Liu, K.B., Walker, N.D., Lam, N. and Huh, O.K., 2007. Recent land‐cover/use change associated with land degradation in the Lake Baringo catchment, Kenya, East Africa: evidence from Landsat TM and ETM+. International Journal of Remote Sensing, 28(19), pp.4285-4309.
Legesse, D. and Ayenew, T., 2006. Effect of improper water and land resource utilization on the central Main Ethiopian Rift lakes. Quaternary international, 148(1), pp.8-18.
McFeeters, S.K., 1996. The use of the Normalized Difference Water Index (NDWI) in the delineation of open water features. International journal of remote sensing, 17(7), pp.1425-1432.
McKee, T.B., Doesken, N.J. and Kleist, J., 1993, January. The relationship of drought frequency and duration to time scales. In Proceedings of the 8th Conference on Applied Climatology (Vol. 17, No. 22, pp. 179-183). Boston, MA, USA: American Meteorological Society.
Medina, C.E., Gomez-Enri, J., Alonso, J.J. and Villares, P., 2008. Water level fluctuations derived from ENVISAT Radar Altimeter (RA-2) and in-situ measurements in a subtropical waterbody: Lake Izabal (Guatemala). Remote Sensing of Environment, 112(9), pp.3604-3617.
Mercier, F., Cazenave, A. and Maheu, C., 2002. Interannual lake level fluctuations (1993–1999) in Africa from Topex/Poseidon: connections with ocean–atmosphere interactions over the Indian Ocean. Global and Planetary Change, 32(2), pp.141-163.
Moln’ar, P., Burlando, P., Ruf, W., 2002. Integrated catchment assessment of riverine landscape dynamics. Aquat Sci. 64,129– 140.
Nagai, S., Ichii, K. and Morimoto, H., 2007. Interannual variations in vegetation activities and climate variability caused by ENSO in tropical rainforests. International Journal of Remote Sensing, 28(6), pp.1285-1297.
Orhan, O,. Ekercin, E,. Dadaser-Celik, F,. 2014. Use of Landsat Land Surface Temperature and Vegetation Indices for
Monitoring Drought in the Salt Lake Basin Area, Turkey. The Scientific World Journal. 2014, 11.
Parmuchi, M.G., Karszenbaum, H. and Kandus, P., 2002. Mapping wetlands using multi-temporal RADARSAT-1 data and a decision-based classifier. Canadian Journal of Remote Sensing, 28(2), pp.175-186.
Penny, D. and Kealhofer, L., 2005. Microfossil evidence of land-use intensification in north Thailand. Journal of Archaeological Science, 32(1), pp.69-82.
Piwowar, J.M. and LeDrew, E.F., 2002. ARMA time series modelling of remote sensing imagery: a new approach for climate change studies. International Journal of Remote Sensing, 23(24), pp.5225-5248.
Pozdnyakov, D., Korosov, A., Grassl, H. and Pettersson, L., 2005. An advanced algorithm for operational retrieval of water quality from satellite data in the visible. International Journal of Remote Sensing, 26(12), pp.2669-2687.
Vianna, M.L., Cabral, A.P. and Gherardi, D.F.M., 1993. TM-Landsat imagery applied to the study of the impact of global climate change on a tropical coastal environment during the last deglaciation. International Journal of Remote Sensing, 14(16), pp.2971-2983.
Wang, Y., Colby, J.D. and Mulcahy, K.A., 2002. An efficient method for mapping flood extent in a coastal floodplain using Landsat TM and DEM data. International Journal of Remote Sensing, 23(18), pp.3681-3696.
Wikipedia 2016, Mashup_(web_application_hybrid), http://en.wikipedia.org/wiki/Mashup_(web_application_hybrid) (23 Apr. 2016)
Yan, P., Shi, P., Gao, S., Chen, L., Zhang, X. and Bai, L., 2002. 137 Cs dating of lacustrine sediments and human impacts on Dalian Lake, Qinghai Province, China. Catena, 47(2), pp.91-99.
Yıldırım, Ü., Erdoğan, S. and Uysal, M., 2011. Changes in the Coastline and Water Level of the Akşehir and Eber Lakes Between 1975 and 2009. Water resources management, 25(3), pp.941-962.