BEESMART – A CROWDSOURCING PROJECT WITH SMARTPHONES
E. Gülch a, S. Uddin a, B. Willi b
a Hochschule für Technik Stuttgart, Schellingstr 24, 70174 Stuttgart, Germany - (eberhard.guelch, shohrab.uddin)@hft-stuttgart.de b Imkerverein Waiblingen e.V. Waiblingen, Germany - [email protected]
ICWG III/VII
KEY WORDS: Flower recognition, Honey Yield Web Portal, Geo-localization, UAV
ABSTRACT:
The project Beesmart aims at the derivation of a geolocation yield catalogue for honey bees by using a crowd-sourcing approach with the help of smartphones. A central issue are thus the design of an application (App2bee) for smartphones and the design of a software for flower recognition, which uses sensor information of the smart phone and information about blooming times to recognize and localise flowers. The implemented flower recognition is based on the approach “Minimal-bag-of-visual-Words“. A classification accuracy of about 60-70% can be reached, which is of course affected by the big variety of flowers, by the way on how images are taken and how the image quality and resolution actually are. The classification results are further improved by applying a-priori a simple manual segmentation on the touch screen to put the focus in the image on the flower in question. The design and the functionality of the App2Bee are presented followed by details on the communication, database and Web-portal components. In a second part of the project the classification of larger areas of flowers important for honey bees are investigate using a fixed-wing UAV system with two different types of cameras, a RGB digital camera and a NIR digital camera. It is certainly not possible to recognize single flowers, but it could be shown, that larger fields of the same flower, like e.g. Red Clover, can be classified with this approach. With the data available it was also possible to classify bare-ground, roads, low pasture, high pasture as well as mixed pasture. For the high pasture it was possible to automatically identify clusters of flowers, like Yarrow.
1. INTRODUCTION 1.1 Background
The nutrition possibilities offered by our more and more industrialized landscape with a decreasing diversity of flowers are not anymore sufficient for honey bees, the 3rd most important production animal in the world. There is in many areas of Europe from March to October not enough nutrition in form of nectar and/or pollen available, the honey yield and the number of honey bees are thus declining. This indirectly affects the food production for many production plants and in addition the bio-diversity of plants and animals is decreasing. The determination of honey yield for honey bees in a certain area is not possible for non-experts. There are so far no tools available to monitor bee flowers just by walking by. The project Beesmart offers a solution by developing a crowd-sourcing application for bee-flower recognition combined with a professional UAV (Unmanned Aerial Vehicle) based monitoring of larger areas, thus closing a gap between close-range acquisition by users and standard aerial or satellite imagery. A side effect is to make humans, farmers, beekeepers, organisations and communities aware of the need to support bees and stimulate to additionally plant bee flowers in own gardens, in public areas or along field boundaries in rural landscapes.
1.2 Objective
The project Beesmart aims at the derivation of a geolocation yield catalogue for honey bees by using a crowd-sourcing approach with the help of smartphones and an acquisition of larger areas using UAVs (Unmanned Aerial Vehicles). State ministries and organizations, the University Hohenheim and beekeeper organizations are partners in this project. In Gülch (2014, 2015), Gülch et al. (2015) and Willi (2015) various stages of the project with focus on different topics were
reported. This paper gives an overview on the results reached in the project.
1.2.1 Smartphone App. The first major goal is to derive the type of local flowers, being an important nutrition source for honey bees, from smartphone images and to identify their geographical location to be able to estimate potential honey yield in a specific area.
A central issue are thus the design of an application (App2bee) for smartphones (cf. Figure 1) and the design of a flower-recognition software, which uses sensor information of the smartphone to recognize and localise flowers. Due to the still limited computation power of many (older) smartphones the idea is to establish a client-server solution to send sensor information and meta information (image, GPS data and amount, area etc.) to an App-server, where the flower recognition is done, and the flower information and localization is presented to the user at the smartphone. As a specific feature of this approach, the blooming times of flowers are used to support the flower recognition process.
Figure 1: Basic design of the Beesmart crowdsourcing application to determine bee flowers and to localize nutrition
areas (Source: Bernhard & Boris Willi).
The second major issue is to use the uploaded information in the Web-portal (www.trachtfliessband.de) for detailed analysis of honey yield in a certain geographic area.
Remark: The project is financed by the State of Baden-Württemberg and the user interface is currently only available in German. Therefore many screen shots do present the current status in German language.
1.2.2 UAV Acquisition of large areas with bee flowers. In a second part of the project the classification of meadows or fields with flowers important for honey bees are investigated using a fixed-wing UAV system with two different types of cameras.
2. METHODS APPLIED
For the project different components, ranging from image processing and classification for smartphone images and UAV-imagery have to be developed or adapted. A smartphone application has to be designed to acquire data, communicate and visualize results on the smartphone. There is a need for the development of database, communication and Web-portal components for user interaction, visualisation and analysis for the collected data.
2.1 Flower recognition with smartphone
The flower recognition with smartphone combines elements of digital image processing, classification, communication with the database and integration of user and sensor information.
The essential elements are given in Figure 2. The user initializes the images, supports by a manual segmentation on the touch screen. The flower recognition is activated by sending the flower image to a server, where classification tools, supported by information from the flower database (www.trachtfliessband.de), determine the flower species automatically. The user adds meta-information and the GNSS (currently GPS) sensor is responsible for the positioning, which can also be gained through cell information of the mobile network or by giving an address.
Figure 2: Flower recognition elements with smartphone (Source: Boris Willi).
2.1.1 Algorithms for flower recognition. To allow an automated recognition of flowers sophisticated classification tools are to be developed to relate images of flowers to known flower classes using various image features. Flowers are very diverse even in one class and their shape can easily be deformed as flowers are not necessarily static objects.
This problem has been tackled by (Nilsback & Zissermann, 2008). Their developed algorithm is the basis of the flower recognition in the project Beesmart. The used algorithm
“Minimal bag-of-visual-words“ (Minimal Bag-of-Visual-Words-Image-Classifier, 2014) is designed for automated text recognition. Typical words of a certain discipline are stored in a vector. When searching further text documents of this discipline the occurrence typical words is compared with the vector contents. This idea is transferred to the classification of imagery, by searching typical features (instead of words) in the image for an image classification.
Essential components for the implementation are feature extraction methods in the images and a suitable classification method. In our project we add a new component, the blooming time of flower species, currently for the larger vicinity (e.g. 50 km radius) of Stuttgart, Germany.
When implementing the flower recognition, the appearance of flowers plays a very decisive role. As shown by Stitz (Stitz, 2014) there are flowers, that do not differ very much as e.g. coltsfoot (Figure 3) but others differ a lot in colour and shape as European columbine (Figure 4). But also how the flower is photographed, the image quality and how the background differs will influence the flower classification.
Figure 3: Coltsfoot (Source: Stitz, 2014).
Figure 4: European columbine (Source: Stitz, 2014).
The flower recognition computes probabilities from three independent probabilities (i) p(ci | I), (ii) p(ci | d) and (iii) p (ci) as shown in Figure 5.
Figure 5: Flower recognition probabilities parts (i) to (iii) with ci class of the plant (at the beginning 35) classes, the image I
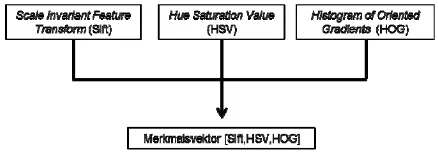
and the day of acquisition d (Source: Oswald Aldrian). Part (i) comprises the analysis of the image. It is based on the learning algorithm “Bag of Visual Words“. In each training image (cf. Figure 6) features are extracted and in a defined number of Visual Words quantised using the K-Means algorithm. The quantised features are organised in a dictionary. Thus each flower species will get a characteristic distribution of “Visual Words” (p(ci | I )). Figure 7 shows the three elements, which are used to define the feature vector: Scale Invariant Feature Transform (SIFT), Hue Saturation Value (HSV) and Histogram of Oriented Gradients (HOG) which are used to derive key points, colour information and gradient information
from the RGB imagery of the smartphone. The same features are extracted in the smartphone image.
Figure 6: Some training images of Sweet Violet (Source: Stitz, 2014).
Figure 7: Elements of the feature vector (Merkmalsvektor) (Source: Stitz, 2014).
In part (ii) the probabilities p(ci | d) for each flower are computed based on the day of image acquisition and the typical blooming period for that species derived from the flower database (www.trachtfliessband.de). The main blooming time (Hauptblütezeit) gets maximal probability (cf. Figure 8), a month before and after this time range the probability is reduced. For all other months the probability is set to a very low level to eventually include climatic anomalies, which exceptionally extend the main blooming period.
Figure 8: Probabilities for blooming periods (Blütezeit) depending on the date (month) (Source: Oswald Aldrian).
Part (iii) of the flower recognition relates the existence of a flower related to the other flowers (p (ci)). The classification is based on training data from internet images (e.g. Figure 6). For each flower species feature vectors are trained. For the classification of a new image from the smartphone at the beginning two standard algorithms Nearest Neighbour (KNN) und Support Vector Machine (SVM) were used and the applicability tested to finally decide on the most suitable one. The result of the classification of a new image is a list of all probabilities of all flowers that are implemented in the App. The highest 10 scores are presented to the user, who has to make the final decision which is supported by further data base images and additional meta-information from the database of flowers.
2.1.2 Functionality of the smartphone application “App2bee”. A core component is the development of a smartphone application “App2bee” under the operating system Android, which is used by most smartphones. An important aspect is the close link to the flower recognition software on the App-server and the Web-portal with the database.
One important component is the user registration with the possibility to upload images, but also to update the database content on the client side at the smartphone. The geo-localisation is implemented based on GPS, WLAN, mobile Network or manual input of an address. The communication network is used to send data to the flower recognition server as well as to store results in the Web-portal. The recording of digital images and their transfer to the App-server has to handle a great variety of smartphones, with cameras with quite different number of pixels. Images from cameras with very high resolution and a high number of pixels have to be reduced to allow an acceptable time for the flower recognition. A manual interaction has to be integrated in the GUI to e.g. register, segment an image, input and selection of meta-data or confirmation of decisions, etc. App2bee allows as the major output to visualize the found locations of flowers using Google-Maps.
2.1.3 Web-portal and App-server functionalities. A second core component of the project is the development of a Web-portal and App-server (flower recognition server) functionalities under the lead and with major contributions by Boris Willi and Jan-Erik Engels.
Figure 9: Web-portal and App-server (Source: Boris Willi). In Figure 9 an overview on the communication between crowdsourcing based on App2bee, the App-Server and the Web-Portal server is given. For the App-server the commercial 1&1 Server was used to implement the flower recognition software and to check how such a server system can be used later for a final product. The access to this server is possible by App2bee only. The Web-portal server, developed and maintained by Boris Willi, contains the flower data base, the honey yield radar and allows database queries and analyses. This server can be accessed by users with a standard Web-Browser.
2.1.4 Analysis of UAV Imagery. The analysis of UAV imagery was performed with commercially available digital photogrammetric software tools (Trimble Geospatial, Pieeneering OY) and remote sensing software tools (Erdas Imagine and eCognition).
3. IMPLEMENTATION ASPECTS 3.1 Plant catalogue
The plant catalogue comprises 100 bee-flowers collected in a digital database (www.trachtfliessband.de). Figure 10 shows a tabular view for a number of bee-flowers (Bienenweidepflanzen), sorted for blooming months (Blühmonate) and including honey yield information based on e.g. nectar or pollen but also typical locations where those flowers do occur. With an extensive selection of filter function very specific information can be derived from this database, like yearly nectar or pollen distribution.
This catalogue is a core element for the flower recognition with App2bee. The first tests were done with 12 bee-flowers, but during the project it was extended to 50 bee-flowers integrated in App2bee. The information provided for App2bee and further analysis includes reference images from different view-points, height of plants, blooming time etc.
Figure 10: Plant catalogue in the Web-portal (www.trachtfliessband.de) – Screenshot of a tabular view with
bee-flowers sorted for month of blooming (Source: Bernhard and Boris Willi).
App2bee offers a function to make an application to the Web-portal (www.trachtfliessband.de) to extend the plant catalogue which would be handled by the administrator of the Web-portal. A highly automated workflow had been established and successfully tested for the extension from 43 to 50 flowers for App2bee. It comprises the semi-automatic selection of training images from the internet, an automated classification of the training images, a manual generation of the weights of blooming months for a specific flower and the manual integration in the App2bee version.
3.2 GUI of App2bee
In a first step the user registers to the Web-portal, or the user initializes a new account. This allows the user to update database contents on the actual smartphone version available. Then the functionality of App2bee is available. App2bee checks if localization tools of the smartphone (GPS, network, WLAN) are activated. If this is not the case, the user is guided to select and activate a localisation tool.
The main menu (Figure 11) offers three main options Flower recognition (“Erkennung”), showing honey yield geo-information (“Radar”) additional functions (“Mehr”). The flower recognition is further divided in three options, starting the standard procedure of taking an image of a flower on site, the continuation of an already started recognition process, which has been interrupted by the user or to use images from the internal memory. App2bee checks for each image acquisition the availability of an Internet-/Intranet connection. If no network is available it can be activated or the app stores the images locally in the memory of the smartphone and the flower recognition process can be started later using e.g. a WLAN network.
Figure 11: Main Menu. The user selects Flower recognition (“Erkennung”), shows honey yield geo-information (“Radar”) or uses additional functions (“Mehr”) (Source: Shohrab Uddin).
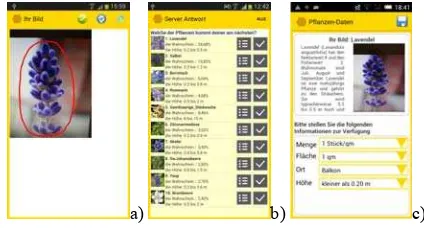
In Figure 12a) an image is shown. The user manually segments the plant by describing a polygon (red) on the touchscreen to increase the recognition probability. In Figure 12b) a sorted list of probabilities of the flower recognition is shown. The highest score is reached by lavender (Lavendel) with a probability of 25% followed by sage (Salbei) with a probability of 14%.
a) b) c)
Figure 12: a) Manal segmentation by describing a polygon around the plant on the touch screen, b) App-server response with a sorted list of probabilities, c) Provision of meta-data by
manual selection or input (Source: Shohrab Uddin). The user can request information for each flower and make a final decision. After that the user is prompted to provide meta-information about amount, area in square meters, type of location and the height of the flower (cf. Figure 12c). The GPS location is automatically added, if available.
a) b) Figure 13: Localised bee-flowers. a) My treasures (Meine Schätze), b) All treasures (Alle Schätze) (Source: Shohrab
Uddin).
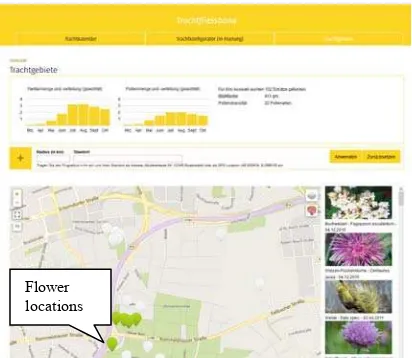
With the “Radar” function the visualization of the geolocation is activated. In Figure 13 it is shown how localised bee-flowers are presented using Google Maps. With the option “My treasures” all own found plants are presented. Small thumbnail images are indicating the location and circles of 1 km, 2,5km and 5km show usual flight areas of honey bees. With the option “All treasures“ the collected plants of all users are presented (Figure 13b).
With the additional functions (“Mehr“) the user can e.g. find a list of all flowers integrated in the current version of the app. The user can select further detailed meta-information on each flower, make an application to extend the flower catalogue or simply access the Web-portal itself via a web-browser.
3.3 Design and development of the Web-portal
A core component is the Web-portal (www.trachtfliessband.de) with the plant catalogue and the functionalities needed for this project. User friendly functionalities for user account and user registration have been implemented to take care of the protection of data privacy. The Web-portal allows in addition the updating of the smartphone application with newest database contents.
A user friendly GUI design for presentation of data and analysis and query functions was essential. A major issue was the design and implementation of the internal structure of the databases involved. The data provided by the smartphone application has to be received and prepared for presentation including the meta-data information. The generation of the honey yield radar image is a core module as shown already in the previous chapter 3.2. For the cartographic presentation a structure was designed, that can use Google Maps, but also other services, as e.g. Bing Maps or Open Street Map. An area clustering of found flowers for positioning and presentation of area respectively quantity information was developed with many options for the user.
As a final function the honey yield can be estimated based on the user provided “All treasures” data. The database allows for a simulation of honey yield at a specific location using the derived amount of nectar and pollen estimated from the user collected flower types and locations. An example in Figure 14 estimates a honey yield in a certain area with 102 found flowers on 411 m2 and with a very high pollen diversity, which is very good for the honey bees. An important aspect is also the good pollen and nectar distribution.
Figure 14: Automatic estimation of honey yield in a selected area with different flower locations (Source: Boris Willi).
3.4 Analysis of UAV imagery for flower recognition The honey yield radar can be extended by using UAV platforms to monitor larger areas at reasonable costs. It is, however, not possible to safely identify single flowers, but the intention is to identify regions where bee-flowers occur and to estimate their extension. The basis is the acquisition of digital imagery with a RGB camera and a NIR (Near Infrared) camera to be able to use classical classification algorithms for multi-spectral imagery. In co-operation with the company GerMAP GmbH four test flights with different fixed-wing UAVs and 2 RGB cameras and a NIR camera have been conducted in July 2014 (Chaudry, 2015). The flying height above ground was about 100m resulting in a ground sampling distance of about 2-3cm. At that time the simultaneous usage of 2 cameras on one platform was not possible. The RGB and NIR flights were thus conducted right after each other at a short time span. The resulting images had to be registered and then analysed as multispectral imagery. For this purpose aerial triangulation, DTM/DSM generation and orthophoto/orthomosaic processing was applied. In Figure 15 the RGB-Orthomosaic, and a patch are presented. In Figure 16 the NIR-Orthomosaic is shown.
a)
b) Figure 15: a) RGB-Orthomosaic in the test area Welzheim, b)
patch with field of red clover (arrow) (Source: Flight and AT GerMAP GmbH, Orthomosaic Pieneering OY). Flower
locations
Figure 16: NIR-Orthomosaic image patch with field of red clover (arrow) (Source: Flight and AT GerMAP GmbH,
Orthomosaic Pieneering OY).
The classification was based on the registered RGB and NIR orthomosaic images and on the digital surface model and the digital terrain model using eCognition software. Figure 17 presents the result of a supervised classification. The classes “Bare soil“, “Mixed Soil & Vegetation”, “Road“ and “Vegetation“ could be estimated. The class “Vegetation” was divided in the sub-classes “Ground Object, “Low pasture”, “High Pasture” and “Trees&Bushes”. The result is very promising. Especially as in the class “High Pasture” the occurrence of “Yarrow” could be confirmed, in the class “Low Pasture” a whole field of “Red Clover” was correctly found. This shows that with UAV imagery including NIR data, larger flower areas can be classified and could complement the crowd sourcing acquisition with smartphones on the ground.
Figure 17: UAV imagery – result of classification (Source. Chaudry, 2015).
4. TESTS AND ANALYSIS RESULTS
Many tests were conducted to estimate the potential of all major components implemented in this project and to improve the algorithms. Here a selection of tests and their analysis is given.
4.1 Optimization of flower recognition algorithm
In (Stitz, 2014) the two classification methods (Support Vector Machine (SVM) and K-Nearest Neighbour (KNN) were evaluated to allow for a most efficient recognition of flowers. The influences of the feature vector elements using Scale-invariant Feature Transform (SIFT), Colour-Feature (HSV) and Histogram of Oriented Gradients (HOG) were investigated and the weighting optimized. From the experiments conducted the Support Vector Machine (SVM) algorithm showed overall advantages and was thus chosen.
4.2 Investigations on classification and segmentation In (Miller, 2014) the learning behaviour of the classification algorithm was thoroughly investigated. By varying the number
of training images the maximal score for a flower was estimated. For this purpose for the first 12 flowers all together 2640 training images were manually selected from the internet. In Figure 18 is shown that for the flower classes 7 to 12 the best results were reached with 100 to 120 training images. However, still 10-40% wrong classifications occur.
Figure 18: Average wrong classifications in % of each class for different number N of training images (classes 7-12) for original
images (Source: Miller, 2014).
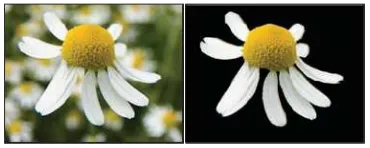
To improve the classification results a manual segmentation of the images was applied beforehand. The manual segmentation was done very carefully for 100 flowers, by manually eliminating the background so that only the flower is visible (cf. Figure 19). This shall show the potential, even for a real application a manual segmentation on the touch screen would actually be much coarser, but much quicker. A reliable automatic segmentation of images due to the extremely diverse background information in real images is currently not feasible.
The results shown in Figure 20 proof, that the additional segmentation is very positive for the classification results and can substantially increase the recognition rate.
Figure 19: Original (left) and segmented (right) image of chamomile (Source: Miller, 2014).
For each flower class the average accuracy of all tests conducted with original images could be calculated in relation to the number of training images. In Figure 21 (classes 7 to 12) the average accuracy of each class with different training images is graphically presented. The background of images, the quality of images, the size of the flower and the image acquisition angle are important factors, which influence the classification accuracy. From the curves presented in Figure 21 it can safely be stated, that a higher number of training images provides better results, but with more than 100 training images not much more gain can be reached.
Figure 20: Average wrong classifications in % of each class for different number N of training images (classes 7 to 12) for
segmented images (Source: Miller, 2014).
Figure 21: Average test accuracy in % of the flowers of classes 7 to 12 depending on the number of training images (Source:
Miller, 2014).
There are rather big differences between different flowers visible. With chamomile (Kamille) an accuracy of 64% can be reached with only 10 training images, but with Rose of Sharon (Johanniskraut) only about 3%. Even with 120 training images there are still quite big differences visible. With nasturtium (Kapuzinerkresse) a value of 89% can be reached, which is very good. With globeflower (Trollblume) the value is 52% and thus still rather poor. The overall result is of course depending on the correctness, quality and the content of the training images. But also the different features of a flower, like shape, colour and texture are very decisive. If one of them is rather dominant, then this flower can more easily be recognized. Certain flowers can easily be mixed up. As shown in Figure 22 a Globe-flower (right) can often be classified as Rose of Sharon (left). Both flowers have the colour yellow and the shape of the Globe-flower is sometimes very similar to the Rose of Sharon. In these cases the user finally has to decide.
Figure 22: Globe-flower (right) is often classified as Rose of Sharon (left) (Source: Miller, 2014).
The average curve for the classification accuracy of all tests with all investigated 12 flowers shows a clearly declining behaviour of the learning (Figure 23). A higher number of training images increases the classification accuracy, but the gradient of improvement is declining. From up to 10 training
images the gain is 4.5, between 10 and 20 images 1.0, between 20 and 50 images about 0.2, between 50 and 75 images 0.08, between 75 and 100 images 0.17 und between 100 and 120 images only 0.13. By adding more training images the gain is marginal.
Figure 23: Average test accuracy of all 12 flowers in relation to the number of training images (Source: Miller, 2014).
4.3 Influences of image quality
The effect of image quality was intensively tested. By test users with different smartphone cameras a great variety of image quality was obtained. As expected a good to very good image quality allows a quite good score under the top 10. A bad image quality results in bad classification results. In the example of a sun-flower in Figure 24a) the bad quality results in sun-flower only on 9th position in the result, whereas a good image quality allows a 1st. position (Figure 24b)). Also images, which would be still sufficient for visual interpretation, do not allow the automatic recognition score under the top 10.
a) b)
Figure 24: Influence of the image quality on the classification results, a) Sun-flower with poor image quality, b) Sun-Flower
with good image quality (Source: Shohrab Uddin).
4.4 Diversity of smartphones
The great variety of used smartphones has partly provided problems in programming, implementation or usage. The smartphone and image quality are very decisive as shown above. Variations in image size and display size could be taken care of by the app and by functions of the Web-portal. Some of the smartphones have problems with the GPS quality and the rather long time needed to get a GPS signal, which disturbed some users, even it was not part of the app itself. At the end of the project the usage of Android 3.0 and higher was tested and even Android 5.1 was working well.
4.5 Influences of image acquisition
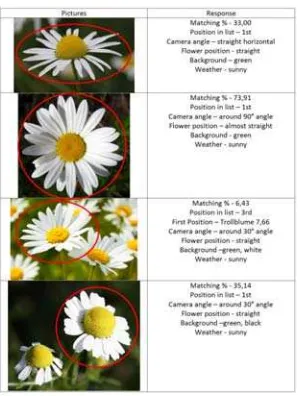
A great variety of image acquisition angle, flower shape, background, sunshine or clouds in combination with the influences of the manual segmentation and the image quality are investigated.
Figure 25: Image acquisition examples and possible effects (Source: Shohrab Uddin).
The examples in Figure 25 show that the type of image acquisition really influences the results. The 2nd image from top leads to Position 1 in the score list and 74% probability for chamomile. The 3rd image from top results only in 3rd rank and only 6% probability.
4.6 Crowdsourcing
The crowdsourcing part was intended to be tested by volunteer users with and without background in biology, ranging from biology students and assistants to bee keepers and general public. However the external feedback was rather limited, despite the more than registered test-users who volunteered at conferences and exhibitions or on reactions to newspaper and radio information about the project. We offered a telephone and email hotline, but it was seldom used. In the first test round the users did not have to register to the Web-portal, which offered privacy and allowed a testing of the functionality only, but did not allow to upload the data for the general public in the Web-portal. As a consequence the developing team could not monitor the test-users´ results. In the 2nd test phase the registration was compulsory, but for privacy reasons some users did not want to register to the portal, not even anonymously. The surprisingly slow GPS initialisation phase of some smartphones in combination with poor satellite distribution hindered many users to continue the testing in the field. The app was therefore adapted to offer support in this case, but this was only realized in the final project phase and could only be tested with a limited number of test-users.
In summary, much higher efforts must be put in the crowd-sourcing initialization. It certainly would have more attractive if a final product version of the app would have been available in Google Play Store, but in the project only a prototype could be developed. During the project with the help of students and project partners still most of the planned tests could be conducted, but not in full extent.
5. CONCLUSIONS
The primary goal of the project is a personalized acquisition of flowers, which is realized and implemented in a stable prototype version (App2bee Version 2.2.). The very dynamic development of sensor technologies for mobile devices could be combined with technics of image analysis and remote sensing to reach a
high quality of flower recognition. The full functionality of a Web-portal was implemented, tested and is ready also for larger user groups. Using an impressive number of visualization and analysis functions the acquired flowers can be evaluated in cameras larger flower areas can be described and introduced in the honey yield database.
The next stage is now the development of a production version of the app, called App2bee+ for Google Play Store and Baden-Württemberg in the framework “Innovative Projekte“. The support by all project partners, all students and test users is gratefully acknowledged. Mr. Boris Willi and Mr. Jan-Erik Engels supported the project by implementing all Web-Portal functions and realizing the server and database connections.
REFERENCES
Chaudry, Z.u.A., 2015. Detection and Mapping of Flower Species using Remote Sensing with the aid of UAV for Apiculture Planning. Master-Thesis HFT Stuttgart.
Gülch, E.,2014. Digitale Photogrammetrie: Von Bienen zu Robotern. In: Tagungsband 10. Vermessungsingenieurtag/3.
Geodätentag, HFT Stuttgart, 7. November.
Gülch, E., Uddin, S., Willi, B., Keller, S., 2015. Beesmart-Beehappy. In: Publikationen der Deutschen Gesellschaft für Photogrammetrie, Fernerkundung und Geoinformation
(DGPF) e.V. Band 24 421 S., Hamburg, Hrsg.: Thomas P.
Kersten, ISSN 0942-2870.
Gülch, E., 2015. Beesmart- Blüten aus der Crowd. In:
Tagungsband 150 Jahre Vermessung, HFT Stuttgart, 20.
November.
Miller, S., 2014. Empirische Untersuchungen zur Optimierung der Trainingsdaten zur Klassifikation von Bienenweidepflanze für segmentierte und nicht-segmentierte Bilder. Bachelor-Thesis HFT Stuttgart. Indian Conference on Computer Vision, Graphics & Image
Processing, December.
Stitz, J., 2014. Empirische Untersuchungen und Optimierung von Algorithmen zur Klassifikation von Blühpflanzen als Basis einer Smartphone-App. Bachelor-Thesis, HFT Stuttgart. Willi, B., 2015. App2bee - Bienen und Smartphones.
Bienenpflege, Mai.