AUTOMATIC SEA BIRD DETECTION FROM HIGH RESOLUTION AERIAL IMAGERY
S. Mader a, G.J. Grenzdörffer a a
Rostock University, Chair for Geodesy and Geoinformatics, J.-v.-Liebig Weg 6, Rostock, Germany, {steffen.mader,goerres.grenzdoerffer}@uni-rostock.de
Commission VII, WG VII/4
KEY WORDS: Marine birds, Aerial survey, Remote sensing, Image analysis, Graph cuts
ABSTRACT:
Great efforts are presently taken in the scientific community to develop computerized and (fully) automated image processing methods allowing for an efficient and automatic monitoring of sea birds and marine mammals in ever-growing amounts of aerial imagery. Currently the major part of the processing, however, is still conducted by especially trained professionals, visually examining the images and detecting and classifying the requested subjects. This is a very tedious task, particularly when the rate of void images regularly exceeds the mark of 90%. In the content of this contribution we will present our work aiming to support the processing of aerial images by modern methods from the field of image processing. We will especially focus on the combination of local, region-based feature detection and piecewise global image segmentation for automatic detection of different sea bird species. Large image dimensions resulting from the use of medium and large-format digital cameras in aerial surveys inhibit the applicability of image processing methods based on global operations. In order to efficiently handle those image sizes and to nevertheless take advantage of globally operating segmentation algorithms, we will describe the combined usage of a simple performant feature detector based on local operations on the original image with a complex global segmentation algorithm operating on extracted sub-images. The resulting exact segmentation of possible candidates then serves as a basis for the determination of feature vectors for subsequent elimination of false candidates and for classification tasks.
1. INTRODUCTION
Since fall 2013, the monitoring of sea birds and marine mammals in the context of environmental impact studies concerning offshore wind energy plants within the German exclusive economic zone (EEZ) is relying solely on digital aerial imaging. According to the presently effective standard StUK4 (BSH, 2013), a minimum area of 200 km² of sea surface must be digitally captured for a single survey. Given a ground sampling distance (GSD) in the range of 2 - 3 centimetres and a photographic coverage of 200-300% (due to overlap) this results in large amounts of image data. Great efforts are presently taken in the community to develop computerized image processing methods allowing an efficient and automatic processing of the ever-growing amounts of aerial imagery. Currently the major part of the processing, however, is still conducted by especially trained professionals, visually examining the images and detecting and classifying the covered subjects. This is a very tedious task, particularly when the rate of void images regularly exceeds the mark of 90%.
First reports on automated analysis of aerial imagery for wildlife census reach back as far as into the 1980‘s. Overviews on the early Approaches are given in (Allen, 1991) and (Groom, 2013). The utilized approaches range from simple thresholding (Bajzak, 1990) and template matching (Allen, 1991) up to the simulated annealing of spatial models (namely Markov point processes; Descamps, 2011) and Object-based Image Analysis (OBIA) (Groom, 2013). Yet, a fully automated process is far out of sight. Manual processing of the aerial images is still the standard process. Digital image processing, however, is capable to ease and accelerate the manual process by pre-filtering the estimation). A certain amount of over-estimation (false positives), however, is tolerable, since the candidates are yet to be examined and classified by a professional. In order to achieve a reduction of the effort, it is mandatory that the effort to examine the false positive candidates is lower than the effort to visually examine the complete aerial image data.
In contrast to the monitoring of breeding colonies or gathering areas, where surveys cover relatively small, determinate areas with high abundance densities (e.g. Allen, 1991; Descamps, 2011, Grenzdörffer, 2013), marine bird ecology assessments related to the impacts of offshore windfarms on marine life cover large geographical extents, where bird densities are usually very low (see above). In addition, the standards for a minimum flight altitude of 400m and a minimum survey area of 200km² (10% of 2000km²) given by the standard StUK4 (BSH, 2013) in combination with the limited daylight and weather conditions during the birds resting season in the winter months lead to a very limited number of days with acceptable or even perfect flight conditions. Whereas images captured at good conditions show a homogeneous dark water surface which makes it easy to detect individual bird subjects, survey flights conducted in acceptable but non-perfect conditions often result in image data where the dark water surface is cluttered with artefacts from sun glitter, wave crests and disturbed water. These artefacts usually manifest themselves as bright or white, saturated image areas in different sizes and of irregular shape which massively complicate the processing (both, manually as well as automated) of those images. Often, these artefacts show strong similarities to positive signal patterns (real birds) making their definite classification impossible. This is especially true for species with a white or bright plumage (Common Eider, Long-tailed duck, Herring gull, etc.). The aim of our studies was therefore to investigate how the signal patterns caused by The International Archives of the Photogrammetry, Remote Sensing and Spatial Information Sciences, Volume XLI-B7, 2016
water/light phenomena could be discriminated from signal patterns caused by birds.
In the content of this contribution we will present our work aiming to support the processing of aerial images by modern methods from the field of image processing. We will especially focus on the combination of local, region-based feature detection and piecewise global image segmentation for automatic detection of different sea bird species. The presented paper contributes to the following scientific topics:
- The efficient processing of large-format aerial images by a combination of locally operating blob-detector and a globally operating, complex segmentation method. - The performance of a thresholding approach on feature
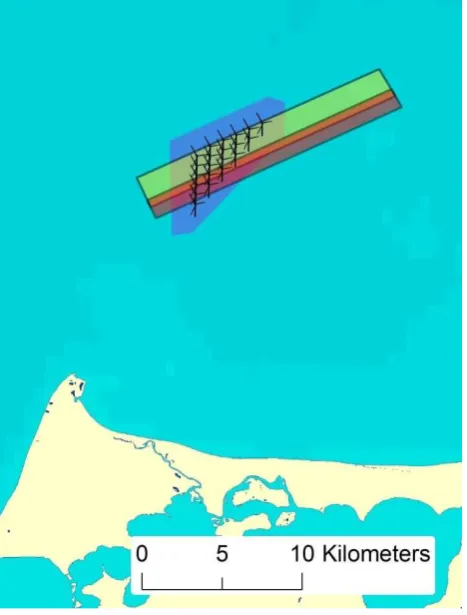
vectors for the discrimination between bright-plumed sea birds and water/light phenomena. and with different camera systems. The survey area is located in the southern Baltic Sea, north of the Zingst peninsula covering parts of the offshore wind farm ‘Baltic I’ and was divided in two overlapping bands of about 17km length and 2km width. Figure 1 shows the location and extend of the survey area. Both bands of the survey overlap for about 700m (red-coloured in Figure 1) and were designed to cover the complete area with aerial imagery.
The northern band (green-coloured in Figure 1) was captured using a Vexcel UltraCam Eagle equipped with a 260Mpx sensor and a 100.5 mm lens at a ground sampling distance (GSD) of approx. 0.03m. Endlap was fixed to 60%, sidelap was 20%. The survey was operated by Weser Airborne Sensing (WAS) and the number of captured image frames amounts to 547 frames. The southern band of the survey (red-brown coloured in Figure 1) was captured using a medium-format camera of type PhaseOne iXA180 with sensor size of 80 Mpx and equipped with a Schneider-Kreuznach lens with f=110mm. Operated at an altitude of 420m above sea level, this resulted in a GSD of approx. 0.02m. The achievable endlap was limited by the minimum flight speed and the storage capabilities of the camera and resulted at about 30%. The sidelap was again fixed to 20%. The southern part of the aerial survey resulted in a set of 1460 image frames.
The meteorological conditions were characterized by changing sun light due to partial clouds, low sun, and a sea state of 3-4 and fresh winds. The sea waves showed breaking crests, frequent whitecaps and disturbed waters. In directions towards the sun the waves frequently showed sun glitter.
The processing of the medium-format raw images was carried out using the CaptureOne software provided by the camera manufacturer. Processing steps involved Bayer demosaicing, reduction of color-depth from 16-bit to 8-bit, vignetting correction, correction of chromatic aberration and histogram adjustments. The processed image frames were geo-referenced and stored as 24-bit sRGB TIFF. The processing of the northern image set was done by WAS.
Figure 1. The survey area near offshore wind farm Baltic I in the southern Baltic sea.
In the following we explain the image analysis approaches we user for the automated detection of sea birds.
3. METHODOLOGY
Large image dimensions resulting from the use of medium and large-format digital cameras in aerial surveys inhibit the applicability of complex image processing methods based on global operations, i.e. methods that require accessing the entire extent of an image in order to calculate their results. This is mostly due to the fact that their complexity leads to inacceptable computation times and that these methods require to produce intermediate data that easily multiply the size of the input data. Aside from this, the relatively small size of the targeted features stands in sharp contrast (~1:1.000.000) to the large coverage area of a single image. In order to efficiently handle those image sizes and to nevertheless take advantage of globally operating segmentation algorithms, we will describe the combined usage of a simple performant feature detector (MSER) based on local operations on the original image with a complex global segmentation (graph cuts) operating on extracted sub-images. The resulting exact segmentation of possible candidates then serves as a basis for the determination of feature vectors for subsequent elimination of false candidates and for classification tasks. The classification accuracy depends on the sea bird species and the overall weather conditions during the image survey. Thereby sun glitter and glare as well as the sea state influence the accuracy and completeness of the method. The International Archives of the Photogrammetry, Remote Sensing and Spatial Information Sciences, Volume XLI-B7, 2016
Figure 2. Top row: candidate sub-images extracted from the original data; center row: segmentation results; bottom row: gradient magnitudes. Columns a+b: Common Eider;
columns c+d: sun glitter. (Matas, 2002). It is working on panchromatic images, applying an ordered series of thresholds to the image data, which results in a sequence of binarizations. Regions appearing in the binarizations indicate local extrema in the image data. These regions are tracked over the course of the sequence until they merge with or dissolve in other regions and their stability according to their size and location is assessed using a heuristic approach. Regions that prove stable over a certain range of binarizations are termed ‘maximally stable’ and form the result of the method. The detected MSER’s are given as pixel arrays masking the actual regions. In our approach we use the OpenCV implementation of the MSER method, which is a variant improved for computational complexity (Nistér, 2008). As such it is able to efficiently handle the image sizes occurring in digital aerial imaging.
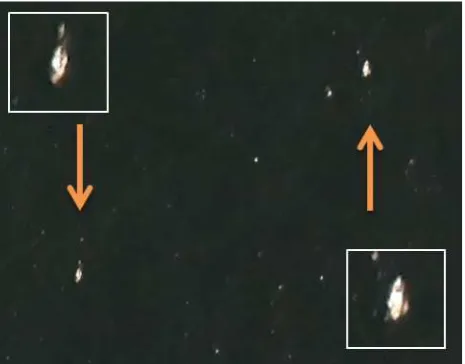
Figure 3. Bird or phenomenon? Wave crests and sun glitter often are indistinguishable from real birds.
Starting from a MSER mask, we calculate its center of gravity and use the center point to extract a sub-image of 64 x 64 pixels.
The size of the sub-image is chosen large enough to contain a bird surrounded by a sufficient portion of background water surface, but small enough to separate a single bird and allow the efficient computation of the subsequent segmentation step. In the segmentation step we use a method based on graph cuts (Boykov, 2001). Graph cuts are a very complex, globally operating segmentation method. Its application to images of the above dimensions would consume large amounts of computational power and memory, and thus, was largely inefficient. The original method (Boykov, 2001) obtained binary segmentations (i.e. foreground/background) based on supervised selection of characteristic foreground or background pixels, respectively. More recent advances of the method introduce unsupervised segmentation of multiple regions (Kim, 2008). Here, the binary segmentation is sufficient, since in our application case the sea birds usually can be strictly separated by choosing a sufficiently small image section. In our implementation we use the unsupervised graph cut method from (Kim, 2008) based on a formulation of the energy function from the same publication and an implementation of the MinCut-MaxFlow algorithm from (Boykov, 2001). The implemented energy function yields good results and obtains a number of parameters to control the quality of the segmentation result.
Once the candidate regions are determined, a sequence of morphological operations is applied to the region masks in order to eliminate very small breakaway sections or merge sub-regions. Subsequently, a feature vector is calculated for each of the regions. The feature vector is calculated over the original image data as well as over the normalized gradient magnitude of the image data. The calculated features include area, convexity, circularity, variance, standard deviation and homogeneity. Finally, the feature vector is filtered by individually thresholding the feature values using a heuristic approach.
4. RESULTS
4.1 Filtering accuracy
The image sets from the two parallel surveys were captured under acceptable, but non-perfect conditions. Low sun, changing light and rough seastate induced large amounts of artefacts within the images, such as sun-glitter, wave crest, and disturbed water. Due to the similarity of the image patterns of those artifacts and white- or bright-plumed bird species, the differentiation between those patterns poses a particular challenge. Even for the well-trained eyes of the professional image analysts a number of cases were hard to decide (see Figure 3).
According to the assumptions made in (Groom, 2013), the goal for automated detection of sea birds is to filter the localisations of possible bird candidates in a way, that under-estimation should be avoided or minimized, while over-estimation might be accepted to a certain degree. Thus, our task was to find a set of filter criterions and parameters to balance a trade-off between those two antagonal requirements. Since image representations of individual birds show large variations between different species gender and pose, we focused our study on the detection of male Common Eider (Somatera mollisima). For other species and gender, appropriate filter and filter parameter might be investigated and their results be combined for visual inspection.
For our study we chose about 20 images from each of the two surveys that were known to contain localisations of Common Eider. We applied the automated detection as described above The International Archives of the Photogrammetry, Remote Sensing and Spatial Information Sciences, Volume XLI-B7, 2016
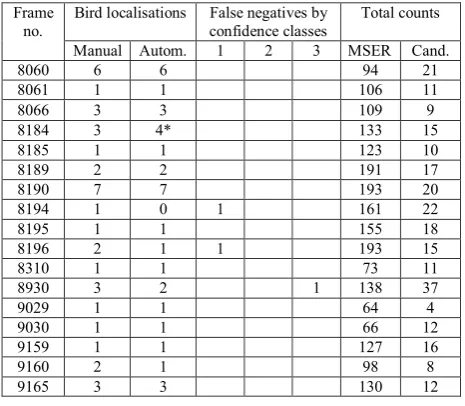
Frame
Table 1. Filter accuracy assessment for the image set taken from the southern part of the parallel survey. Highest confidence class is denoted by 1, columns 7 and 8 list the total counts of
detected MSERs, and the filtered candidates
and compared its results with the results of the visual examination. The results are listed in tables 1 and 2. There we further distinguish the localisations by three confidence classes determined during visual examination and classification. In the table we also list the numbers of positives in relation to the total number of candidates detected in the MSER step.
Table 2. Filter accuracy assessment for the image set taken from the northern part of the parallel survey. Due to the coarser GSD of 0.03m, the discriminatory power of the filter is much lower than in the set with GSD of 0.02m. This is manifested by higher
counts of candidates and higher under-estimation rates.
The results demonstrate that the requirement of a minimized false negative rate can be achieved only at the cost of a substantial rate of false alarms. In the case of the southern survey area the false alarm rate reached a value of 10 false alarms on one found bird. In spite of that, some of the birds still were not found by the proposed method. Common reasons that caused those false negative results were unusual poses (e.g. grooming) or backwash due to chasing or landing.
4.2 Impact of GSD on Filter accuracy
The results of our study show quite significant differences in the accuracy of the automated detection between the both parts of the survey. The listing in table 2 shows a substantially more critical performance on filter accuracy. Whereas for the southern band of the survey, the false negative rate calculates to 1/13th, the northern band yields a false negative rate of more than 1/4th. Furthermore, the average ratio of false positives to real birds for the northern part exceeds 350, while amounts to below 10 for the southern survey area.
Since both camera flights took place on the same day within the range of about an hour, we can eliminate the meteorological conditions as a reason. A fact that may have partly influenced the observed disparity is the use of different camera systems in both surveys. The most reasonable cause, however, is the difference in the ground resolution of the images. The filtering of the candidates relies on a number of local and contextual features calculated from the individual segmentation of the candidate. With decreasing spatial resolution of the images, the discriminatory resolution of those features also decreases. This causes contours and patterns of varying complexity to dissolve into uniform shapes and indistinguishable flat regions.
5. ACKNOWLEDGEMENTS Institute Carnegie Mellon University, Pittsburgh, PA, USA.
Bajzak, D., Piatt, J.F., 1990. Computer-aided procedure for counting waterfowl on aerial photographs. Wildlife Society Bulletin, 18(2), pp. 125–129.
Boykov, Y., Veksler, O., Zabih, R., 2001. Fast approximate energy minimization via graph cuts. In: IEEE Trans. Pattern
Anal. Machine Intell. 23 (11), pp. 1222–1239.
BSH (Bundesamt für Seeschifffahrt und Hydrographie), 2013. Standard. Investigation of the Impacts of Offshore Wind Turbines on the Marine Environment (StUK4). http://www.bsh.de/en/Products/Books/Standard/7003eng.pdf (15 Apr. 2016).
Descamps, S., Béchet, A., Descombes, X., Arnaud, A., Zerubia, J., 2011. An automatic counter for aerial images of aggregations of large birds. Bird Study 58(3), pp. 302–308.
Grenzdörffer, G. (2013): UAS-based automatic bird count of a common gull colony.- IAPRS, Vol. XL-1/W2, UAV-g2013.
Groom, G., Stjernholm, M., Nielsen, R.D., Fleetwood, A., Petersen, I.K., 2013. Remote sensing image data and automated analysis to describe marine bird distributions and abundances,
Ecological Informatics, Volume 14, pp. 2-8.
Kim, J.-S., Hong, K.-S., 2008. A new graph cut-based multiple active contour algorithm without initial contours and seed points. Machine Vision and Applications, 19(3), pp. 181–193.
Matas, J., Chum, O., Urban, M., Pajdla. T., 2002. Robust wide baseline stereo from maximally stable extremal regions. In:
Proc. of British Machine Vision Conference, pp. 384–396.
Nistér, D., Stewénius, H., 2008. Linear Time Maximally Stable Extremal Regions. In: Computer Vision – ECCV 2008, Vol. 5303 (Lecture notes in computer science), Springer Berlin Heidelberg, pp. 183–196.