COLLABORATIVE WEB GIS PLATFORM FOR SYSTEMATIC EXPLORATION OF LAKE
GENEVA
Yosef Akhtman, Lorenzo Martelletti, Olga Grandjean and Ulrich Lemmin
TOPO Lab, ´Ecole Polytechnique F´ed´erale de Lausanne, Switzerland {yosef.akhtman,lorenzo.martelletti,olga.grandjean,ulrich.lemmin}@epfl.ch
topo.epfl.ch,www.elemo.ch
KEY WORDS:GIS, Mapping, Surveying, Visualisation, Navigation, Web-GIS, Database, Underwater
ABSTRACT:
We have developed and deployed a Web-based GIS data management framework, which facilitates an effective and highly structured search, retrieval and visualisation of multi-modal scientific data, as well as its subsequent dissemination in multiple and standardised forms beneficial for both the research partners involved in the project and the general public. In the context of the long term objectives of the
´
El´emo project, the developed methodology may be utilised for automated and systematic collection of the multifaceted scientific data and with the goal of assembling a comprehensive database encompassing all aspects of currently planned and future scientific investigations.
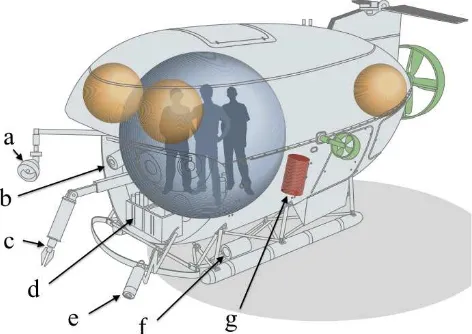
Figure 1: General structure of MIR 1 and 2 submersibles (Adopted fromwww.elemo.ch). Examples of onboard instrumentation in-cluded (a) projectors; (b) 3D camera system; (c) articulated arm; (d) sample storage; (e) mobile camera; (f) water sampling device; (g) particle filters.
1 INTRODUCTION
The ´El´emo project (www.elemo.ch) constitutes a multidisciplinary collaborative research initiative involving two deep-water submersibles operated by the P.P. Shirshov Institute of Oceanography of the Rus-sian Academy of Science, as well as ten leading Swiss and inter-national research institutions. The objectives of the project include a comprehensive “source-to-sink” investigation of the multiple as-pects of the lake Geneva environmental functioning encompassing its geology, chemistry, biology and physics.
The initial stage of the ´El´emo project involved a period of intensive field work during the summer months of 2011, including the total of 30 diving days for each of the two MIR submersibles operated by the Russian collaborators. In the course of the initial field campaign a wide range of state-of-the-art scientific equipment attached to the MIR submersibles illustrated in Figure 1 has been utilised to col-lect a comprehensive array of environmental, navigational, as well
as dense sensory data. The instruments employed included among others multiple extended CTD analysers, two advanced in-situ mass spectrometers1and a voltammetric profiling system2. Both discrete and continuous sampling of water and lake-floor sediment has been carried out using a Rosette sampling system2, Niskin bottles, par-ticle filters3, as well as a sediment coring system4. The physical properties of the lake-floor sediment have been probed using Nim-rod and cone penetrometers4. The navigation and environmental data has been further acquired using a 3D imaging system, Doppler velocity logs and a multi-beam sonar5, as well as an onboard artic-ulated camera and an augmented GPS-based navigation system6.
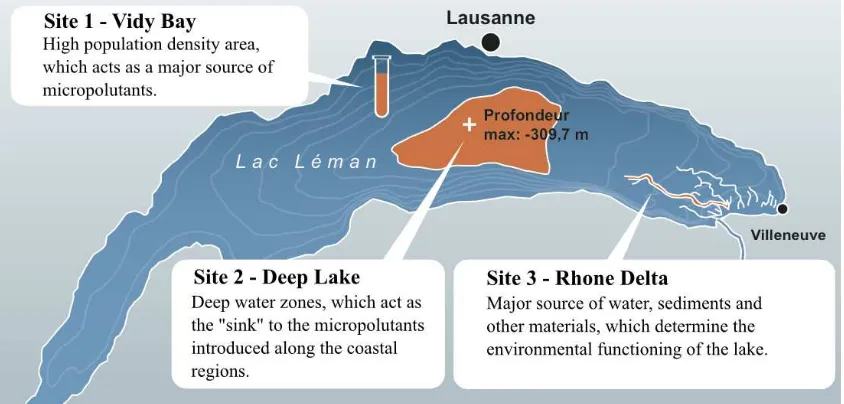
The initial field campaign has been carried around the three repre-sentative regions of Lake Geneva, as illustrated in Figure 2. Specif-ically, theVidy bayrepresents a densely populated coastal zone, where the outfall of the Lausanne sewage treatment plant brings water masses and pollutants into the lake. TheRhone river delta constitutes a major source of water and sediment. While, thedeep water zonein the centre of the lake act as the “sink” for the vari-ous materials and pollutants that introduced into the lake along its coastal line.
From a scientific point of view, the project presents a unique oppor-tunity for cross-disciplinary and inter-institutional collaboration. This opportunity, however, is accompanied by a major challenge associ-ated with the development of both effective and efficient methodol-ogy for management, sharing and dissemination of diverse, multi-modal, and often poorly synchronised scientific data(Dragicevic, 2004, Fu and Sun, 2010).
The rest of this paper is constructed as follows. In Section 2 we dis-cuss three major stages in the data organisation process. Namely, we detail the consolidation of the master navigation data in Sec-tion 2.1, we describe the process of indexing of the video logs in
1
Richard Camilli, et al., Woods Hole Oceanographic Institution, USA.
2
Marylou Tercier-Waeber, Jean-Luc Loizeau, et al., University of Geneva, Switzerland.
3
Samuel Aray, et al., EPFL.
4
Ulrich Lemmin and Nicolas Le Dantec, EPFL, Switzerland.
5
Oscar Pizaro et al., University of Sydney, Australia; Angelos Mallios, University of Gerona, Spain.
6
Anatoly Sagalevich, Shirshov Institute of Oceanography, Russia.
Figure 2: Three representative regions surveyed in the course of the initial stage of the ´El´emo project (Adopted fromwww.elemo.ch).
Figure 3: Underwater trajectories of the MIR submersibles in the Bay of Vidy obtained from the raw position data recorded by the surface navigation system (Courtesy of J.-L. Loizeau).
Section 2.2 and finally outline the structure of the developed Web-GIS platform in Section 2.4 before drawing our conclusions in Sec-tion 3.
2 METHODOLOGY 2.1 Master navigation data
The first major challenge that we have encountered in our effort to construct a comprehensive representation of the collected data was the reliable estimation of the underwater trajectories of the sub-mersibles Mir 1 and 2 throughout the course of the field campaign. Evidently, an accurate position is essential for the correct interpre-tation of the collected environmental data. Unfortunately, the po-sition information recorded by the submarines’ navigation system was largely unreliable and had many obvious outliers. The raw
Figure 4: A typical frame from the video log enquired by the main camera of the MIR submersible in the course of the field campaign in lake Geneva.
trajectories of the submersibles in the Vidy bay are portrayed in Figure 3.
Correspondingly, the navigation data describing the 3D trajectories of the MIR submersibles has been comprehensively analysed and consolidated. In particular, the reliability of the navigation data has been improved significantly by the means of suppression of instan-taneous outliers, as well as by non-linear interpolation of missing GNSS data. The submersible navigation trajectories become par-ticularly informative in the presence of high-resolution bathymetry data, which is presently available for a considerable portion of the dive campaign area.
2.2 Indexing of the video logs
(a)
(b)
Figure 5: Digits (a) and masks (b) utilised by the digit classification algorithm.
(26 from Mir 1 and 24 from Mir 2) for a total of 27h43 of video recording. We processed each disk image using Apple’s iMovie software, extracting 50 audio/video quicktime files. These clips were eventually uploaded to YouTube, as we considered it the most practical and sophisticated tool to stream video for the project’s scope. In order to build the time reference string of each clip, given the length of video data, we decided to use an Optical Character Recognition (OCR) approach over video frames. Quicktime files were further processed to obtain image sequences with a single frame-per-second frequency, concordant with navigation data fre-quency. OCR was carried out with a C++ script using OpenCV 2.3 (Open Source Computer Vision), a library of programming func-tions for real time computer vision. The idea was to estimate each video frame digit by comparing it with a known set of digits in the form of an optimisation problem. Initially, from selected images we created a sample set of 10 greyscale digits and a corresponding set of 10 black and white digit masks (resp. pixel values 0 and 1). Through code routines we compared the image’s region of inter-est corresponding to each one of the 6 time digits (hh:mm:ss) with the sample set of digits and masks portrayed in Figure 5 (a) and (b) respectively. Subsequently, the estimate of each desired digit is obtained as a solution of an optimisation problem, which may be formulated as follows
where◦denotes the element-wise, or Hadamard product,R
rep-resents a 24x26 pixel region of interest extracted from the origi-nal image exemplified in Figure 4, whileDiandMiare thei-th
digit and mask, as depicted in Figure 5 (a) and (b) respectively. The minimum result provides a numeric digit corresponding to the one represented in the original video frame. Our code output a csv (Comma Separated Values) file containing a numeric sequence of digital timestamps. Due to strong changes in video frames back-ground, which was varying from pale yellow to dark green, the results were affected by errors. Hence, we used Excel and ad-hoc algorithms to check for errors and correct them. The final result was a time indexing string, like the one reported in the following example, composed by substrings of initial time, ending time and total seconds from the beginning, one for each continuous video sequence inside a single mission video.
The resultant video index string is illustrated in Table 2 lines 33–36. Using this strings, we were finally able to index videos on YouTube and to synchronise them exactly with navigation data.
2.3 Existing WebGIS solutions
While developing our project-specific WebGIS platform, we have carried out a comprehensive review of the Web-based GIS solutions currently available. Specifically, the key features we were looking for were the capability to manage dense time and space 4D datasets, to be collaborative (i.e. multiple users being able to input and man-age datasets), to be client-side, and to be easily configurable and
extensible. In particular, the application frameworks that have been identified as potentially satisfying our requirements are MapFish (www.mapfish.org), Geomajas (www.geomajas.org), and Map-Bender (www.mapbender.org).
MapFish – A project of the Open Source Geospatial Foundation (OSGeo Foundation,www.osgeo.org) that provides an open source web mapping development framework that extends the Pylons Python development framework with geospatial-specific functionality and uses the Javascript libraries OpenLayers, ExtJS and GeoExt.
Geomajas – An open source webGIS framework with client-server interaction that allows powerful displaying and editing of spatial data. Like MapFish, Geomajas is an OSGeo project and is compli-ant with Open Geospatial Consortium (OGC,www.opengeospatial. org) standards (WMS, WFS, GML). Geomajas has a strong server side focus where processing, styling, filtering, caching, etc. of geospatial data happens, while a powerful data management and visualisation interface is available for multiple users through their browsers. Moreover, similarly to our approach, Geomajas is de-signed with a plugin structure that allows extensibility and adapt-ability.
MapBender – A back office software and client framework for spatial data infrastructures. The software is implemented in PHP, JavaScript and XML and dual licensed under GNU GPL and Sim-plified BSD license. It provides a data model and web based in-terfaces for displaying, navigating and querying OGC compliant map services. There are many installations of MapBender, espe-cially in Germany, some of which utilise the features of the jQuery JavaScript framework (jquery.com) and displaying data profiles coupled with planar mapping.
Subsequently, we have concluded that although theoretically possi-ble, none of the considered frameworks has demonstrated the capa-bility to facilitate the visualisation of synchronised multi-dimensional data. Our dataset, like many coming from marine and aerial sur-veys, has strong need of space and time data correlation. We have therefor decided to develop a simple but powerful system to cater for our specific usage scenario. Furthermore, we could not identify an application which would provide a client-side implementation. Client browser are becoming extremely powerful, as well as HTML and Javascript languages. Moreover this feature allows a webGIS system to run on mobile devices and be configured as mobileGIS during surveying. We have concluded that this is a core requirement in our field of application.
2.4 Developed Web-GIS platform
Correspondingly, the following items(a)–(k)provide a brief de-scription of the Data Browser visual components as indicated in Figure 6(a–k), respectively.
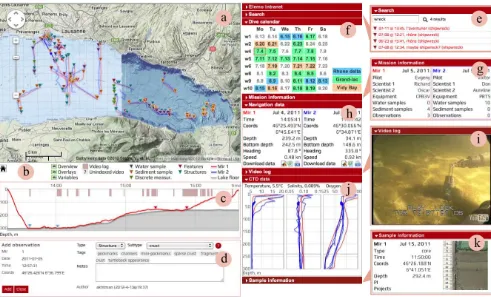
a) 2D Map – The central part of the data browser interface por-trayed in Figure 6 is constituted by a Google maps-based interac-tive map, which provides the geographical references of the col-lected data. Google maps API was used to support the spatial part of the survey’s visualisation and cover the first two dimensions of the data. The underwater trajectories of both submersibles Mir 1 and 2 are colour-coded in accordance to their correspondence to ei-ther of the submersibles (red and blue for Mir 1 and 2 respectively). When a trajectory is selected in the interface, related information is displayed in the other parts of the page to display the most com-plete overview possible of different aspects of this dive. Discrete samples and observations are indicated with markers, as described in the Visualisation Key portrayed in in Figure 6(b).
Figure 6: Main components of the current implementation of the ´El´emo project data browser: (a) Google maps-based two-dimensional interactive map; (b) visualisation key; (c) timeline with depth versus time dive profile; (d) observation entry/editing form; (e) search form; (f) field campaign dive calendar; (g) mission information (h) navigation data; (i) video log; (j) master environmental variables (temperature, salinity and oxygen); (k) sample information (sediment analysis courtesy of Corella et al.).
b) Visualisation Key – A detailed description of the various visu-alisation elements across multiple visuvisu-alisation panels, in particular the main map and the timeline chart depicted in Figure 6(a) and (c), respectively. In addition to its role of legend, the key panel facil-itates control over visibility of the various visualisation elements. For example, the visibility of the various types of discrete sample may be toggled by clicking on the corresponding marker in the leg-end. Furthermore, the legend provides a mechanism for controlling the visibility of map overlays and sensor data visualisations. For instance, the map depicted in Figure 6(b) combines the basic Ter-rain model of Google maps with the bathymetry data provided by the SwissTopo National map (www.swisstopo.ch), as well as the high-resolution bathymetry data (Sastre et al. 2010).
c) Timeline – A profile of depth of each submarine during the time span of the dive was created to complete the missing dimension of mapping. This plot depicts the depth of the submarine and of the bottom of the lake versus the time sequence of the dive. Sam-ples and observations are also represented. Synchronisation mech-anisms link real-time hovering of these plots with others visualisa-tions tools (like position of the map and sensory data).
d) Observation form – The observation form facilitates collabo-rative analysis of the available video logs. In particular the clas-sification of the various types of lake floor morphology is carried out by systematic review of the video logs and the periodic addi-tion of observaaddi-tions whenever a reliable classificaaddi-tion of the floor morphology on the video frame is possible.
e) Search – The search feature consists of a simple input text box and a retractable area for text results. The search is performed
through observations and samples, but it is theoretically extendible to any kind of data. The use of jQuery library and the logic of in-cluding searchable visualisable data in the Document Object Model (DOM) structure, allow for a markedly fast live search. Once search results are retrieved, the plugin displays the results on the list and triggers a highlight event. The map feature listens to this event and displays only markers related to search results. As an example of the usage of this feature, the Search plugin allows to visualise in one click all instances where wrecks have been observed in videos, indicating the dive trajectory and displaying wrecks on the map of the Lake.
f) Calendar – The calendar component depicted in Figure 6(e) fa-cilitates fast access to data collected on any particular date of the field campaign. The dates on the calendar are colour-coded accord-ing to one of the three regions of interest (Vidy Bay, Rhone Delta and Deep Lake) investigated on that day. The calendar component provides an intuitive interaction with the browser through standard mouse gestures, such as “mouseover” and “click”. For example the “mouseover” results in the corresponding trajectories on the main map to be highlighted, as well as the corresponding mission infor-mation to be displayed in the “mission inforinfor-mation” component of the data browser UI.
h) Navigation Information – The detailed navigation information including the geographical position, depth, depth of the lake floor, as well as heading and speed are indicated in the navigation panel of the data browser. The navigation information remains synchronised with other visualisation panels and is updated in accordance to the state of browser in both interactive and replay modes.
i) Video Log – The availability of a video log is indicated on the timeline chart depicted in Figure 6(c). Correspondingly, the replay of the available video sequences may be triggered “clicking” the corresponding area of the timeline chart. During replay, all visu-alisation components, including the map, the timeline, as well as the navigation information remain synchronised with the particular frame of the video sequence. Clicking the video reveals an Obser-vation form depicted in Figure 6(c), which facilitates collaborative aggregation of observations.
j) Master Environmental Variables – Sensory data of water qual-ity have been monitored during all dives, registering temperature (C), oxygen level (%) and salinity (%) of the water. Irregular fre-quency of measurements was unified by interpolating all data (how) to one second time-step Theses data are each plotted versus depth. If there is no selected day, all the dataset is represented, allowing an overall view of behaviour of theses variables. On the other hand, if a specific day is selected theses plots each show one line per sub-marines color-wise represented for this daily data. A crosshair bar is synchronised with the browsing of the depth plot.
k) Sample Information – If a sample icon is clicked on the map or on the timeline, information about this sample is displayed (type, time, coordinates, coordinates, people that collected it and project it was used on). Actual content of the sample are not yet available online on this platform.
2.5 Data structure
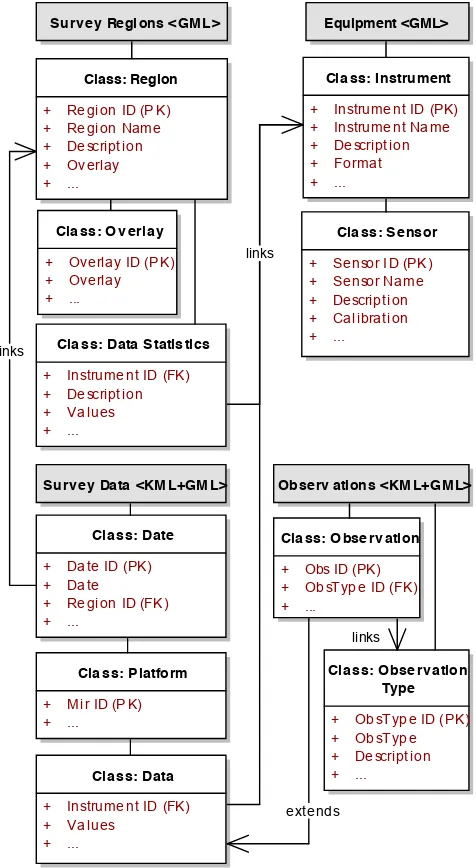
The developed GIS platform includes a Google Fusion Tables-powered online database of temporally and spatially synchronised sensory data, which allows systematic search, retrieval, as well as collab-orative editing. In particular, the semantic structure of the entire dataset is depicted in Figure 7. The resultant data is stored using XML, specifically the Open Geospacial Consortium (OGC) KML and OGC GML/Observations and Measurements (OM)+Sensor Web Enablement (SWE) schemas as detailed in the corresponding OGC standards. The simplified examples of the XML files that are utilised by our Web GIS platform are depicted in Tables 1 and 2.
3 CONCLUSIONS
We have developed a collaborative Web-based GIS platform, which facilitates efficient management, sharing and dissemination of multi-modal scientific data.
Multiple sources of multi-modal data, including continuous in-situ measurements, as well as discrete water and sediment samples have have been accurately geo-referenced and mapped. The precise syn-chronisation of the video logs collected throughout the entire course of the field campaign has been achieved by the frame-by-frame timestamp analysis. This allows for a classification of the lake floor morphology; analysis of the sediment mechanical properties; as well as observation and classification of the lake flora and fauna. The developed Web-GIS platform provides the necessary collabo-rative functionality to facilitate such analysis.
Class: Region
Cla ss: I nstrument
+ Instrume nt ID (PK)
Cla ss: P latform
+ Mi r ID (P K) + ...
Observ ations <KM L+G ML>
Cla ss: O bse rv ation
Cla ss: Data S tatis tics
+ Instrume nt ID (FK)
Figure 7: Semantic diagram of the ´El´emo project dataset.
A modular version of the developed platform is currently under de-velopment. The aim of the new structure is to create a separate inde-pendent plugin for each of the visualisation components, which are implemented as independent plugins, which interact between each other by the mean of asynchronous events. This solution would achieve the goal of reusability and modularity. New plugins can be developed easily for the use of different specialised scientific investigations.
The public version of the developed GIS platform is available on-line at:http://elemo-research.epfl.ch/demo.html.
ACKNOWLEDGEMENTS
The authors would like to thankfully acknowledge the support of Ferring Pharmaceuticals and the Russian Federations Honorary Con-sulate in Lausanne, as well as the devoted crew of P.P. Shirshov Institute of Oceanography of the Russian Academy of Science for facilitating this research.
Table 1: Description of a single day collected in the course of ´
El´emo field campaign and encoded using a combined OGC KML (2008)/GML (2012) format as suggested by Lake (2007). The cor-responding GML content is detailed in Table 2.
1 <?xml version="1.0" encoding="UTF-8"?>
2 <kml xmlns="http://www.opengis.net/kml/2.2">
25 <!-- GML content start -->
26 ...
27 <!-- GML content end -->
28 </ExtendedData>
29 </Placemark>
30 </Document>
31 </kml>
REFERENCES
Dragicevic, S., 2004. The potential of Web-based GIS. Journal of Geographical Systems 6, pp. 79–81. 10.1007/s10109-004-0133-4.
Fu, P. and Sun, J., 2010. Web GIS: Principles and Applications. Esri Press.
Lake, R., 2007. Transporting gml in kml. Blog post:http://www. galdosinc.com/archives/308.
OGC® Geography Markup Language (GML) – Extended schemas and encoding rules, 2012. Open Geospatial Consortium, Reference number: 10-129r1. Available: https://portal. opengeospatial.org/files/?artifact_id=46568.
OGC® KML, 2008. Open Geospatial Consortium, Version: 2.2.0, Reference number: 07-147r2. Available:http://portal. opengeospatial.org/files/?artifact_id=27810.
OGC® Reference Model, 2011. Open Geospatial Consortium, Reference number: 08-062r7. Available: https://portal. opengeospatial.org/files/?artifact_id=47245.
OGC® SWE Common Data Model Encoding Standard, 2011. Open Geospatial Consortium, Version: 2.0, Reference number:
Table 2: Dense sensor data from the ´El´emo field campaign en-coded using OGC GML Observations-and-Measurements (OM, 2011) and Sensor Web Enablement (SWE, 2011) frameworks and embedded within a KML file, as portrayed in Table 1.
1 ...
2 <!-- GML content start -->
3 <gml xmlns:gml="http://www.opengis.net/gml/3.2"
44 <!-- GML content end -->
45 ...