www.elsevier.comrlocaterapplanim
Development of a behavioural test of sensory
responsiveness in the growing pig
G.D. Hutson
a, T.J. Ambrose
b, J.L. Barnett
c, A.J. Tilbrook
b,)a
Department of Animal Production, UniÕersity of Melbourne, ParkÕille, Melbourne, Victoria, 3052, Australia
b
Department of Physiology, Monash UniÕersity, Clayton, Victoria, 3168, Australia
c
Victorian Institute of Animal Science, Sneydes Road, Werribee, Victoria, 3030, Australia
Accepted 2 September 1999
Abstract
The responses of individual growing pigs to 60 stimuli from five sensory categories were evaluated as an initial step in developing a behavioural measure of welfare. Pigs were exposed to the stimuli in a test pen after being trained to eat from a food box adjacent to a stimulus presentation box. The pen design allowed easy expression of approachravoidance behaviour by the pig. Five variables were measured — change in mean approachravoidance distance from the food box, change in frequency of elimination, change in frequency of turning away from the stimulus box, latency to return to the food box after stimulus presentation, and latency to enter the stimulus box. The most robust measure of responsiveness was change in approachravoidance distance. The strongest and most consistent aversive responses were obtained to auditory stimuli. There was little or no response to olfactory stimuli. Only two visual stimuli, which incorporated a black cross on a yellow background, elicited strong aversive responses. Other novel visual stimuli elicited positive responses. Responses to tactile stimuli were generally positive, mainly because they were administered by the experimenter and the pigs were familiar with handling by humans. Because there was significant variation between individual pigs, we propose that stimuli, which elicit high responsiveness but with little variation should be used in future tests of differences in responsiveness between treatments that may be indicative of stressed and unstressed pigs.q2000
Elsevier Science B.V. All rights reserved.
Keywords: Pig: avoidance behaviour responsiveness; Pig welfare; Temperament test
) C o rresp o n d in g au th o r. T el.: q6 1 -3 -9 9 0 5 -2 5 5 1 ; fax : q6 1 -3 -9 9 0 5 -2 5 4 7 ; e-m ail: [email protected]
0168-1591r00r$ - see front matterq2000 Elsevier Science B.V. All rights reserved. Ž .
1. Introduction
Ž
Animal behaviour is regarded as one of the best indicators of poor welfare Broom
.
and Johnson, 1993 . However, despite the potential for objective assessment of welfare, direct observation of normal behaviour is rarely used as a welfare index. In contrast, physiological measures of welfare are routinely regarded as welfare indicators, espe-cially the activation of the hypothalamo-pituitary–adrenal axis.
Welfare has been assessed in an indirect way by observation of abnormal behaviour. For example, behaviour patterns such as stereotypes are frequently cited as evidence of welfare problems. But it is not known whether performance of such behaviour is a
Ž .
simple response to restricted feeding Lawrence and Terlouw, 1993 , whether it is bad for the animal, whether it is part of a coping response to environmental change, or whether it even allows the animal to experience positive welfare through self-stimulation
Ž .
of endogenous opioid secretion Cronin, 1985 . In the final analysis, it is the absence of abnormal behaviour, which seems to be used as the behavioural measure of well-being. Preference testing is also an indirect method of assessing welfare since an animal ‘‘ votes with its feet’’ and applied ethologists record the ‘‘ vote’’ rather than the reactions to a particular environment. Preference tests suffer from the well-documented limitation of choices only indicating relative rather than absolute preference for one environment or the other. Although preference or avoidance of a particular environment may allow us to make inferences about that environment, the welfare of the animal making the choice is unknown. The link between preferences and welfare may break down if the choices
Ž
offered fall outside the animal’s sensory, cognitive and affective capacities Fraser and
.
Matthews, 1997 . Motivational testing, where animals work to obtain access to different
Ž .
commodities Dawkins, 1990 , is also an indirect method of assessment, since the behaviour recorded is generally an operant response, such as pecking a key or lifting a lever.
A recent interesting example of the potential use of behaviour as a direct measure of
Ž .
welfare is the study of Weary and Fraser 1995 of sow responsiveness to playback of
Ž
piglet distress calls. They demonstrated that sows showed a stronger response more
.
vocalisations, closer approach to the speaker during playback of isolation calls of piglets than during playback of white noise. Piglet calling could therefore be a useful measure of how well the animal is adjusting to environmental changes, especially
Ž .
around weaning. Weary et al. 1996 validated this approach by further demonstrating variation in the responsiveness of sows to ‘‘needy’’ and ‘‘un-needy’’ piglet calls.
It is surprising that behavioural methods for measuring welfare have focused mainly on indirect methods when behaviour is an animal’s first response when confronted with
Ž . Ž .
an environmental change stressor . This has been well known since Cannon 1935 identified the ‘‘fight or flight’’ response of the autonomic nervous system. Similarly,
Ž .
Moberg 1985 includes behaviour in his model of pre-pathological stress and regards it as an animal’s first line of defence against a potential stressor.
Since an animal’s first response to environmental change is approach or avoidance, it makes intuitive sense that measurement of this behaviour should be an important part of any behavioural measure or index of welfare. This has been recognised by Hemsworth et
Ž .
Ž . Ž .
Bouissou 1993 and Boissy and Bouissou 1995 in studies of the fear responses of
Ž .
sheep and cattle. Hemsworth et al. 1993 commonly found that commercial pigs were highly fearful of humans, based on avoidance of an experimenter in a standard test. The mechanism involved appeared to be a chronic stress response, since in a number of experiments pigs that were highly fearful of humans had a sustained elevation of free
Ž .
corticosteroid concentrations Hemsworth and Barnett, 1987 . Many other studies,
Ž .
reviewed by Hemsworth and Coleman 1998 , have also demonstrated a strong
relation-ship between approachravoidance behaviour and fear.
We have attempted to extend this concept to a broader range of potentially threaten-ing or stressful stimuli and have commenced development of a standard test of responsiveness, across a number of sensory categories, which may have the potential to discriminate between stressed and unstressed pigs. This work builds on the pioneering
Ž .
study of Broom 1986 , who tipped 200 ml of water onto the backs of lying stall-housed or group-housed sows. Group-housed pigs stood up or sat for longer periods in response to the tactile stimulus than stalled sows. The method also extends the study by Hutson et
Ž .
al. 1993 , which measured responsiveness of stalled sows to 20 different stimuli. One of the limitations of both these studies was that sows had limited opportunities to express a full range of behavioural responses to the stimuli. In Broom’s, study the sows were lying down before testing, and in Hutson’s study, the sows were neck-tethered in partial stalls. We tested the responses of growing pigs to 60 stimuli from five sensory categories.
Since approachravoidance is such an important part of an animal’s response to stress,
we tested animals in a test pen where this behaviour could easily be expressed by the animal and easily measured by the experimenter. Our aim was to quantify the magnitude and variation in responsiveness to the stimuli in normal pigs prior to future selection of fewer stimuli to evaluate differences between stressed and unstressed pigs.
2. Materials and methods
2.1. Animals
Ž .
Twenty-four crossbred pigs Large White=Landrace from the Pig Research and
Training Centre herd at Werribee were used in the tests. The study was done in two trials, during spring and summer. For each trial, six males and six females were selected at random from weaner crates within a weight range of 18–21 kg. Pigs were weaned into the crates at 25 days and ranged from 56 to 63 days old at the time of selection. The
10 experimental pigs for each trial were individually housed in adjacent 1.2=1.8 m
pens on a concrete floor with individual feeders and drinkers. The two companion pigs for each trial were housed adjacent to the test pen on concrete in a 1.1=3.6 m pen with ad libitum feed and water.
The care and use of the animals in this experiment conformed with the requirements of the Australian Prevention of Cruelty to Animals Act 1986 and the NH and
MRCrCSIROrAAC ‘‘Code of Practice for the Care and Use of Animals for Scientific
2.2. Test pen
The test pen was located in a separate shed from the 10 home pens. It consisted of a
0.5=2.4-m steel mesh sided pen erected in the middle of a larger 3=5 m
concrete-walled pen. Pig entry was via a mesh gate at the rear and exit was via opening of one of the mesh sides. The pen was parallel to the pen containing the two companion pigs. At
the front of the pen, there was a 0.5=0.25=0.13-m black plastic stand into which a
0.25=0.25=0.07-m food box containing 200 g pelleted food could be placed. A
2=5-m wooden barrier in front of the food box obscured all views forward of the test
pen. A 0.8=0.6-m sliding wooden door in the barrier allowed the test pig access to a
0.5=0.8=0.3-m stimulus box with wooden sides and a black sheet-plastic floor.
A video camera was mounted above the pen and recording commenced before each pig was introduced to the pen. Behaviour was videotaped for 2 min before and after stimulus presentation, which was cued by the opening of the sliding door. Thirty stimuli, grouped broadly into five sensory categories, were evaluated in each trial. These stimuli were selected on the basis that they were novel, or had successfully been used by other
Ž
researchers Alexander and Stevens, 1982; Broom, 1986; Jones, 1988; Hutson et al.,
.
1993 .
2.3. Stimuli
Stimuli 1–30 were evaluated in Trial 1 and Stimuli 31–60 were evaluated in Trial 2.
Ž .
Three stimuli were common to both trials — Control empty 29,59 , Control food
Ž30,60 and Sitting human 25,56 .. Ž .
2.3.1. Visual stimuli
Ž .1 Funnel. A red plastic funnel 21Ž =28 cm was suspended 10 cm above the base.
of the stimulus box and stayed in this position for the duration of the test.
Ž .2 Umbrella. The rear panel of the stimulus box was removed and a spring-loaded
umbrella was unfurled when the pig was facing towards the box. The umbrella remained in this position for the duration of the test.
Ž .3 Torch light. A 10-cm diameter battery powered torch was placed in a circular
opening at the base of the rear panel of the stimulus box.
Ž .4 Mirror. A 50=70-cm mirror was attached to the back of the stimulus box. Ž .5 Rod. A novel rod, similar to that used by Jones 1988 in tests of fear in layingŽ .
hens was used. The 36=6 cm steel rod was welded to a 15-cm base and covered with
Ž .
six differently coloured bands of plastic tape green, blue, white, red, yellow and black . The rod was placed upright in the centre of the stimulus box.
Ž31 Dropping ball. A 25. =15-cm red plastic football was released from above and
dropped into the stimulus box, if the pig was facing towards the box.
Ž32. Standing cross. A 2.5=15-cm diameter black paper cross mounted on a
33=23-cm yellow card. The card was attached to a spring-loaded base so that on
release it rose immediately to a vertical position.
Ž33 Flashing light. A flashing orange light, 90 flashes per min, mounted 10 cm.
Ž34 Revolving cross. A 2.5. =15-cm black paper cross mounted on a 28=33-cm
yellow card. The card was attached to a pulley driven by a small motor so that it revolved at a speed of 60 rpm.
Ž35 Moving tail. A toy ‘‘Funny animal ball’’, which consisted of an 8-cm diameter.
orange and pink plastic ball with a 23-cm black and brown striped tail attached to it. The ball was powered by a battery so that it rolled haphazardly about on the floor of the stimulus box, dragging the tail behind it.
2.3.2. Olfactory stimuli
Responses to olfactory stimuli were tested by placing a cotton wool swab impreg-nated with 10 drops of the chemical on the floor of the stimulus box 10 s prior to opening the sliding door. The following chemicals were obtained from the Sigma, St. Louis, MO, and presented undiluted, unless otherwise indicated:
Ž .6 Eucalyptus oil B.P. Felton, Grimwade and Bickford, Moorabbin, VictoriaŽ . Ž .7 Triethylamine
Ž .8 Vanillin 4-hydroxy-3-methoxy benzaldehydeŽ . Ž .9 Oil of Wintergreen methyl salicylateŽ . Ž10 Mineral turpentine Mobil Oil Australia. Ž .
Ž11 Aniseed oil natural aniseed essence, Queen Fine Foods, Enoggera, Queensland. Ž . Ž36 Glacial acetic acid.
Ž37 Artificial almond oil benzaldehyde. Ž .
Ž38 Ethanedithiol 1,2-ethanedithiol in methanol, 20. Ž ml in 40 ml. Ž39 Skatole 3-methylindole in methanol, 1 mg. Ž rml.
Ž40 Amyl acetate.
Ž41 Citronella oil Biotech International, Rocklea, Queensland. Ž .
2.3.3. Auditory stimuli
Ž
Recorded auditory stimuli were played back for 60 s using a tape recorder Genexxa,
. Ž . Ž .
Intertan , amplifier Genexxa, Intertan , and speaker Blaupunkt Hi-Fi mounted to a
25=35-cm jute fabric covered opening in the rear panel of the stimulus box. Other
auditory stimuli were activated adjacent to the fabric covered opening for 60 s. Sound levels given below were measured above the centre of the food box, 0.5 m from the
Ž .
sound source, using a Radio Shack Sound Level Meter Model 33-2050 , set to Fast response and A weighting.
Ž12 Piglet squeal. A recording of day-old piglet squeals was played back at 92–95.
dB. The recording was made from a 6-h-old piglet removed from a sow and litter, held between two hands, and gently squeezed.
Ž13 Bell bird song. Manorina melanophrys song recorded by H. Horton 1990 ,. Ž Ž .
.
Australian Broadcasting, Sydney was played back at 94–96 dB.
Ž14 Buzzer. An electric buzzer was activated at 92 dB..
Ž15 Sow grunt. A recording of sow grunts was played back at 92–96 dB. The.
recording was made from an unfamiliar sow during a nursing bout.
Ž16 Cap gun. A toy cap gun was fired seven times at 10 s intervals for 60 s. Peak.
Ž17 Smoke alarm. A commercial smoke alarm beep was activated for 60 s. Peak.
sound level was 106–108 dB.
Ž42 Dog bark. A recording of a dog barking was played back at 92–96 dB..
Ž43 Pig bark. A recording of pig barks was played back at 100–102 dB. The.
recording was made from growing pigs responding to the sudden appearance of an unfamiliar human handler.
Ž44 White noise. A recording of white noise was played back at 103 dB..
Ž45 Siren. A personal alarm siren Intertan Australia was activated at 106–108 dB.. Ž . Ž46 Compressed air. A recording of the release of compressed air in bursts of 5 s on,.
5 s off, was played back at 103 dB.
Ž47 Vibrating sheet steel. A recording of a vibrating 1.8. =1.2-m sheet of 1-mm steel was played back at 104 dB.
2.3.4. Tactile stimuli
All tactile stimuli except the hot and control air treatments were delivered by a human sitting with feet on the floor of the stimulus box. Each stimulus was administered once every 10 s for 60 s if the pig was within range, i.e., standing with head over the food box. The stimuli were:
Ž18 Slap. A firm slap on the neck. rshoulder with an open palm.
Ž19 Prod. A prod with a rounded 10-cm length of 18-mm diameter wooden dowel..
Ž20 Rub. A rub with the open palm on the neck. rshoulder
Ž21 Clip. A 65-mm spring-action ‘‘Bulldog’’ paper clip was placed on the middle of.
the leading edge of the pig’s left ear.
Ž22 Water. A 100-ml of water was tipped onto the pig’s back by remotely pulling a.
string which released a container attached 1.0 m above the pig.
Ž23 Brush. A soft nylon-bristled 15-cm brush was brushed along the neck. rshoulder.
Ž48 Feather duster. An emu-feathered duster was applied for about 1 s to the pig’s.
snoutrface.
Ž49 Aerosol spray. An aerosol spray of low allergen insecticide was applied for about.
1 s to the pig’s neckrshoulder.
Ž50 Hot air. An electric fan-forced heater was attached to a 18. =18-cm opening at
the rear of the stimulus box and blew air at 468C towards the pig.
Ž51 Control air. The fan was used to blow air towards the pig but the heating element.
was turned off.
Ž52 Electric prod. A hand-held commercial electric cattle prod was applied to the.
shoulderrneck of the pig.
Ž53 Control prod. The electric prod was applied to the pig with the current turned off..
2.3.5. Complex stimuli
Ž
For stimuli involving novel or control food presentation, 50 g of feed instead of 200
.
Ž24 Toy robot. An electronic toy ‘‘Talk’n Walk robot’’, which combined movement,.
Ž .
sound ‘‘Hands up’’, ‘‘Drop your weapon’’ and flashing lights, was operated remotely.
Ž25 Standing human. The experimenter stood in the stimulus box, facing the pig..
Ž26, 56. Sitting human. The back of the stimulus box was removed and the
experimenter sat on a chair with feet in the box and hands clenched, resting on the knees.
Ž27 Sitting human in mask and gloves. As above, except the experimenter wore red.
rubber gloves and a Donald Duck-mask.
Ž28 Green food. Ten grams of pellets dyed with green food dye were placed in the.
middle of the stimulus box.
Ž54 Rabbit. A live Dutch dwarf rabbit in a 40. =28=27-cm wire mesh hutch.
Ž55 Toy dog. A battery powered 15-cm toy dog which walked, shook its tail and.
barked.
Ž57 Quinine treated food. Ten grams of pellets, which had been soaked in quinine.
Ž .
hydrochloride 2 gr100 ml and dried were placed in the middle of the stimulus box.
Ž58 Blue food. Ten grams of pellets dyed with blue food dye were placed in the.
middle of the stimulus box.
2.3.6. Control stimuli
Ž29, 59 Control empty. The stimulus box was empty..
Ž30, 60 Control food. Ten grams of pellets normal ration were placed in the middle. Ž .
of the stimulus box.
2.4. Procedure
Pigs were fed daily with a commercial pelleted grower ration at 0900 h. If the previous day’s ration had been completely eaten then the amount was increased by 0.5 kg. After the feeders had been replenished, a cover was placed over each to prevent the pig from feeding. Each pen was then cleaned by scraping with a shovel.
Prior to testing the experimental stimuli, there was a training period in which each pig had to reach a criterion of commencing to eat from the food box within 5 s of introduction to the pen, and eating at least 50 g pellets, on two successive days. This criterion ensured that pigs immediately approached the food box on entering the test pen, readily fed from it, and were familiar with the stimulus box door sliding open after 120 s. The number of sessions to reach criterion ranged from 10 to 18, with a mean of 12.8 in Trial 1 and 13.4 in Trial 2.
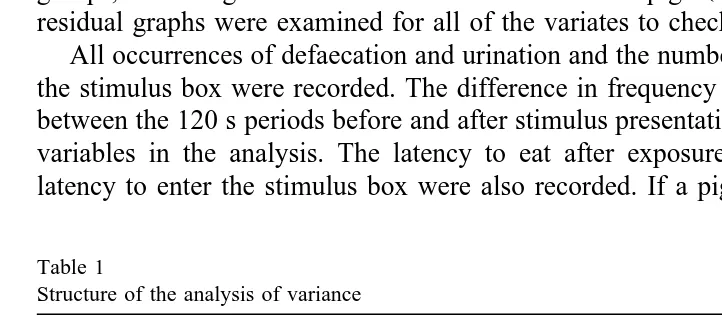
2.5. ObserÕations and statistical analysis
Videotapes were analysed by recording the location of the tip of the test pig’s snout in 1 s scans for each of the 120 s before and after stimulus presentation. Location was scored as one of six areas — the stimulus box, the food box, or four 0.5-m sections of the pen. The average distance of the pig from the food box was then computed before and after stimulus presentation using these frequency distributions of location. The effect
of the stimulus on approachravoidance behaviour could then be assessed by subtracting
the average distance before stimulus presentation from the average distance after. Data
Ž
were analysed as a randomized block design, with pigs as blocks Genstat 5, Release
.
4.1, Lawes Agricultural Trust, Rothamstead Experimental Station, 1997 . Distance from the food box before stimulus presentation was used as a covariate to improve precision. In the analysis of variance, the effect of stimuli was divided into the six different groups described above. Stimuli effects were then tested separately within each of the stimulus
Ž .
groups, but using the overall residual error between pigs Table 1 . Fitted values vs. residual graphs were examined for all of the variates to check for homoscedasticity.
All occurrences of defaecation and urination and the number of 1808turns away from the stimulus box were recorded. The difference in frequency of elimination and turning between the 120 s periods before and after stimulus presentation were used as dependent variables in the analysis. The latency to eat after exposure to the stimulus, and the latency to enter the stimulus box were also recorded. If a pig failed to eat or enter the
Table 1
Structure of the analysis of variance
Effect Degrees of freedom
Pig stratum
Covariate 1
Residual 8
Time within pig stratum
Stimulus group 5
Differences within Visual 4
Differences within Olfactory 5
Differences within Auditory 5
Differences within Tactile 5
Differences within Complex 4
Differences within Control 1
Covariate 1
stimulus box it was assigned a latency of 120 s. Latencies were transformed to common logarithms before analysis of variance. Back-transformed means are given in the results.
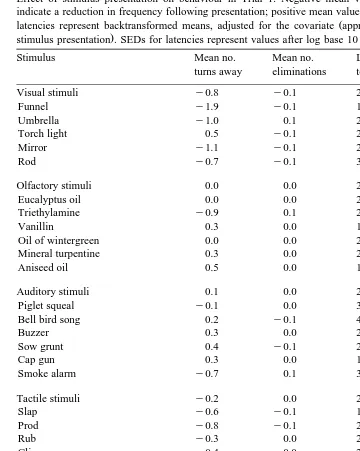
Table 2
Effect of stimulus presentation on behaviour in Trial 1. Negative mean values for turns and eliminations indicate a reduction in frequency following presentation; positive mean values indicate an increase. Values for
Ž
latencies represent backtransformed means, adjusted for the covariate approachravoidance distance before
.
stimulus presentation . SEDs for latencies represent values after log base 10 transformation
Stimulus Mean no. Mean no. Latency Latency to
Ž . Ž .
turns away eliminations to eat s stimulus s
Visual stimuli y0.8 y0.1 2.6 7.0
Funnel y1.9 y0.1 1.9 5.6
Umbrella y1.0 0.1 2.9 10.4
Torch light 0.5 y0.1 2.2 4.3
Mirror y1.1 y0.1 2.9 5.3
Rod y0.7 y0.1 3.8 12.3
Olfactory stimuli 0.0 0.0 2.3 6.8
Eucalyptus oil 0.0 0.0 2.9 9.0
Triethylamine y0.9 0.1 2.5 5.9
Vanillin 0.3 0.0 1.7 9.7
Oil of wintergreen 0.0 0.0 2.5 5.4
Mineral turpentine 0.3 0.0 2.6 6.5
Aniseed oil 0.5 0.0 1.7 5.6
Auditory stimuli 0.1 0.0 2.8 13.2
Piglet squeal y0.1 0.0 3.6 21.9
Bell bird song 0.2 y0.1 4.0 24.4
Buzzer 0.3 0.0 2.5 14.4
Sow grunt 0.4 y0.1 2.3 7.6
Cap gun 0.3 0.0 1.7 4.5
Smoke alarm y0.7 0.1 3.3 20.2
Tactile stimuli y0.2 0.0 2.4 14.0
Slap y0.6 y0.1 1.2 19.0
Complex stimuli y0.2 0.0 3.0 11.7
Toy robot y0.3 y0.1 5.1 36.7
Standing human y0.2 y0.1 2.4 9.4
Sitting human 0.6 0.2 2.6 8.5
Sitting human with maskrgloves y0.7 y0.1 2.2 13.5
Green food y0.2 y0.1 3.5 5.7
Control stimuli 0.5 y0.1 2.6 5.4
Control empty 1.3 0.1 2.9 5.5
Control food y0.3 y0.3 2.3 5.2
Distance from the food box before stimulus presentation was used as a covariate for the analysis of latencies, but not in the analysis of elimination or turning.
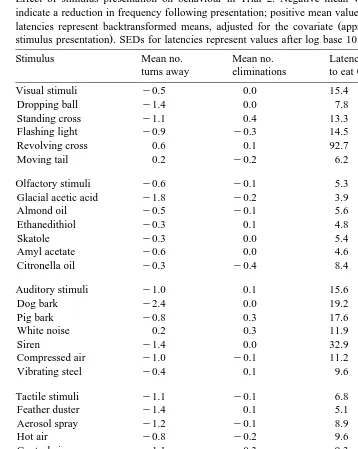
Table 3
Effect of stimulus presentation on behaviour in Trial 2. Negative mean values for turns and eliminations indicate a reduction in frequency following presentation; positive mean values indicate an increase. Values for
Ž
latencies represent backtransformed means, adjusted for the covariate approachravoidance distance before
.
stimulus presentation . SEDs for latencies represent values after log base 10 transformation
Stimulus Mean no. Mean no. Latency Latency to
Ž . Ž .
turns away eliminations to eat s stimulus s
Visual stimuli y0.5 0.0 15.4 41.0
Dropping ball y1.4 0.0 7.8 30.5
Standing cross y1.1 0.4 13.3 36.6
Flashing light y0.9 y0.3 14.5 38.8
Revolving cross 0.6 0.1 92.7 119.9
Moving tail 0.2 y0.2 6.2 22.4
Olfactory stimuli y0.6 y0.1 5.3 12.2
Glacial acetic acid y1.8 y0.2 3.9 9.4
Almond oil y0.5 y0.1 5.6 16.3
Ethanedithiol y0.3 0.1 4.8 16.0
Skatole y0.3 0.0 5.4 10.1
Amyl acetate y0.6 0.0 4.6 6.9
Citronella oil y0.3 y0.4 8.4 19.3
Auditory stimuli y1.0 0.1 15.6 50.9
Dog bark y2.4 0.0 19.2 35.4
Pig bark y0.8 0.3 17.6 106.4
White noise 0.2 0.3 11.9 38.0
Siren y1.4 0.0 32.9 97.1
Compressed air y1.0 y0.1 11.2 35.8
Vibrating steel y0.4 0.1 9.6 35.1
Tactile stimuli y1.1 y0.1 6.8 15.6
Feather duster y1.4 0.1 5.1 12.5
Aerosol spray y1.2 y0.1 8.9 8.6
Hot air y0.8 y0.2 9.6 30.1
Control air y1.1 y0.3 9.3 33.0
Electric prod y1.0 y0.2 5.6 6.1
Control prod y0.9 0.4 4.3 22.1
Complex stimuli y1.3 0.0 13.3 22.1
Rabbit y1.6 0.3 12.0 14.6
Toy dog y1.2 0.0 40.6 49.0
Quinine food y1.1 y0.2 11.3 18.3
Sitting human y1.8 0.0 8.8 22.3
Blue food y0.6 y0.3 8.6 18.1
Control stimuli y0.4 y0.2 9.1 21.8
Control empty y0.2 y0.2 5.2 21.8
Control food y0.5 y0.1 16.0 21.7
3. Results
The effects of the stimuli on general behaviour are summarised in Tables 2 and 3. In Trial 1, pigs were generally attracted by the visual stimuli, which reduced turning away
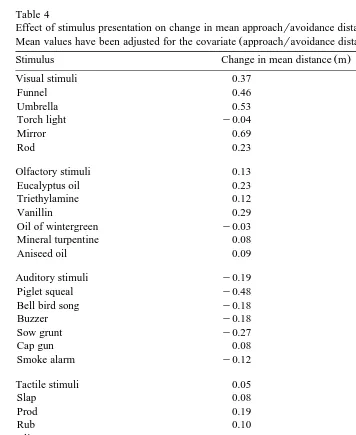
Table 4
Effect of stimulus presentation on change in mean approachravoidance distance from the food box in Trial 1.
Ž .
Mean values have been adjusted for the covariate approachravoidance distance before stimulus presentation
Ž .
Stimulus Change in mean distance m Variance
Visual stimuli 0.37 0.32
Funnel 0.46 0.18
Umbrella 0.53 0.47
Torch light y0.04 0.23
Mirror 0.69 0.22
Rod 0.23 0.18
Olfactory stimuli 0.13 0.12
Eucalyptus oil 0.23 0.11
Triethylamine 0.12 0.15
Vanillin 0.29 0.11
Oil of wintergreen y0.03 0.19
Mineral turpentine 0.08 0.06
Aniseed oil 0.09 0.15
Auditory stimuli y0.19 0.20
Piglet squeal y0.48 0.10
Bell bird song y0.18 0.19
Buzzer y0.18 0.21
Sow grunt y0.27 0.31
Cap gun 0.08 0.30
Smoke alarm y0.12 0.10
Tactile stimuli 0.05 0.23
Slap 0.08 0.25
Prod 0.19 0.41
Rub 0.10 0.27
Clip y0.20 0.10
Water 0.00 0.14
Brush 0.16 0.25
Complex stimuli 0.15 0.25
Toy robot y0.18 0.36
Standing human 0.35 0.19
Sitting human 0.08 0.36
Sitting human with maskrgloves 0.28 0.10
Green food 0.19 0.09
Control stimuli 0.02 0.20
Control empty y0.08 0.27
Control food 0.12 0.09
from the stimulus, elimination, and elicited short latencies to eat and enter the stimulus box.
Olfactory stimuli had virtually no impact on behaviour. Auditory stimuli tended to increase turning behaviour and resulted in the longest latencies to eat and enter the
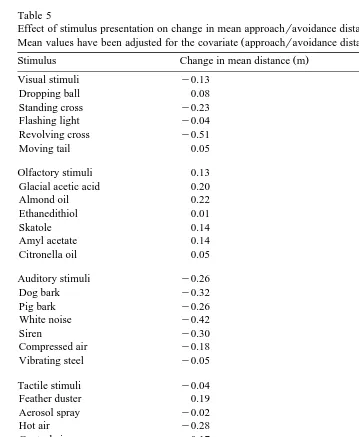
Table 5
Effect of stimulus presentation on change in mean approachravoidance distance from the food box in Trial 2.
Ž .
Mean values have been adjusted for the covariate approachravoidance distance before stimulus presentation
Ž .
Stimulus Change in mean distance m Variance
Visual stimuli y0.13 0.21
Dropping ball 0.08 0.15
Standing cross y0.23 0.06
Flashing light y0.04 0.18
Revolving cross y0.51 0.11
Moving tail 0.05 0.34
Olfactory stimuli 0.13 0.15
Glacial acetic acid 0.20 0.11
Almond oil 0.22 0.22
Ethanedithiol 0.01 0.23
Skatole 0.14 0.17
Amyl acetate 0.14 0.06
Citronella oil 0.05 0.13
Auditory stimuli y0.26 0.12
Dog bark y0.32 0.13
Pig bark y0.26 0.06
White noise y0.42 0.16
Siren y0.30 0.20
Compressed air y0.18 0.05
Vibrating steel y0.05 0.07
Tactile stimuli y0.04 0.17
Feather duster 0.19 0.24
Aerosol spray y0.02 0.11
Hot air y0.28 0.19
Control air y0.17 0.07
Electric prod 0.04 0.22
Control prod 0.01 0.12
Complex stimuli 0.00 0.31
Rabbit 0.12 0.44
Toy dog y0.27 0.39
Quinine food y0.03 0.29
Sitting human 0.13 0.12
Blue food 0.06 0.23
Control stimuli y0.04 0.09
Control empty 0.06 0.11
Control food y0.14 0.06
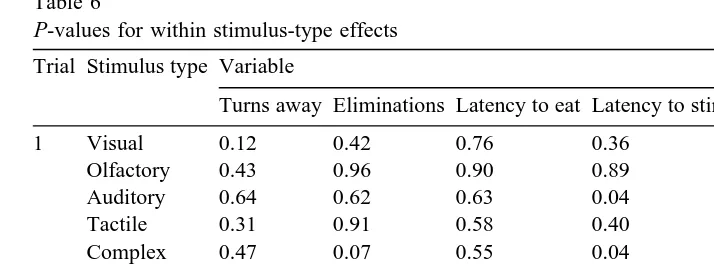
Table 6
P-values for within stimulus-type effects
Trial Stimulus type Variable
Turns away Eliminations Latency to eat Latency to stimulus Approachravoid distance
1 Visual 0.12 0.42 0.76 0.36 0.00
Olfactory 0.43 0.96 0.90 0.89 0.20
Auditory 0.64 0.62 0.63 0.04 0.00
Tactile 0.31 0.91 0.58 0.40 0.04
Complex 0.47 0.07 0.55 0.04 0.00
2 Visual 0.05 0.16 0.00 0.09 0.00
Olfactory 0.37 0.61 0.90 0.54 0.70
Auditory 0.03 0.68 0.43 0.20 0.20
Tactile 0.98 0.18 0.72 0.04 0.03
Complex 0.60 0.32 0.12 0.36 0.05
stimulus box. Tactile and complex stimuli had similar effects as auditory stimuli, but tended to reduce rather than increase turning behaviour. In Trial 2, some of the visual and auditory stimuli appeared to have marked aversive effects with long latencies to eat
Ž .
and enter the stimulus box. Several stimuli the revolving cross, pig bark, and siren had latencies to enter the stimulus box greater than 100 s, which is approaching the maximum limit of 120 s.
The effects of the stimuli on approachravoidance behaviour are summarized in
Tables 4 and 5. In Trial 1, visual, olfactory and complex stimuli had a positive effect on behaviour, whereas auditory stimuli had a negative effect. Tactile and control stimuli were neutral. The most aversive stimuli were the piglet squeal and the sow grunt. The most attractive stimuli were the mirror, umbrella, funnel and standing human. In Trial 2, visual and auditory stimuli had a negative effect, with olfactory, tactile and complex stimuli mostly neutral. The most aversive stimuli were the revolving cross, white noise, dog bark and siren. The most attractive were almond oil, glacial acetic acid, and the feather duster.
The power of the five dependent variables to detect significant differences between stimuli in the five sensory groups is shown in Table 6. There were no significant differences in elimination, two in turning behaviour, one in latency to eat, and three in latency to enter the stimulus box. In contrast, seven significant differences in
Table 7
Ž .
Pearson product-moment correlations between the five variables for pooled data ns60 stimuli from two trials. Probability values are given in brackets
Eliminations Latency to eat Latency to stimulus Approachravoid distance
Ž . Ž . Ž . Ž .
Turns 0.045 0.73 y0.381 0.00 y0.249 0.06 y0.223 0.09
Ž . Ž . Ž .
Eliminations 0.084 0.52 0.164 0.21 y0.197 0.13
Ž . Ž .
Latency to eat 0.797 0.00 y0.496 0.00
Ž .
approachravoidance distance were detected. There were significant differences between
Ž . Ž
individual pigs blocks in nine of the 10 anovas comprising Table 6 not elimination,
.
Trial 2 .
Ž .
Correlations between the five variables Table 7 showed a negative association
between approachravoidance distance and the other four variables. The correlation was
significant for latency to eat and latency to enter the stimulus box. There was also a significant negative association between latency to eat and turning behaviour, and a significant positive association between latency to eat and latency to enter the stimulus box. Elimination was not significantly associated with the other variables.
4. Discussion
The overall aim of this study was to develop a method to directly measure behaviour as an indicator of welfare in the growing pig. Hence, the first part of this study involved development of a suitable test pen and testing procedure. During pilot tests, we discovered that the presence of the two companion pigs in an adjacent pen was important for quick adaptation to the novel test pen and environment. The length and
Ž .
width of the pen 0.5=2.4 m were also crucial as they allowed the pig sufficient space
to express approachravoidance behaviour, but in close proximity to the test stimulus.
Problems with location of the source of olfactory and auditory stimuli were minimised by placing the food box adjacent to the stimulus box. The pigs quickly became familiar with the door of the stimulus box sliding open after 120 s and most reached the training criterion after 6 to 7 days training of two sessions per day.
Quite clearly, the most powerful of the five dependent variables we measured was
change in approachravoidance distance. This variable appeared to provide a sensitive
measure of the pig’s approachravoidance conflict in relation to the stimulus. Another
Ž
strength of this variable is that it is normally distributed based on difference in two
.
means of 120 observations and that it takes into account behaviour prior to stimulus presentation. Elimination, although often used as a measure of fear in open field tests, failed to discriminate between different stimuli. Latency to eat was also a poor measure, since it was often not possible to determine if an animal was actually eating when its head was in the food box. Furthermore, pigs were often scored in the food box when they were simply moving forward to investigate the stimulus. Turning behaviour, although perhaps a reliable indicator of fear, was an inappropriate measure within the context of this test. For example, a pig could turn away from the food box several times in the first 120 s of the test, and then in the 120 s after stimulus presentation simply turn away once and remain at the rear of the pen. Such a pig scored a reduction in frequency of turning, although it appeared fearful of the stimulus.
visual stimuli, including the umbrella and rod. In the domestic hen, the novel rod can
Ž .
elicit marked fear responses Jones, 1988 .
There was no response to many of the olfactory stimuli and only a mild attractive response to others, despite the pig’s reputed ability to locate buried food using olfactory
Ž .
cues Baldwin and Cooper, 1979 . The strongest aversive response was recorded for oil of wintergreen, while eucalyptus oil, vanillin and almond oil had mild attractive effects. The responses to tactile stimuli were generally positive and may have been con-founded by being administered by a sitting experimenter. Quite clearly, the pigs were used to handling by humans and responded positively towards them. It is interesting to note that in Trial 2, the only aversive responses recorded in response to tactile stimuli
Ž .
were those that did not involve human delivery hot air and control air, Table 5 . The lack of a response to the electric prod is surprising, but examination of videotape records indicated that pigs actually received shocks on few occasions. Effective shock delivery required sufficient contact with the pig to allow depression of spring-loaded contacts on the hand-held device, and this was rarely achieved. It should be noted that pigs were unfamiliar with the prodding device as they are not used by piggery staff.
The strongest and most consistent aversive responses were obtained to auditory stimuli, in both trials. Virtually all stimuli were effective, except the cap gun. Greatest
Ž .
responses were in response to the pig squeal and white noise. Talling et al. 1996 have reported that artificially generated sounds, including white noise, increased the heart rate
Ž
of pigs during 15 min playback periods. The aversive response to white noise and also
. Ž .
compressed air provides support for the conclusion of Penny et al. 1995 that the panic response of pigs to overhead balloon flights is largely in response to the sound of the gas burner. Of the complex stimuli, the toy dog and toy robot, which both combined visual and auditory stimuli, were most effective.
For each of the dependent variables we measured, there was significant variation
between individual pigs. Variances for approachravoidance distance for each stimulus
have been reported in Tables 4 and 5. An example of a strong aversive response with small variance is the pig bark, and an example of a positive response but with high variance is the rabbit. Thus, most pigs approached the rabbit, but some avoided it entirely. From the point of view of developing a test of sensory responsiveness, it is important, at least in the initial stages of testing, to select stimuli with high responsive-ness and little variation. This will maximise the chances of detecting significant
Ž .
differences between different classes e.g., stressed and unstressed of pig. With this in mind, we suggest that six types of stimulus most suited for further experimentation are:
Ø an aversive biological sound — either the piglet squeal or dog bark,
Ø an aversive physical sound — either the siren or white noise,
Ø an aversive visual stimulus — the revolving cross,
Ø an attractive visual stimulus — the mirror,
Ø a mildly attractive olfactory stimulus — eucalyptus oil,
Ø a mildly aversive olfactory stimulus — oil of wintergreen.
In conclusion, we have developed a method of measuring the responsiveness of pigs to a range of sensory stimuli. The next step in this work is to determine whether the test can be used in the assessment of pig welfare and is useful in identifying pigs whose welfare may be compromised.
Acknowledgements
We would like to thank Lynne Dickenson, Bruce Schirmer and Michelle Serapiglia for technical assistance and Kym Butler for statistical advice. This work was supported by a grant from the Australian Research Council.
References
Alexander, G., Stevens, D., 1982. Failure to mask lamb odour with odoriferous substances. Appl. Anim. Ethol. 8, 253–260.
Baldwin, B.A., Cooper, T.R., 1979. The effects of olfactory bulbectomy on feeding behaviour in pigs. Appl. Anim. Ethol. 5, 153–159.
Boissy, A., Bouissou, M.F., 1995. Assessment of individual differences in behavioural reactions of heifers exposed to various fear-eliciting situations. Appl. Anim. Behav. Sci. 46, 71–82.
Broom, D.M., 1986. Responsiveness of stall-housed sows. Appl. Anim. Behav. Sci. 15, 186, Abstract. Broom, D.M., Johnson, K.G., 1993. Stress and Animal Welfare. Chapman & Hall, London.
Cannon, W.B., 1935. Stresses and strains of homeostasis. Am. J. Med. Sci. 189, 1–14.
Cronin, G.M., 1985. The development and significance of abnormal stereotyped behaviours in tethered sows. PhD Thesis, Agricultural University of Wageningen.
Dawkins, M., 1990. From an animal’s point of view: motivation, fitness, and animal welfare. Behav. Brain Sci. 13, 1–61.
Ž .
Fraser, D., Matthews, L.R., 1997. Preference and motivation testing. In: Appleby, M.C., Hughes, B.O. Eds. , Animal Welfare. CAB International, Wallingford, Oxon.
Hemsworth, P.M., Barnett, J.L., 1987. Human–animal interactions. Vet. Clin. North Am.: Food Anim. Pract. 3, 339–356.
Hemsworth, P.H., Coleman, G.J., 1998. Human–Livestock Interactions. CAB International, Wallingford, Oxon.
Hemsworth, P.H., Barnett, J.L., Coleman, G.J., 1993. The human–animal relationship in agriculture and its consequences for the animal. Anim. Welfare 2, 33–51.
Hutson, G.D., Dickenson, L.G., Wilkinson, J.L., Luxford, B.G., 1993. The response of sows to novel visual, olfactory, auditory and tactile stimuli. Appl. Anim. Behav. Sci. 35, 255–266.
Jones, R.B., 1988. Repeatability of fear ranks among adult laying hens. Appl. Anim. Behav. Sci. 19, 297–304. Lawrence, A.B., Terlouw, E.M.C., 1993. A review of behavioral factors involved in the development and
continued performance of stereotypic behaviors in pigs. J. Anim. Sci. 71, 2815–2825.
Moberg, G.P., 1985. Biological response to stress: key to assessment of animal well-being? In: Moberg, G.P.
ŽEd. , Animal Stress. American Physiological Society, Bethesda, MD..
Penny, R.H.C., Farmer, A.-M.T., Lomas, M.J., 1995. ‘‘Up and away!’’ — Do hot air balloons scare outdoor pigs? The Pig Journal 34, 59–67.
Talling, J.C., Waran, N.K., Wathes, C.M., Lines, J.A., 1996. Behavioural and physiological responses of pigs to sound. Appl. Anim. Behav. Sci. 48, 187–202.
Vandenheede, M., Bouissou, M.F., 1993. Sex differences in fear reactions in sheep. Appl. Anim. Behav. Sci. 37, 39–55.
Weary, D.M., Fraser, D., 1995. Calling by domestic piglets: reliable signals of need? Anim. Behav. 50, 1047–1055.