A NOVEL APPROACH TO SUPPORT MAJORITY VOTING IN SPATIAL GROUP
MCDM USING DENSITY INDUCED OWA OPERATOR FOR SEISMIC
VULNERABILITY ASSESSMENT
M. Moradi a, *, M. R. Delavar b, B. Moshiri c, F. Khamespanaha
a MSc. Student, Dept. of Surveying and Geomatics Eng., University of Tehran, Tehran, Iran- (milad.moradi,
Fa_khamespanah)@ut.ac.ir
b Center of Excellence in Geomatics Eng. in Disaster Management, Dept. of Surveying and Geomatics Eng., College of Eng.,
University of Tehran, Tehran, Iran- [email protected]
c Control and Intelligent Processing Center of Excellence, School of Electrical and Computer Eng., University of Tehran, Tehran,
Iran- [email protected]
KEY WORDS: Group MCDM, Majority Voting, Density Induced OWA, Earthquake, Vulnerability Assessment, Tehran
ABSTRACT:
Being one of the most frightening disasters, earthquakes frequently cause huge damages to buildings, facilities and human beings. Although the prediction of characteristics of an earthquake seems to be impossible, its loss and damage is predictable in advance. Seismic loss estimation models tend to evaluate the extent to which the urban areas are vulnerable to earthquakes. Many factors contribute to the vulnerability of urban areas against earthquakes including age and height of buildings, the quality of the materials, the density of population and the location of flammable facilities. Therefore, seismic vulnerability assessment is a multi-criteria problem. A number of multi criteria decision making models have been proposed based on a single expert. The main objective of this paper is to propose a model which facilitates group multi criteria decision making based on the concept of majority voting. The main idea of majority voting is providing a computational tool to measure the degree to which different experts support each other’s opinions and make a decision regarding this measure. The applicability of this model is examined in Tehran metropolitan area which is located in a seismically active region. The results indicate that neglecting the experts which get lower degrees of support from others enables the decision makers to avoid the extreme strategies. Moreover, a computational method is proposed to calculate the degree of optimism in the experts’ opinions.
* Corresponding author: [email protected] MSc. Student, GIS Dept., University of Tehran, Iran.
1. INTRODUCTION
Earthquakes are natural phenomenon and neglecting them could cause huge damages to urban areas. Large earthquakes enforce urban authorities to evolve a plan for disaster management. Historical surveys revealed that a large proportion of Iran is threatened by earthquakes. Consequently, earthquake could be regarded as the most destructive disaster in Iran (M Hashemi & Alesheikh, 2012; Shuwen & Zhi, 1990). Tehran is the largest city in Iran and has more than eight million inhabitants. Overcrowded and aged buildings, non-standard materials and existence of faults around and inside the city make the city extremely vulnerable against earthquake (Alinia & Delavar, 2011; Bradley et al., 2008; Mahdi Hashemi & Alesheikh, 2011). Moreover, concentration of population in poor districts in southern parts of the city increases the vulnerability in these areas. Earthquakes are expected every 150 years in Tehran (Khamespanah et al., 2013). Disaster management contains four main steps including knowing the risk, predicting the consequences, preparing for disaster and reducing its effects (Alam, Tesfamariam, & Alam, 2012; Erden & Karaman, 2012; Tseng & Chen, 2012). This paper focuses on the second part, predicting the consequences. This step is crucial for planning how to reducing the effects of the disaster. In the case of earthquake, seismic loss estimation could be regarded as a powerful tool for predicting the earthquake’s consequences. The main objective of this research is proposing a model which facilitates majority voting in seismic loss estimation for group
decision making. The second objective of the paper is finding out which areas of the city are more vulnerable to earthquake. The study area is Tehran metropolitan area which is the capital of Iran. In order to assess the physical vulnerability it is assumed that North Tehran Fault is activated and caused an earthquake. Moreover, no other fault is assumed to be stimulated by the activation of North Tehran Fault.
Group multi criteria decision making is a type of MCDM which applies more than one expert (Malczewski, 1996). Using more than one expert improves the reliability of the model as well as makes it possible to compare between experts’ point of views. Majority voting lead to decision making based on the experts which their opinion was supported by the others (Boroushaki & Malczewski, 2010). Density Induced Ordered Weighted Averaging (DIOWA) operator facilitates the decision making based on majority voting. In the current research DIOWA is applied to enable decision makers to make decisions with lower weights for experts whose opinions was far from the others (Ma & Guo, 2011).
1.1 Related Works
Whitman et al. (1997) proposed a model for nationwide seismic loss estimation. They determined important criteria for physical vulnerability. Ordaz et al. (1998) introduced the fundamental concepts of vulnerability assessment. They also built a successful seismic loss estimation model. Yong et al. (2002) developed the model for large scale assessments. Kircher, Whitman, and Holmes (2006) applied HAZUS in order to assess the vulnerability of urban areas to earthquakes. HAZUS is a software developed for exclusive use inside United States (Neighbors et al., 2012). HAZUS is considerably difficult to be developed for outside United States (Kircher, Whitman, & Holmes, 2006; Neighbors et al., 2012). Alinia and Delavar (2011) developed a seismic vulnerability assessment method based on Granular Computing (GrC). GrC is a method to extract rules with minimum entropy from an information table. They proposed this model in order to have a reliable classification of urban areas based on the degree to which they are vulnerable. Khamespanah et al. (2013) improved the model introduced by Alinia and Delavar (Alinia & Delavar, 2011) for group decision making. They added the capability of resolving contradictions between experts’ opinions. The sensitivity of seismic loss estimation methods to input variables and criteria was investigated by (Porter, Beck, & Shaikhutdinov, 2002). Aghamohammadi et al. (2013) assessed the human seismic vulnerability of urban areas which is the estimation of number of humans may die in an earthquake. Moradi, Delavar, and Moshiri (2013) assessed the sensitivity of OWA operator in earthquake vulnerability assessment. They found out that both optimistic and pessimistic decision makers have large sensitivity and the model is not stable enough. The ability of high way networks for after earthquake search and rescue operation was investigated by (Werner, Taylor, & Moore, 1997). They proposed a model to assess the vulnerability of high ways to large earthquakes.
In the current paper, in section 2 Density Induced OWA is introduced. Then, in section 3 an illustrative example of application of DIOWA in seismic vulnerability assessment is demonstrated. The results of the seismic vulnerability model are assessed based on majority voting and neutral strategy and section 4 contains the conclusion.
1.2 GIS-based Multi Criteria Decision Analysis
Multi criteria decision analysis encompasses three vital elements including 1) a number of alternatives 2) a number of criteria 3) alternatives’ scores based on different criteria (attribute values) (Jiang & Eastman, 2000). In group multi criteria decision analysis, where more than one expert is applied, score of each alternative based on each expert is added to the three elements. GIS based multi criteria decision making tend to assign an overall score to each part of the land regarding the scores in different criteria. In GIS based multi criteria decision analysis usually a set of points, lines, polygons and pixels are regarded as alternatives and their attribute values are considered as alternatives’ scores. Optimal site selection, land use suitability analysis and resource allocation are common types of problems in this area of research. However, a number of problems are controversial because of difficulties in specifying contributing criteria and selecting the most effective method with respect to the problem constrains. The main idea in MCDM is to define an aggregation function which is a transform from an nd space to a 1d space. The aggregated value is used to determine the best alternative. Equation (1) demonstrates the fundamental part of MCDM problem (Malczewski, 2006):
1 ( ) 1 2
(A )j _ (x , x ,..., x )n
Score Agg Function
where xi= attribute value for ith criterion
Aj = jth alternative
Finding the appropriate aggregation function is then all needed for an MCDM problem. Boolean overlay and Weighted Linear Combination (WLC) are frequently applied in GIS based MCDM problems. The former tends to solve the problem with binary maps and operator like AND and OR, while the later utilizes a weight vector indicating the relative importance of the criteria to build the function using a linear averaging operator. OWA is an umbrella that covers a variety of operators and it also overcome the shortcoming of traditional operators.
1.3 GIS based group MCDA
A number of researches have been undertaken to indicate the application of group decision making methods in GIS environment. Using multi-expert methods ensure the neutrality of experts and increase the reliability of the results. Furthermore, by applying group decision making algorithms, the degree to which the experts’ judgments support each other can be calculated. As the experts are not fault-free, using more than one expert helps us to decide about the weight of each expert in the model. Group MCDM mainly consists of two parts (Malczewski, 1996, 2006): 1) Combining the attribute values for every expert separately. 2) Aggregating the maps that produced in the previous step (aggregating the experts’ opinions).
Figure 1. Group decision making
2. METHODOLOGY
2.1 Ordered Weighted Averaging Operator
Multi criteria decision analysis methods are always related to a set of criteria including maps, attribute values and layers. What matters here is how to overlay the layers in order to consider all decision maker preferences. Spatial multi criteria decision analysis result in ordering and selecting a set of spatial objects (alternatives) such as: points, lines, polygons and pixels. Each preferences into the orders. Ordered weighted averaging operator is an aggregation function that assigns a value to the alternative i based on its attribute values. The aggregation function of OWA is shown in Equation (2) (Yager, 1993):
2 the criteria based on the experts’ judgments, however, the latter is associated with the Orness and similarity to the maximum operator. All pixels inside a particular layer have the same order weights. Therefore, all alternatives in the same set have a specific weight, indicating tis importance, in common. However, their order weights may be different. If the order weights be the same then the OWA operator will turn into the simple weighted linear combination, which only takes the relative importance of the criteria into account.
Yager (1996) suggested that statements such as: “most of the criteria should be satisfied by an acceptable result” and “all of the criteria should be satisfied by an acceptable solution” could be the fundamental idea for calculating the order weights. These kinds of statements are called “Linguistic Quantifiers”.
2.2 Linguistic Quantifiers
There are mainly two types of linguistic quantifiers including absolute and relative quantifiers. Statements such as “not more than 10”, “at least 5” and “approximately 8” which express the number of criteria which are going to be satisfied are absolute quantifiers. However, quantifiers such as “a few”, “most” and “at least one” are relative quantifiers. Linguistic quantifiers which are indicated by Q are numbers in the interval [0,1].
Q(p)=1 shows the maximum fitness and the Q(p)=0 is the minimum fitness. For each
p
[0,1]
the Q(p) indicates the degree to which the concept of Q is satisfied by the value of p. for example, if the Q is “most” then Q(0.6)=0.75 means thatα = 1 means that expert want half of the criteria to be satisfied. Larger amounts of α indicates larger proportion of criteria to be satisfied. Then order weights are calculated using Equation (4) (Filev & Yager, 1998):
Therefore, the order weights are calculated using relative importance or layer weights.
2.3 Density Induced OWA
The simple OWA and Induced OWA are both appropriate for the first step of the procedure introduced in section 1.3 and do not meet the requirements of a group aggregation operator. Ma and Guo (2011) Introduced a new version of OWA integrated with k-means, which facilitates group multi criteria decision making with focus on the majority of experts instead of all of them. A density parameter is calculated based on the relative distance of the experts’ opinions which indicates the degree to which they support each other. This density, then, is considered as ui in the OWA aggregation function. Optimistic linguistic
quantifiers lead to higher weights for experts with greater support, while neutral quantifiers tend to assign the same weights for all experts and make a decision based on all the information content provided by experts. Meanwhile, the pessimistic quantifiers do not make any acceptable result. Because the higher weights are associated with the experts with the lower support which means the tendency to make a decision based on outliers. Consequently, quantifiers of “most” and “all” are frequently used for group decision making based on
r = user specified threshold
In order to use this equation, decision maker should first specify the value of r. Then determine the set of expert’s judgment
around ai. Next the distance to all members in A should be
6 ( )
(a ,a ) (a ,a )
/
.
i j i j
j i
d d
ij
a A
w
e
e
where d(ai, aj) = Distance between experts’ opinion
wij = Weights of the density
w is used then, in Equation (5) in order to make a balance in the weight vector.
2.4 Orness Measure
Orness determines the degree to which the behavior of an aggregation function is similar to Or operator. Although Or and And are two extreme operators, OWA could be regarded as a mapping between them. Or is considered to be an optimistic operator, because it tends to higher aggregated values. However, And is an pessimistic operator which have a tendency to produce lower values as aggregated values. Optimistic operator assign higher score to alternatives similar to ideal solution, while pessimistic operators try to choose the best alternative through the alternatives with large distance to negative ideal solution. In OWA operator, optimism degree (Orness) is associated with the linguistic quantifier. Regardless of the selected linguistic quantifier Yager (1988) proposed Equation (7) for Orness measure:
7 ( )
1
( ) min [u(b )]
(w) *
max [u(b )] min [u(b )]
n
j j j
j
j j j j j
u b
Orness w
where u(b) = relative importance
n = The number of criteria
w is the weight vector and Orness is a parameter in the interval of [0, 1]. 1 means that operator is just similar to Or operator. 0 indicates that operator’s behavior or like And and 0.5 shows a neutral operator. Neutral operators act entirely similar to weighted averaging operators. The overall score of alternatives is considerably higher using optimistic quantifiers in comparison to neutral and pessimistic ones.
3. APPLICATION
3.1 Study Area
The study area of this paper is Tehran Metropolitan Area which is located in the central part of Iran. Having more than eight million inhabitants, Tehran is the largest city of Iran. Tehran is ranked 29th in the world by the population of its metropolitan area.
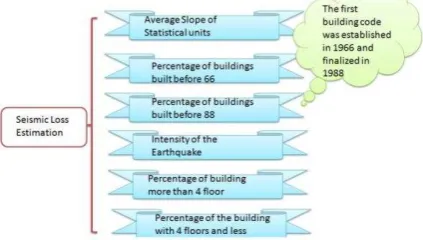
Figure 2. Contributing criteria
In the last two decades Tehran has been the focus of almost all financial, educational, economical and business activities. Therefore, a considerable number of people have been migrated to the city. There are more than three known and many unknown faults around the city which make it extremely vulnerable to the earthquake. North Tehran Fault, North Rey Fault and Mosha Fault are major faults that endanger the city. Moreover, having neighborhoods with non-standard aged building increased the vulnerability of the city against earthquakes. The criteria selection for this paper is significantly restricted because of the limited accessibility to the current complete data. However, six contributing criteria are determined and related data are gathered from 1996 census. In the future researches the number of criteria may increase and the model is capable to apply not only quantitative but also qualitative data. Figure 2 demonstrates the contributing criteria.
3.2 Information Table of Experts
In order to calculate the seismic vulnerability index for statistical units in the Tehran metropolitan area, experts should specify the importance of each criterion. The weight vectors are then calculated based on the predefined strategy and seismic vulnerability is calculated using Equation (2). In this paper group decision making approach is implemented. Consequently, more than one expert is asked to determine the importance of criteria. Table 1 illustrates the relative importance assigned to different layers by experts.
Table 1. Different layer weights based on different experts
The numbers in Table 1 are Ui in Equation (2) and show the
importance of criteria. The order weights should still be determined. Linguistic quantifiers are employed to calculate the order weights. Optimistic quantifiers lead to larger weights in the beginning of the weight vector and vice versa. Neutral quantifiers result in approximately the same order weights.
Figure 3. Density around experts
Criteria Ex1 Ex2 Ex3 Ex4 Ex5
Build_66 4 5 4 5 3
Build_66-88 3 2 2 3 2
Slope 1 2 1 4 2
Build_more_4 4 5 4 2 5
Build_less_4 2 3 5 4 4
3.3 Extracting Order Weights
In order to combine the attribute values (different map layers) and generate the seismic loss estimation maps, the order weights along with the relative importance should be obtained. Then, the OWA operator is able to calculate the vulnerability index for each statistical unit. Initially, the density around each expert should be calculated using Equation (5). Figure 3 shows the density values for experts’ opinions.
According to Figure 3 the density measure is the highest for Exp 5 and the minimum density is related to Exp 3. Therefore, experts’ opinions remarkably support expert 5 and do not agree with expert 3. It means that it is more probable that expert 3 is wrong and other experts are correct. Fig.4 also indicates that experts support each other to some extent. However, the support for the third expert does not reach to an acceptable level. If majority voting is not expected then, the equal weights should be assigned to all experts.
3.4 Generating Vulnerability Maps
Optimism degree has a considerable effect in vulnerability classification. A pessimist decision maker may categorize a major part of the statistical units as very vulnerable, while an optimistic one may put a less proportion of units in the vulnerable class. Therefore, the optimism degree is an effective parameter in the vulnerability assessment. Optimism degree for five experts is calculated using Equation (7) and the results are shown in Figure 4.
Figure 4. Optimism degree of experts
The optimism degree less than 0.5 means that the expert is pessimist and vice versa. Figure 4 demonstrates that the majority of experts are pessimist and only expert 3 has an optimistic attitude to the vulnerability of Tehran. Moreover, it could be concluded from Figure 4 that expert 1 has the most pessimistic orientation to the problem. Consequently, the results of vulnerability classification for expert 3 and expert 1 may be far from the others, while expert 2, expert 4 and expert 5 may have the more similar opinions. In majority voting these experts have more effect in determining the vulnerability index because of the considerable amount of support between them.
This map is the result of the second aggregation when the different experts’ opinions are combined and an overall map is created. Figure 5 is related to all experts and is generated by employing a neutral quantifier. Neutral quantifiers assign same weights to all experts so the result is affected by expert 1 and expert 5 similarly. Taking into account that some experts may have a wrong or extreme opinion about vulnerability, one may want to reduce the effect of some experts on the final
vulnerability map. Majority voting is facilitated using DIOWA. DIOWA calculates the density of expert’s opinions around a specific expert which indicates the degree to which his opinion is supported by other experts. These density measures are then substituted by U, relative importance, in Equation (3).
Figure 5. Vulnerability map for “All”
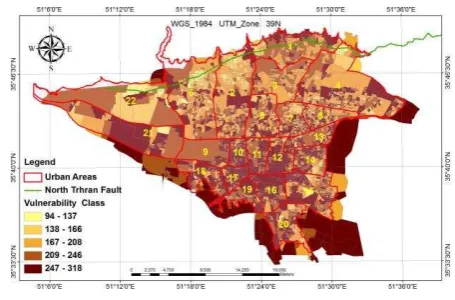
Therefore, the expert with greater support from others has greater power to determine the vulnerability degree of statistical units. Figure 6 demonstrates the vulnerability map based on majority voting.
Figure 6. Vulnerability map for “Majority”
From Figure 5 and 6 it is obvious that eliminating extreme experts from the list of experts with DIOWA leads to more moderate vulnerability map. Overall, northern parts of Tehran are less vulnerable in comparison to southern parts. Therefore, urban managers should pay more attention to southern areas.
4. CONCLUSION
experts’ opinions are implemented and compared in this paper. Moreover, optimism degree is a controversial issue in seismic vulnerability assessment because experts may have different attitude toward the problem which intensively affect the resulted vulnerability indexes.
Future researches can focus on uncertainty propagation in seismic loss estimation models. The experts have different opinions that do not necessarily support each other’s. Resolving the conflicts between experts’ opinions can be a subject for further researches. Moreover, the geological data is one of the crucial layers that can be added to the model.
REFERENCES
Aghamohammadi, H., Mesgari, M., Mansourian, A., & Molaei, D. 2013. Seismic human loss estimation for an earthquake disaster using neural network. International Journal of
Environmental Science and Technology, 10(5) pp., 931-939.
Alam, M., Tesfamariam, S., & Alam, M. S. 2012. GIS-Based Seismic Damage Estimation: Case Study for the City of Kelowna, BC. Natural Hazards Review, 14(1) pp., 66-78.
Alinia, H. S., & Delavar, M. 2011. Tehran’s seismic vulnerability classification using granular computing approach.
Applied Geomatics, 3(4) pp., 229-240.
Boroushaki, S., & Malczewski, J. 2010. Using the fuzzy majority approach for GIS-based multicriteria group decision-making. Computers & Geosciences, 36(3) pp., 302-312.
Bradley, B. A., Dhakal, R. P., Cubrinovski, M., MacRae, G. A., & Lee, D. S. 2008. Seismic loss estimation for efficient decision making. pp.
Erden, T., & Karaman, H. 2012. Analysis of earthquake parameters to generate hazard maps by integrating AHP and GIS for Küçükçekmece region. Natural Hazards and Earth
System Science, 12(2) pp., 475-483.
Filev, D., & Yager, R. R. 1998. On the issue of obtaining OWA operator weights. Fuzzy Sets and Systems, 94(2) pp., 157-169.
Hashemi, M., & Alesheikh, A. 2012. Development and implementation of a GIS-based tool for spatial modeling of seismic vulnerability of Tehran. Natural Hazards and Earth
System Science, 12(12) pp., 3659-3670.
Hashemi, M., & Alesheikh, A. A. 2011. A GIS-based earthquake damage assessment and settlement methodology.
Soil dynamics and earthquake engineering, 31(11) pp.,
1607-1617.
Jiang, H., & Eastman, J. R. 2000. Application of fuzzy measures in multi-criteria evaluation in GIS. International
Journal of Geographical Information Science, 14(2) pp.,
173-184.
Khamespanah, F., Delavar, M. R., Alinia, H. S., & Zare, M. (2013). Granular Computing and Dempster–Shafer Integration in Seismic Vulnerability Assessment Intelligent Systems for
Crisis Management (pp. 147-158): Springer.
Kircher, C. A., Whitman, R. V., & Holmes, W. T. 2006. HAZUS earthquake loss estimation methods. Natural Hazards
Review, 7(2) pp., 45-59.
Ma, F. M., & Guo, Y. J. 2011. Density‐induced ordered weighted averaging operators. International Journal of
Intelligent Systems, 26(9) pp., 866-886.
Malczewski, J. 1996. A GIS-based approach to multiple criteria group decision-making. International Journal of Geographical
Information Systems, 10(8) pp., 955-971.
Malczewski, J. 2006. GIS‐based multicriteria decision analysis: a survey of the literature. International Journal of
Geographical Information Science, 20(7) pp., 703-726.
Moradi, M., Delavar, M., & Moshiri, B. 2013. Sensitivity Analysis of Ordered Weighted Averaging Operator in Earthquake Vulnerability Assessment. ISPRS-International Archives of the Photogrammetry, Remote Sensing and Spatial
Information Sciences, 1(3) pp., 277-282.
Neighbors, C., Cochran, E., Caras, Y., & Noriega, G. 2012. Sensitivity analysis of FEMA HAZUS earthquake model: case study from King County, Washington. Natural Hazards Review, 14(2) pp., 134-146.
Ordaz, M., Miranda, E., Reinoso, E., & Pérez-Rocha, L. E. 1998. Seismic loss estimation model for Mexico City.
Universidad Nacional Autónoma de México, México DFpp.
Porter, K. A., Beck, J. L., & Shaikhutdinov, R. V. 2002. Sensitivity of building loss estimates to major uncertain variables. Earthquake Spectra, 18(4) pp., 719-743.
Shuwen, Y. Z. L. S. Y., & Zhi, Z. 1990. ESTIMATING METHOD OF SEISMIC DAMAGE AND SEISMIC LOSS [J].
Earthquake Engineering and Engineering Vibration, 1pp., 009.
Tseng, C.-P., & Chen, C.-W. 2012. Natural disaster management mechanisms for probabilistic earthquake loss.
Natural Hazards, 60(3) pp., 1055-1063.
Werner, S. D., Taylor, C. E., & Moore, J. E. 1997. Loss estimation due to seismic risks to highway systems. Earthquake
Spectra, 13(4) pp., 585-604.
Whitman, R. V., Anagnos, T., Kircher, C. A., Lagorio, H. J., Lawson, R. S., & Schneider, P. 1997. Development of a national earthquake loss estimation methodology. Earthquake
Spectra, 13(4) pp., 643-661.
Yager, R. R. 1988. On ordered weighted averaging aggregation operators in multicriteria decisionmaking. Systems, Man and
Cybernetics, IEEE Transactions on, 18(1) pp., 183-190.
Yager, R. R. 1993. Families of OWA operators. Fuzzy Sets and
Systems, 59(2) pp., 125-148.
Yager, R. R. 1996. Quantifier guided aggregation using OWA operators. International Journal of Intelligent Systems, 11(1) pp., 49-73.
Yong, C., Ling, C., Güendel, F., Kulhánek, O., & Juan, L. 2002. Seismic hazard and loss estimation for Central America.