BUILDING DAMAGE ASSESSMENT AFTER EARTHQUAKE USING
POST
-
EVENT LiDAR DATA
H. Rastiveis a, *,F.Eslamizadea ,E. Hosseini-zirdoo a
a Dept. of Geomatics Engineering, School of Eng., University of Tehran, [email protected]
KEY WORDS: Earthquake, Building, LiDAR Data, Damage Map, Classification
ABSTRACT:
After an earthquake, damage assessment plays an important role in leading rescue team to help people and decrease the number of mortality. Damage map is a map that demonstrates collapsed buildings with their degree of damage. With this map, finding destructive buildings can be quickly possible. In this paper, we propose an algorithm for automatic damage map generation after an earthquake using post-event LiDAR Data and pre-event vector map.
The framework of the proposed approach has four main steps. To find the location of all buildings on LiDAR data, in the first step, LiDAR data and vector map are registered by using a few number of ground control points. Then, building layer, selected from vector map, are mapped on the LiDAR data and all pixels which belong to the buildings are extracted. After that, through a powerful classifier all the extracted pixels are classified into three classes of “debris”, “intact building” and “unclassified”. Since textural information make better difference between “debris” and “intact building” classes, different textural features are applied during the classification. After that, damage degree for each candidate building is estimated based on the relation between the numbers of pixels labelled as “debris” class to the whole building area. Calculating the damage degree for each candidate building, finally, building damage map is generated.
To evaluate the ability proposed method in generating damage map, a data set from Port-au-Prince, Haiti’s capital after the 2010 Haiti earthquake was used. In this case, after calculating of all buildings in the test area using the proposed method, the results were compared to the damage degree which estimated through visual interpretation of post-event satellite image. Obtained results were proved the reliability of the proposed method in damage map generation using LiDAR data.
1. INTRODUCTION
In recent years, natural disasters such as earthquake, flood, volcano eruption, drought, etc. took thousands of lives and had bad affection in people's life and many people become displaced. The necessity and importance of this issue need particular attention. Unfortunately, despite the immense technological advancements, humans still cannot predict earthquakes. In comparison with other natural disasters, therefore, earthquake is more significant.
One of the biggest earthquakes of the 21 century is Haiti earthquake that occurred on 12 January 2010 a magnitude 7.0 Mw earthquake. The reports show 222,570 people killed, 300,000 injured, and 1.3 million people displaced. According to the United States Geological Survey (USGS), 97,294 houses were destroyed and 188,383 were damaged in Port-au-Prince and in much of southern Haiti. Therefore, rapidly and accurately emergency response to help rescue missions is needed. Remote sensing data are the most effective and accurate sources to solve this problem. As rules there have four category's data: (1) optical, (2) SAR, (3) LiDAR. Using LiDAR system is one of the best and powerful techniques in remote sensing to collect information from surface of earth. This technique is similar to RADAR .the LiDAR system use 3 technologies: Laser ranging for accurate distance
measurement, Satellite positioning using GPS, Inertial Measurement Unit (IMU) to record orientation. LiDAR technology provides 3D point clouds from the earth surface. The advantages of using LiDAR system is the ability to work in any weather condition, laser penetration in vegetation, sands, and surface layers of snow as well as rapid data gathering for a large area. The laser source emits a pulse, the energy is reflected on the ground and sensed by a photodiode, the elapsed time is recorded. The laser range is computed by multiplying the elapsed time by the speed of light(Tong, Hong et al. 2012).
2. DAMAGE MAP GENERATION
Available techniques of damage map generation using Geo-Information data can be categorized into two different groups of visual interpretation and automatic processing. Although visual interpretation is an accurate method, it is time consuming and also need an expert to interpret the data. Therefore, researchers have focused on automatic processing techniques for generating damage map. Different automatic change detection techniques based on satellite images have been developed for earthquake damage assessment such as comparison satellite images in two epochs of pre and post-event and shadow analysis of buildings.
A number of studies have investigated the use of remote sensing data to detect earthquake damaged buildings. For instance, pre- and post-seismic stereo HRSI in two methods were used for generating damage map. First, detection of an individual collapsed building by comparing the height differences at the corner points of the building calculated from the pre- and post-seismic IKONOS stereo pairs and, in the second method, calculating the difference between the pre- and post-seismic digital elevation models (DEMs) collapsed buildings were detected in region scale (Tong, Hong et al. 2012). Another study from use shadow analysis method for detection of collapsed buildings after an earthquake by using high-resolution satellite images. (Tong, Lin et al. 2013).
Determines collapse building of the city of Bam, Iran, by using pre-event vector map and extracted spectral and textural features from post-event high resolution images (Samadzadegan, Zoj et al. 2010). detects collapse building by constructed digital surface models (DSMs) using aerial images captured by a digital airborne imaging system with GPS and IMU) DSM constructed from differences of building heights between pre and post- event models(Maruyama, Tashiro et al. 2011). Generated Point clouds from airborne oblique images, to detect damaged building (Vetrivel, Gerke et al. 2015). applied pre and post-event data for damage map generation after earthquake through a fuzzy inference system(Rastiveis, Samadzadegan et al. 2013). detected damaged building by using post-disaster LiDAR data with slope and texture of roof planes(Labiak, Van Aardt et al. 2011).
detected damaged building using laser scanning data based on the comparison of pre-event building models composed of planar surfaces with planar surfaces, extracted from laser scanning data.(Rehor and Bأ¤hr 2007). Aerial images and LIDAR data to detect disaster changes (Trinder and Salah 2012).
3. PROPOSED METHOD
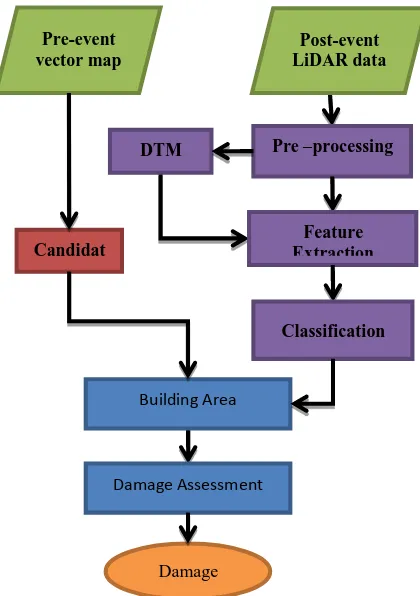
The framework of the proposed approach is based on the flowchart shown in Fig. 1. As can be seen from the figure, in this method, pre-event vector map and post-event LiDAR data are required for generating damage map. Initial step is pre-processing of LiDAR data. Then extracting textural features along with nDSM from LiDAR data, classification of the post-event image is performed. Finally, building areas are extracted from the
resulted classification image to evaluate the degree of damage and, consequently damage map generation.
Fig. 1. Flowchart of the proposed method for damage map generation using pre-event vector map and post-event LiDAR
3.1 Pre-Processing
A set of pre-processing algorithms is necessary in order to prepare input data. First of all increasing quality of the LiDAR DSM with histogram equalization and higher quality of extracted features which leads to higher classification accuracy.
The second step here is registration between LiDAR data and vector map. It needs some ground control point. This registration helps to eliminate shift and drift errors of LiDAR data.
3.2 Feature Extraction
It is proved that feature vector have direct influences on classification accuracy. Since textural information make better distinction between “debris” and “intact building” classes, different textural features are applied during the classification. In the proposed method, two kinds of feature have been used in classification: textural information and nDSM.
3.2.1 Textural Information
map generation in many researches. (Samadzadegan, Zoj et al. 2010).
GLCM is a matrix that contains the number of each grey level pairs that are located at distance d and direction θ Ng: Number of Gray levels R:Total Number of possible pairs Table (1) shows different descriptors that can be extracted from co-occurrence matrix.
Table (1) Extracted Features from Co-occurrence matrix
3.2.2 nDSM
Another feature that can be used in the classification process is nDSM which is made from LiDAR data and DTM. To generate nDSM both DTM and DSM of an area are needed. Here, first DTM is generated from LiDAR data using morphological operators and subtracting from LIDAR DSM, nDSM can be generated. The process of generating DTM based on image reconstruction by morphological geodesic operation. Geodesic operations employ two input images. The images are named marker and mask images. Here, DSM takes as mask and marker is created from mask, and then performs geodesic dilation to generate DTM generated from mask and marker. This method has great accuracy to make DTM. After all nDSM is created from difference of DSM and DTM.
Receiving great accuracy possible with use more feature. This article uses all of this information as feature to enhance accuracy.
3.3 Classifications
There are many methods for image classification such as SVM, Nearest Neighbour, Maximum Likelihood, Minimum Distance, etc. But, nowadays the scientist interested in to use SVM for classification, because it has much ability with good accuracy as well as rapid process. The Support Vector Machine (SVM) is a non-linear approximation that is a method for binary classification. For finding hyperplane that separates the d-dimensional data into two classes. The points nearest to the separating hyperplane are called Support Vectors. And, just determine the position of the hyperplane. Other points are no affection. SVM use kernel feature space that transmits the data into higher dimensional space and the data can be linearly separable there.
Fig.2. Choosing the optimum hyperplane which maximizes the margin.
Let l training samples {xi , yi} , i=1,…,l, and (xiϵ Rd) Parameterized hyperplanes by a vector (w) → w. x+ b=0.
Hperplane (w,b) that separates the data → f(x)=sign(w. x+b)by a distance +1,-1
For obtaining geometric distance magnitude of w must be normalized by,
Minimizing w by Lagrange multipliers
1 1 1
( ( . ) 1) 0,( ) i y w xi i b i
If we have optimal α should determine b to fully specify the hyperplane.(Joachims 2002)
( . ) 1 1
( . . )
2
( . ) 1
w x b
b w x w x
w x b
(6)
In this classification process, three classes of “debris”, “intact building” and “unclassified” are considered.
3.4 Building Area Extraction
In this step, corners of a candidate building are extracted from vector map and are mapped on LiDAR data to find all pixels in the classification results which belong to the building. By analysing the number of pixels which belong to intact part or debris the building situation can be estimated.
3.5 Damage Assessment
After classification, DD (damage degree) for each candidate building is estimated based on the relation between the number of pixels labelled as “debris” class to the whole building area (Eq. 7).
number of pixels to debris to class DD
number of pixels inside the building area
(7
)
Calculating the damage degree for each candidate building and considering a threshold level on DD, finally, damaged and undamaged buildings can be distinguished and damage map can be generated.
4. TEST AND RESULTS
4.1 Data Set
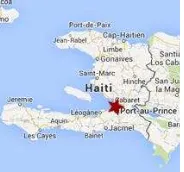
The study area is located in Port-au-Prince is the capital and largest city of the Caribbean country of Haiti. (Fig3).
Fig.3. The study area is located in Port-au-Prince is the capital of Haiti
This article use pre-event vector map (a) and post-event LiDAR data (b) and test area contains 43 building
a b
Fig.4. The study area (a) vector map (b) LiDAR data
4.2 Feature Extraction
After implement all features only six features were suitable for classification because they made a better difference between debris and intact building. Table (2) shows all the selected textural features that used in classification.
Contrast Second Moment Dissimilarity
Homogeneity Entropy Variance
Table (2) texture features
Extracted nDSM which is used in classification is depicted in Fig. 6.
Fig.6. Extracted nDSM in feature extraction step.
4.3 Classifications
Fig.7 classification result. Red: debris class. Green: intact building
4.4 Damage Map
In the proposed methods, depending on the damage degree, each building is shown by a specific color. In this paper, damage degree of 30% considered as threshold value. In other words, buildings with higher damage degree than 30% are labelled as damaged building. Otherwise, the buildings are labelled as intact building. Fig.8 demonstratesfinal damage map of the test area using the proposed method. As can be seen from the figure, damaged and intact buildings are shown in red and cyan color, respectively.
Fig.8 Resulted damage map using proposed method.
4.5 Accuracy Assessments
Confusion matrix of the classification, which can be seen in Table 3, is obtained by comparing the algorithm results and the reference data. In this algorithm, overall accuracy of 91.59%, kappa coefficient of 71.61 %, were obtained.
Confusion Matrix Algorithm
Debris Undamaged
Re
Table (3) Confusion Matrix
To evaluate the final damage map, all the buildings in the test area were labelled as damaged or undamaged by visually interpretation of post-event high resolution satellite imagery comparing these results with output of the algorithm, Table (4) were obtained.
Confusion
According to Table (4) 9 damaged buildings were labelled as damaged while only 5 damaged buildings were distinguished by expert. In other words, 4 false alarms were resulted by the algorithm. On the other hand, all the buildings which labelled as damaged by the experts distinguishing debris and intact buildings. Finally, 91 buildings in the test area were correctly labelled as damaged/undamaged. Although the results were promising, further studies are needed to improve the final decision, especially to reduce the number of false alarms.
REFERENCES
Joachim's, T. (2002). Introduction to support vector machines, Cambridge University Press, Cambridge. Labiak, R. C., J. A. N. Van Aardt, et al. (2011). Automated method for detection and quantification of building damage and debris using post-disaster LiDAR data. SPIE Defense, Security, and Sensing, International Society for Optics and Photonics.
Maruyama, Y., A. Tashiro, et al. (2011). "Use of digital surface model constructed from digital aerial images to detect collapsed buildings during earthquake." Procedia Engineering 14: 552-558.
Rastiveis, H., F. Samadzadegan, et al. (2013). "A fuzzy decision making system for building damage map creation using high resolution satellite imagery." Natural Hazards and Earth System Sciences 13(2): 455.
Samadzadegan, F., M. J. V. Zoj, et al. (2010). "Fusion of GIS data and high-resolution satellite imagery for post-earthquake building damage assessment."
Tong, X., Z. Hong, et al. (2012). "Building-damage detection using pre-and post-seismic high-resolution satellite stereo imagery: a case study of the May 2008 Wenchuan earthquake." ISPRS Journal of Photogrammetry and Remote Sensing 68: 13-27. Tong, X., X. Lin, et al. (2013). "Use of shadows for detection of earthquake-induced collapsed buildings in high-resolution satellite imagery." ISPRS Journal of Photogrammetry and Remote Sensing 79: 53-67. Trinder, J. and M. Salah (2012). "Aerial images and LiDAR data fusion for disaster change detection." ISPRS Annals of Photogrammetry, Remote Sensing and Spatial Information Sciences 1: 227-232.