MONITORING OF WET SNOW AND ACCUMULATIONS AT HIGH ALPINE
GLACIERS USING RADAR TECHNOLOGIES
A. Wendleder a, A. Heilig b, A. Schmitt a, C. Mayer c a
German Aerospace Center (DLR), German Remote Sensing Data Center (DFD), Oberpfaffenhofen 82234 Weßling, Germany – [email protected], [email protected]
b
University of Heidelberg, Institute of Environmental Physics 69120 Heidelberg, Germany – [email protected]
c
Bavarian Academy of Sciences and Humanities, Commission for Glaciology 80539 Munich, Germany – [email protected]
KEY WORDS: SAR, polarimetry, backscattering, classification, snow, snow mapping
ABSTRACT:
Conventional studies to assess the annual mass balance for glaciers rely on single point observations in combination with model and interpolation approaches. Just recently, airborne and spaceborne data is used to support such mass balance determinations. Here, we present an approach to map temporal changes of the snow cover in glaciated regions of Tyrol, Austria, using SAR-based satellite data. Two dual-polarized SAR images are acquired on 22 and 24 September 2014. As X and C-band reveal different backscattering properties of snow, both TerraSAR-X and RADARSAT-2 images are analysed and compared to ground truth data. Through application of filter functions and processing steps containing a Kennaugh decomposition, ortho-rectification, radiometric enhancement and normalization, we were able to distinguish between dry and wet parts of the snow surface. The analyses reveal that the wet-snow can be unambiguously classified by applying a threshold of -11 dB. Bare ice at the surface or a dry snowpack does not appear in radar data with such low backscatter values. From the temporal shift of wet-snow, a discrimination of accumulation areas on glaciers is possible for specific observation dates. Such data can reveal a periodic monitoring of glaciers with high spatial coverage independent from weather or glacier conditions.
1. INTRODUCTION
The Alpine snow cover and glacier ice are important water reservoirs for catchment areas (Verbunt et al., 2003; Schöber et al. 2014). Snow and glacier ice have different time scales for storage dynamics and can be compensatory or cumulative for catchment runoffs. Under certain conditions the release of liquid water from the cryosphere can contribute to a considerable hazard for human life and infrastructure in Alpine valleys (e.g. Parajka et al., 2010). In high alpine regions, a reliable assessment for runoff is particularly dependent on the determination of the spatial and temporal variability of the snowpack (Hall et al., 2012; Weingartner et al., 2003). Currently, the judgement of the impact of storage capacities of the cryosphere for runoff relies solely on point observations of snowpack parameter (mainly just snow depth) and glacier properties (ablation stakes) in combination with spatial interpolations and model assessments (Zemp et al., 2009). To overcome deficits in measurements of snow accumulation (in snow water equivalent SWE), in many cases simple parameterizations are applied to convert for accumulated masses from snow depths (Jonas et al., 2009; Schöber et al., 2014). However, precipitation regimes and winter accumulation are widely affected through changes in climate and temperature with the consequence of increased melt and extreme events even for high alpine sites (Barnett et al., 2005; Trujillo and Molotch, 2014). Though the question whether standardized routines can cope with such changes still remains debatable (Beniston et al., 2011), it is undoubted that the wide-area measurements provided by remote sensing techniques will increase the information basis both in spatial and temporal resolution. Spatial continuous data on e.g. liquid water appearances in snow, extent of snow covered areas are needed
to identify the melt extent or snow coverage on glaciers and catchment areas. Such data are used to monitor melt extent for large snow-covered areas (Nagler and Rott, 2000). In Greenland, for instance, records in surface melt for the Greenland ice sheet have frequently been observed within the last decade utilizing such data (Steffen et al., 2014; Tedesco et al., 2013). However, in Alpine areas with very complex topographies such attempts have been conducted only sparsely so far.
This paper aims at demonstrating the large potential of current radar-based satellite acquisitions to monitor changes in snowpack and snow coverage on glaciers even in mountainous regions. The challenges posed to the data pre-processing are huge and are only fulfilled with recent SAR sensors and novel processing techniques: exact knowledge of the sensor position during the image take, reliable high resolution digital elevation model of the imaged scene with accurate registration to an earth-fixed coordinate system, high geometric resolution of the SAR images, and last but not least a strategy for the combination of diversified SAR data in one consistent mathematical frame both geometrically and radiometrically. In addition, through combining satellite data with manual observations we were able to assess the accumulation area of glacierized areas for the whole Hinteres Oetztal in high spatial resolution. In comparison to single point measurements such data provide an enormous gain of spatial resolution.
2. TEST SITE AND DATA
2.1 Test site
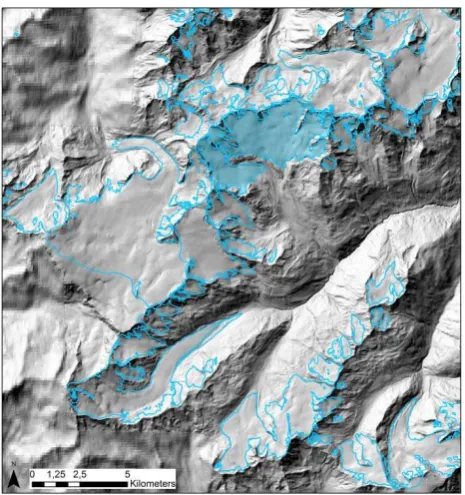
As test site the Vernagtferner located in the Hinteres Oetztal, Austria (46°51’ N 10°47’, Figure 1) is chosen for the mapping and monitoring of wet snow in the accumulation area. Vernagtferner is one of the largest glaciers in the Eastern Alps and is situated on an altitude between 2800 m and 3700 m. The glacier exhibits a long-term mass balance study with its beginning in 1964 (Mayer et al., 2013). Figure 1 displays a Digital Elevation Model (DEM) of the Hinteres Oetztal with the glacier boundaries of the surrounding glaciers (Abermann et al., 2012). The Vernagtferner is colored in blue.
2.2 Radar data
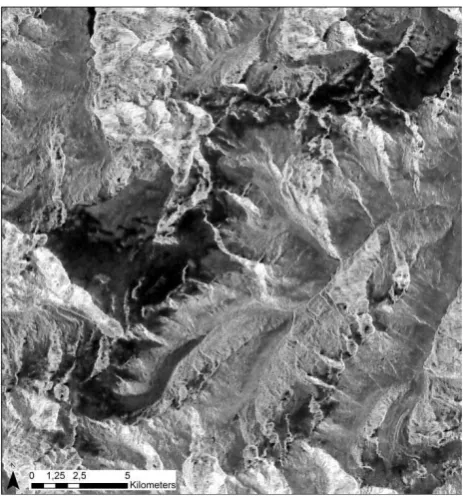
During the field campaign at the end of the accumulation season 2013/2014, a TerraSAR-X (TSX) image (22 September 2014, see Figure 2) and a RADARSAT-2 (RS2) image (24 September 2014, see Figure 3) were acquired. As X-band (9.6 GHz) and C-band (5.7 GHz) show different backscattering properties of snow, both, TerraSAR-X and RADARSAT-2 data are analysed and compared. Both images are cross-polarized (VV/VH). The TerraSAR-X images is acquired in the descending orbit with an incidence angle of 28°, whereas the RADARSAT-2 image is acquired in the ascending orbit with an incidence angle of 34°. Both are right-looking sensors
2.3 Digital Elevation Model
The DEM is used for the ortho-rectification process as well for the geometric calculations of the SAR data. As the geometric quality of the geocoded SAR data depends on the height accuracy and the resolution of the DEM, the best suitable DEM for the region is used. For the Hinteres Oetztal, the DEM of the
Austrian Glacier Inventory (Abermann et al., 2012) is used. The airborne laser scanning DEM has a spatial resolution of 10 m and was generated in 2006. For the area outside of Austria, the SRTM C-Band DEM (USGS release 2.0, acquired on 11.-22.02.2000) with a spatial resolution of 90 m is used.
3. METHODOLOGY
3.1 Kennaugh Decomposition
Different sensors are providing different data, not only in terms of data format, but also with respect to wavelength, acquisition geometry, geometric resolution, polarimetric combination, radiometric accuracy and so on. In order to combine SAR data acquired by different sensors, a common framework has to be defined in which all images can be transferred without significant loss of information. Though there exist some polarimetric decompositions that could possibly meet the requirement of radiometric comparability, we decided in favor of a very basic and versatile approach published recently by Schmitt et al. (2015). The polarimetric information kept in the complex layers VV and VH is transferred to the elements of the well-known Kennaugh matrix.
The total intensity then is represented by K0, while K1 stands for the intensity difference between the co-polarized and the cross-polarized layer. The phase differences contained in the complex signal are stored in the Kennaugh elements K5 and K8 which are not expected to show significant information over natural surfaces. Thus, the Kennaugh framework divides the signal into stable intensity information and more or less random phase information. With view to our studies mainly the total intensity of the signal given by K0 is of interest because it directly reflects the change in the dielectric constant of the illuminated snow cover that changes with its wetness (Nagler and Rott, 2000). The co-to-cross-polarized ratio in K1 might hold important information in the multi-frequency evaluation which will be subject to further studies.
3.2 Ortho-Rectification and Calibration
Variations between different sensors also include differences in acquisition geometry due to different orbits and consequently, a varying incidence angle which influences the radiometric properties of the targets. The key to generate comparable image data is the ortho-rectification of all images using a digital elevation model. In this case a mosaic of two elevation data sources has been used as described above. The Kennaugh elements represent intensity values which can easily be projected from slant range geometry (the focused complex image) to an earth-fixed coordinate system (e.g. UTM, with square pixels on ground). The consistent pixel spacing of 5 m requires an initial multi-looking of the TSX data of 2.5 by 2.1 looks (range by azimuth) in order to avoid aliasing effects while RS2 is just resampled using bilinear interpolation.
The next step is the radiometric calibration of the measured intensities. The imaged area per pixel consequently varies with the local incidence angle which results from the sensor position and the relief. This influence can be reduced by applying an approximation of the gamma correction published by Small (2011). The complete removal of the incidence angle impact unfortunately is not possible as the correction is only valid for distributed, isotropic and non-dispersive targets. However, for the target of interest “snow” the demands can be seen as fulfilled for the sake of simplicity.
A by-product of the geocoding process is the Geocoded Layover Shadow and Incidence Angle Mask (GIM, Huber et al., 2004). It has the same cartographic properties as the geocoded output image with regard to output projection and cartographic frame. This layer contains the information about the local terrain incidence angle for each pixel of the geocoded SAR scene and additionally indicates the presence of shadow and layover areas.
3.3 Image Enhancement
SAR data are known to include a high noise content showing both additive and multiplicative characteristics. Therefore, image enhancement is unavoidable in order to achieve smooth results. In most applications, standard speckle filtering algorithms with a fixed kernel size are used in order to reduce the influence of the multiplicative noise contribution. We prefer a novel image enhancement approach called scale multi-looking (Schmitt et al., 2014) which has been developed especially for the enhancement of Kennaugh layers acquired by different SAR sensors.
The basic idea of this approach is to adapt the local number of looks to the image content. For instance, a higher look number might be appropriate in a homogeneous environment (e.g. snow) while the minimal look number and therewith the maximum geometric resolution is necessary to adequately describe the single targets in a very heterogeneous environment (e.g. rock). The decision – which look number to use – is taken by the help of a novel perturbation-based noise model that combines both additive and multiplicative noise contributions in one and automatically adapts to the sensor and imaging mode characteristics via the delivered meta data. The result is a very smooth, but detail-preserving multi-looked SAR image representing the locally optimal trade-off between geometric resolution and radiometric accuracy.
3.4 Multi-temporal Image Combination
The high contrast in SAR intensity images challenges new normalization approaches that convert the original gamma-distribution into a Gaussian-like gamma-distribution. This step enables
the user to further apply standard evaluation techniques commonly used in optical remote sensing. For Kennaugh preprocessed data the normalization is simply realized by referencing each polarimetric information layer to the total intensity and expressing the total intensity in the Hyperbolic Tangent Scale (Schmitt et al., 2015). The normalized values are then convertible to the decibel unit widely-used in SAR remote sensing. With respect to single acquisitions the decibel values represent the logarithmic strength of the backscattering in case of K0. Regarding K1, they provide the logarithmic relation between surface/double and volume scattering strength.
Due to the wide range of SAR intensity values from around -25 dB for smooth specular surfaces and more than +10 dB for determinsitic targets, the relative change of the backscattering strength often is more interesting than the absolute single measurements (Schmitt and Brisco, 2013). This directly leads to the combination of multi-temporal image acqusitions in one image product showing the change from one acquisition time to another, the so-called differential Kennaugh elements. In terms of radiometry this is nothing else than the introduction of a new reference intensity in the Hyperbolic Tangent Scale, i.e. even the change – be it in intensity or even in polarimetry – can easily be expressed in the decibel unit. Thus, the chosen SAR preparation framework still is consistent even for multi-temporal image products.
In order to ensure maximum image quality the multi-scale multi-looking is applied directly on the combined image product instead of enhancing the single input images. In that way the best available intensity information summed up over both images can be used to derive to smoothing template – the look image – indicating the optimal look number for each location in the image. Hence, the locally optimal trade-off between geometric resolution and radiometric accuracy is guaranteed also for the differential Kennaugh element.
4. RESULTS AND DISCUSSION
4.1 Mapping wet snow
K0 image of TSX, respectively the K0 image of RS2. In both images, the areas in the upper part of the glaciers exhibit a lower backscatter than the surrounding area, probably due to wet snow. These areas are assumed to indicate the recent accumulation areas on the investigated glaciers.
4.2 Profile measurement
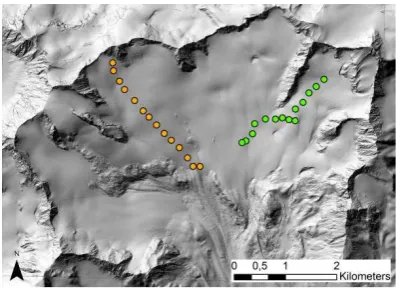
For a better discrimination between wet snow in the accumulation area and snow-free ablation area of the glacier, two spatial profiles are set along the Vernagtferner. Figure 4 displays the location of the profiles. One of the profiles is located on the western part of the glacier near Sexenjoch (orange points); the other one is located in the eastern part of the glacier near Hinterer Brochkogel (green points).
Figure 5 and Figure 6 illustrate the backscatter values of the TSX image (blue) in dependence of the altitude along the profiles, respectively the backscatter values of the RS2 image (red). In Figure 5, the decline of the backscatter values between the survey points 216 (3100 m) and 215 (3132 m) is conspicuous in the TSX image and the RS2 image. For the points 223 - 216, the backscatter values of the TSX image range from -3 dB to -8 dB, whereas the backscatter values of the RS2 image range from -7 dB to -10 dB. The different values originate from the different backscatter properties of X- and C-band. The area between 2904 m and 3100 m can be attributed to snow-free areas of the glacier. For the points 215 – 210, the backscatter values of the RS2 image range from 11 dB to -16 dB. Due to the layover effect in the TSX image, the measurements for the points 214 - 210 are not reliable and hence these values are eliminated. The elevation ranges above 3100 m represent the accumulation area as verified by field data. In correspondence to Figure 5, in Figure 6 the decline of the backscatter values between the points 192 (3159 m) – 191 (3175 m) is evident. The backscatter values of the TSX image for the points 199 – 193 ranges from -5 dB and -9 dB, whereas the values of RS2 image ranges from -5 dB and -10 dB. Hence, the area between 2994 m and 3159 m display the snow-free ablation zone. The backscatter values of TSX and RS2 image for the points 191 – 187 for wet snow are very similar and vary from -11 dB to -14 dB. In the TSX image, the outlier at point 189 is more distinctive than in the RS2 image and can be explained by locally dry snow due to the topography. Consequently, the accumulation area is above 3159 m.
4.3 Spatial measurement
By the help of the German TerraSAR-X and the Canadian RADARSAT-2 synthetic aperture radar (SAR) satellite we map the transition of dry to wet snow at the surface. This is done by comparing the geocoded and calibrated backscattering intensities in X-band (TerraSAR-X) and C-band (RADARSAT-2) along time series of acquisitions. According to Nagler and Rott (2000) the change of -3 dB in the backscattering over snow covered areas refers to the transition from dry to wet snow. The observation system presented in this article enables for the first time an area-wide measurement of this change in a spatially (up to 3 m) and temporally dense (at least 11 d) manner. As neither weather nor deficient illumination may distort the image acquisition of these active systems, the only limiting factor is the system utilization which is very high over central Europa in the case of TerraSAR-X. This weakness is balanced by including a second satellite sensor: RADARSAT-2.
Additionally, the synergies resulting of the multi-frequency combination of SAR images might provide a deeper view into the characteristics of the imaged snow cover. Especially with respect to the polarization combination VV/VH used in this
study which is capable to discriminate between deterministic (mainly surface) and diffuse volume scattering caused by many slight difference in the wavelengths (3 cm to 5 cm) the sensors show different sensibilities with respect to the size of the backscattering dipoles. This might allow for a further differentiation of rates of snow accumulations in the future. The evaluation of the two profiles on the Vernagtferner demonstrates that the discrimination between accumulation area covered by wet snow and snow-free ablation area is possible. Therefore, the threshold of -11 dB is identified. In the next step, the threshold is applied for the Hinteres Oetztal. As both sensors exhibit similar backscatter properties for wet snow, the information of TSX and RS2 are combined using the intersection. In order to avoid misclassification due to radar shadow and layover effects, the affected pixels are eliminated with the help of the GIM.
Figure 4. Laser DEM of Vernagtferner with the two profiles near Sexenjoch (orange points) and Hinterer Brochkogel (green points)
Figure 5. Profile near Sexenjoch (orange points in Figure 4) with the backscatter values of TSX image in blue and the backscatter values of RS2 image in red. Survey point 223 is located at 2904 m altitude, point 210 at 3260 m.
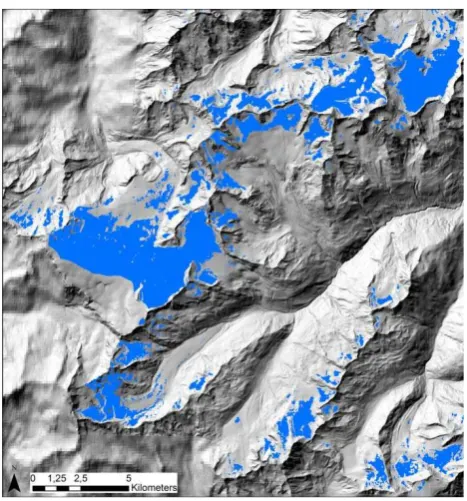
Figure 7 delineates the accumulation area of Hinteres Oetztal. The overlap with the glacier boundaries of the third glacier inventory of North Tyrol acquired with Airborne Laser Scanning in the year 2006 (Abermann et al., 2012) shows a good accordance. Despite the time difference of two days between the TSX and the RS2 imagery, the snow conditions were very stable and hence, both classification results show a good accordance. In contrast to the surrounding glaciers, the upper part of the accumulation area of the Vernagtferner could not completely classified, which is due to the radar effects. The usage of SAR images acquired in different orbits and with different incidence angles could avoid the missing classifications. Nevertheless, these steps show that SAR data can be used as indirect method for the mapping and monitoring of wet snow and accumulations for large and remote areas.
5. CONCLUSION
Our technique containing the Kennaugh decomposition, ortho-rectification, radiometric enhancement and normalization is universally applicable for multi-sensor, multi-polarized and multi-temporal SAR data. It provides important and meaningful information for the monitoring and mapping of wet snow and for estimating spatial extent of accumulation areas for large Alpine glaciers. The analyses reveal that the wet-snow zone can be classified applying a threshold of -11 dB. To map accumulation areas per year utilizing SAR data the only precondition is that the residual snow coverage is consisting of a wet snowpack. This is usually the case at the end of the respective ablation period. Contrary to conventional mass balance methods using single point measurements, SAR data provide spatial information for the whole Hinteres Oetztal.
Object of further studies will be an analysis how the accuracy of the mass balance can be increased by using the accumulation area derived of SAR data and the discrimination of different snow covers using the K1 element of the Kennaugh decomposition.
ACKNOWLEDGEMENTS
TerraSAR-X data are obtained via the science proposal HYD2385 and the RADARSAT-2 data via the proposal 21017.
REFERENCES
Abermann, J., Seiser, B., Meran, I., Stocker-Waldhuber, M., Goller, M., Fischer, A., 2012. The third glacier inventory of North Tyrol, Austria, for 2006.doi:10.1594/PANGAEA.806960.
Barnett, TP., Adam, JC., Lettenmaier, DP., 2005. Potential impacts of a warming climate on water availability in snow-dominated regions. Nature 438(7066), pp.303–309. doi: 10.1038/nature04141.
Beniston, M., Stoffel, M., Hill, M., 2011. Impacts of climatic change on water and natural hazards in the Alps: Can current water governance cope with future challenges? Examples from the European. ACQWA” project. Environmental Science & Policy 14(7), pp.734–743. doi: 10.1016/j.envsci.2010.12.009.
Hall, DK., Foster, JL., DiGirolamo, NE., Riggs, GA., 2012. Snow cover, snowmelt timing and stream power in the Wind River Range, Wyoming. Geomorphology 137(1), pp. 87–93. doi: 10.1016/j.geomorph.2010.11.011.
Huber, M., Hummelbrunner, W., Raggam, J., Small D., Kosmann, D., 2004. Technical aspects of Envisat-ASAR geocoding capability at DLR. In: Proc. of ENVISAT and ERS Symposium, Salzburg, Austria.
Jonas, T., Marty, C., Magnusson, J., 2009. Estimating the snow water equivalent from snow depth measurements in the Swiss Alps. Journal of Hydrology 378(1-2), pp.:161–167. doi: 10.1016/j.jhydrol.2009.09.021.
Mayer, C., Lambrecht, A., Blumthaler, U., and Eisen, O., 2013. Vermessung und Eisdynamik des Vernagtferners, Ötztaler Alpen, Zeitschrift für Gletscherkunde und Glazialgeologie, vol. 45–46, pp. 259–280, 2013.
Nagler, T., Rott, H., 2000. Retrieval of wet snow by means of multitemporal SAR data. IEEE Trans. Geosci. Remote Sensing 38(2), pp.754–765. doi: 10.1109/36.842004.
Parajka, J., Blöschl, G., 2008. The value of MODIS snow cover data in validating and calibrating conceptual hydrologic models. Journal of Hydrology 358(3-4), pp. 240–258. doi: 10.1016/j.jhydrol.2008.06.006.
Parajka, J., Kohnová, S., Bálint, G., Barbuc, M., Borga, M., Claps, P., Cheval, S., Dumitrescu, A., Gaume, E., Hlavčová, K., Merz, R., Pfaundler, M., Stancalie, G., Szolgay, J., Blöschl, G., 2010. Seasonal characteristics of flood regimes across the Alpine-Carpathian range. Journal of Hydrology 394(1-2):78–89. doi: 10.1016/j.jhydrol.2010.05.015.
Schmitt, A., Brisco, B., 2013. Wetland Monitoring Using the Curvelet-Based Change Detection Method on Polarimetric SAR Imagery. Water 5, no. 3, pp. 1036-1051.
Schmitt, A., Wendleder, A., Hinz, S., 2015. The Kennaugh element framework for scale, polarized, multi-temporal and multi-frequency SAR image preparation. ISPRS Journal of Photogrammetry and Remote Sensing, April 2015, vol. 102, pp. 122-139. ISSN 0924-2716, http://dx.doi.org/10.1016/j.isprsjprs.2015.01.007.
Schöber, J., Schneider, K., Helfricht, K., Schattan, P., Achleitner, S., Schöberl, F., Kirnbauer, R., 2014. Snow cover characteristics in a glacierized catchment in the Tyrolean Alps - Improved spatially distributed modelling by usage of Lidar data. Journal of Hydrology 519, pp. 3492–3510. doi: 10.1016/j.jhydrol.2013.12.054.
Small, D., 2011. Flattening Gamma: Radiometric Terrain Correction for SAR Imagery. Geoscience and Remote Sensing, IEEE Transactions on Geoscience and Remote Sensing, Aug. 2011, vol. 49, no. 8, pp. 3081 – 3093. doi: 10.1109/TGRS.2011.2120616.
Steffen, K., Nghiem, S. V., Huff, R., Neumann, G., 2004. The melt anomaly of 2002 on the Greenland Ice Sheet from active and passive microwave satellite observations. Geophys. Res. Lett. 31(20). doi: 10.1029/2004GL020444.
Tedesco, M., Fettweis, X., Mote, T., Wahr, J., Alexander, P., Box, JE., Wouters, B., 2013. Evidence and analysis of 2012 Greenland records from spaceborne observations, a regional climate model and reanalysis data. The Cryosphere 7(2), pp. 615–630. doi: 10.5194/tc-7-615-2013.
Trujillo, E., Molotch, NP., 2014. Snowpack regimes of the Western United States. Water Resour. Res. 50(7), pp. 5611– 5623. doi: 10.1002/2013WR014753.
Verbunt, M., Gurtz, J., Jasper, K., Lang, H., Warmerdam, P., Zappa, M., 2003. The hydrological role of snow and glaciers in alpine river basins and their distributed modeling. Journal of Hydrology 282(1-4), pp. 36–55. doi: 10.1016/S0022-1694(03)00251-8.
Weingartner, R., Barben, M., Spreafico, M., 2003. Floods in mountain areas—an overview based on examples from Switzerland. Journal of Hydrology 282(1-4), pp. 10–24. doi: 10.1016/S0022-1694(03)00249-X.