STUDY OF CITY LANDSCAPE HERITAGE
USING LIDAR DATA AND 3D-CITY MODELS
P. Rubinowicz, K. Czyńska
Cyber Urban Center, Faculty of Civil Engineering and Architecture West Pomeranian University of Technology Szczecin, Poland
Commission VI, WG VI/4
KEY WORDS: Urban Landscape Protection, LIDAR Data, 3D City Models, CityGML, Computational Urban Analysis, Tall Buildings
ABSTRACT:
In contemporary town planning protection of urban landscape is a significant issue. It regards especially those cities, where urban structures are the result of ages of evolution and layering of historical development process. Specific panoramas and other strategic views with historic city dominants can be an important part of the cultural heritage and genius loci. Other hand, protection of such expositions introduces limitations for future based city development. Digital Earth observation techniques creates new possibilities for more accurate urban studies, monitoring of urbanization processes and measuring of city landscape parameters. The paper examines possibilities of application of Lidar data and digital 3D-city models for: a) evaluation of strategic city views, b) mapping landscape absorption limits, and c) determination protection zones, where the urbanization and buildings height should be limited. In reference to this goal, the paper introduces a method of computational analysis of the city landscape called Visual Protection Surface (VPS). The method allows to emulate a virtual surface above the city including protection of a selected strategic views. The surface defines maximum height of buildings in such a way, that no new facility can be seen in any of selected views. The research includes also analyses of the quality of simulations according the form and precision of the input data: airborne Lidar / DSM model and more advanced 3D-city models (incl. semantic of the geometry, like in CityGML format). The outcome can be a support for professional planning of tall building development. Application of VPS method have been prepared by a computer program developed by the authors (C++). Simulations were carried out on an example of the city of Dresden.
1. DIGITAL IMAGING OF A CITYSCAPE In recent years, there has been an increasing demand for applications which employ 3D models of Earth including natural and urbanized areas, in order to recreate a realistic and immersive virtual environment. The progress in geo-information research and related development of new techniques enable improvement in modelling of realistic 3D models for cities entirely from remote sensor data captured by an airborne LIDAR scanner, and present a fast and automatic method for the reconstruction of the 3D models (Poullis and You, 2009; Verma et.al. 2006). The use of such models has already been successfully employed in developing infrastructure and services, commercial sector and marketing, promotion and collecting information about cities (e.g. promotion, tourism, visualizations for investors, etc.). To a certain extent, they are also used for selected specialist analyses (e.g. acoustic analysis, simulation of disasters and traffic management) (Moser 2010, Pal Singh et. al., 2013). To a lesser degree, virtual models are used directly and efficiently in urban and spatial planning practice and related to them advanced urban analysis. According to the experience of the authors it is still a growing area of application.
Better accessibility to spatial information (e.g. remote sensor data from airborne LIDAR scanner) for certain contributes to widening of potential applications. While using the Digital Surface Model (DSM) and available GIS software (e.g. ArcGis with 3D Analyst or free QGIS with GrassGIS) it is possible to develop a number of analyses of urban areas that can be useful
in urban planning (Czyńska, 2014). This usually applies to larger sections of cities when images of their structures are simplified and reduced to for instance raster space images (e.g. viewshed analyses) (fig. 1b). A number of city landscape analyses require more detailed overview of their buildup area. Distinguished architectural facilities play a key role for the perception of a city. These usually include tall and historical buildings which, within certain views, contribute to a typical city skyline. Reflecting the skyline in a virtual environment is crucial for the precision of analyses. Vector 3D models (LoD2 and LoD3) properly record the geometry of buildings. A comparison of the precision of imaging using 3d models based on Dresden, Germany, has been presented in figure 1. The key issue for further development in the field is introducing of CityGML as an open standard for data recording (Kolbe, 2009).
2. CITYSCAPE, TALL BUILDING AND STRATEGIC VIEWS
harmonious completion, well fitted into urban structures (McNeill, 2005). For this reason, it is important to diagnose precisely the future impact of new buildings on that landscape.
In many European cities, we may notice planning mistakes as regards locating tall buildings (fig. 2). Many of them result from the fact that it was not possible to foresee consequences of new investment. A flagship example is the Montparnasse building in Paris, which deteriorated the symmetrical composition of Champ de Mars. In the second half of the 20th c., in London, a number of projects were implemented which irreversibly changed the skyline of the city seen from the River of Thames, and squandered a change for creating a harmonious image of the city. The issue of tall buildings in the 21st c. is still valid due to their popularity. Tall buildings are developed not only in larger cities in Europe, but also in medium-sized ones (e.g. Nurnberg, Szczecin and Malmo). The trend is also present in Scandinavian cities which so far maintained their centers free from tall buildings (e.g. Helsinki, Stockholm and Copenhagen).
2.2 Protection of strategic views
What can be done to counteract the growing degradation of valuable historical urban landscapes? Several cities have developed methodologies to provide guidance for selecting locations of tall buildings. The system of supervision developed for the London landscape is in the forefront. A comprehensive system of assessing and selecting city views was developed supported with detailed description of advantages of the
existing landscape which needs to be protected (Seeing the history in the view, 2011). This is accompanied by a system of verifying planned tall buildings by simulating their impact in selected strategic views: London Panoramas, River Prospects, Townscape Views and Linear Views (London View Management Framework, 2012). Similar guidelines for protecting landscapes have also been prepared for such cities as Ottawa (Canada’s Capital Views Protection, 2007), Cologne (Hochhauskonzept Köln, 2003), Warsaw (Oleński, 2008), Milano (Piga et.al., 2012) and many others.
The majority of systems referred to protect specific strategic views of a city. In the planning process, a new investment is verified by examining its visual impact in specific views. However, without dedicated and precise tools results of such simulations can hardly be objective and reliable. Therefore, there is a need for developing a scientifically proven methodology (Czyńska, 2007). Research methods developed by the authors enable among others analyzing the visual range and impact of planned buildings (Visual Impact Size method) or simulations with height lines (Czyńska, 2014, 2010). New analytical techniques have been successfully used in planning practice in two Polish cities: Szczecin (Czyńska et. al., 2007) and Lublin (Czyńska et. al., 2011). New tools are developed under a research project of 2TaLL: ‘Application of 3D virtual city models in urban analyses of tall buildings’.
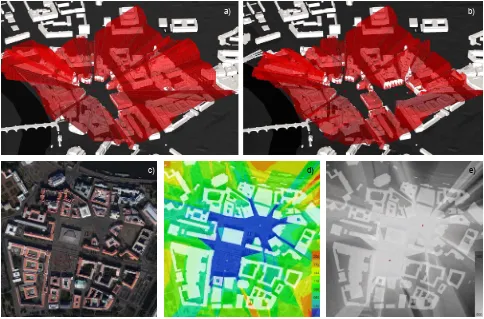
Figure 1. Methods and precision of city modelling – example of Dresden: a) TIN model based on airborne LIDAR data; b) raster model, cell size: 1m; c) LoD2 vector model; d) LoD3 vector model with building
Figure 2. Deterioration of historical square in Brussels (Place des Barricades) surrounded by tall buildings (photo by authors)
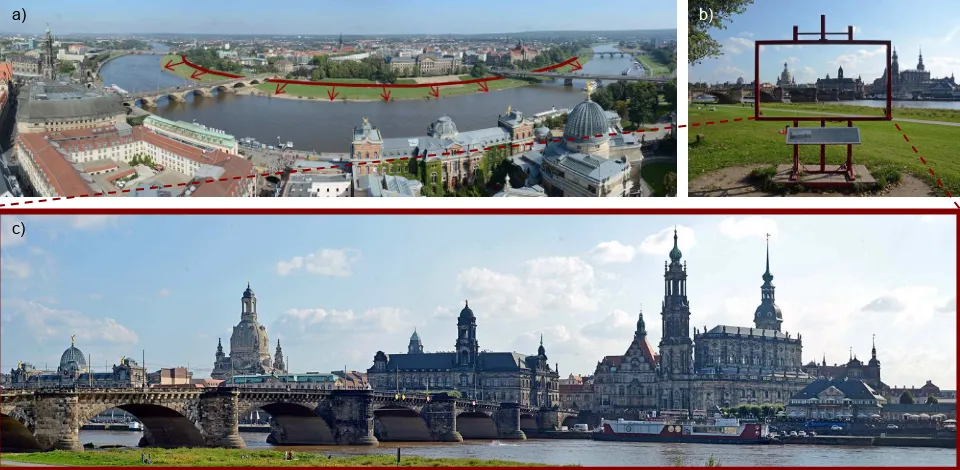
One of cities covered by the 2TaLL project is Dresden, Germany. It is a unique city in Europe of special landscape values. Its skyline consists of historical buildings (mainly rebuilt or built anew after war; fig. 3). Those buildings are spread over a distance of about 2km as seen from the side of boulevard on the other side of the Elbe River. People can admire old town dominants grouped at Brühl's Terrace, referred to as the ‘Balcony of Europe’ from a popular leisure area (fig. 3a). The contemporary landscape of the city is almost identical to that of the middle of the 18th c. in paintings by Canaletto. Those historical images were used while designing the development of boulevards. An observation point was established in a precisely selected location. It has a form of an easel which frames a panoramic view familiar from pictures by Canaletto (fig. 3b,c; 4). The Baroque panorama of the city is a cultural value in itself and a starting point for restoring the old greatness of the city.
The unique silhouette of Dresden requires significant effort to preserve it in its unchanged form. In the background, behind a baroque facade, we have the modern part of the city with its specific needs. Protection regulations prevent any new investment from extending above the current skyline. Since there are many protected view locations spread along a vast area (view areas and space along river and on bridges), a major part of the city is subject to specific regulations pertaining to new buildings. Visual relations are not very much intuitive. The Visual Protection Surface method (VPS) presented in the article is designed to provide geometrical analysis. It enables defining maximum height of buildings I relation to the protected development. A VPS surface resulting from the analysis helps formulating guidelines for new investment so it does not disturb integrity of the historical silhouette.
Figure 3. Panorama of Dresden from river side, exposing most important historical elements of city landscape:
a) view from Frauenkirche roof on pedestrian area long river; b) observation point in form of easel referring to painting by Canaletto of 18th c.; c) contemporary city panorama – photograph of 2014 (photos by authors)
Figure 4. Arrangement of an observation point on northern bank of river with copy of 18th c. Dresden panorama
painting by Canaletto
3. VISUAL PROTECTION SURFACE METHOD (VPS) 3.1 Objectives and goals of VPS method
In contemporary urban planning, the implementation of objectives pertaining to the protection of the urban landscape concentrates on preserving views that are important for the identity of the city – described as strategic views. The method is commonly applied in various studies. It is also a basis for formulating planning objectives, determining the framework for developing a new urban substance. The protection of views might be total or partial. In the first instance, new development will be allowed to interfere with the view. In the second instance, new investment will require additional studies. Frequently protection measures cover sequences of views, e.g. Dresden, which are examined in greater detail in this article.
a) b)
The protection of strategic views translates into limitations to contemporary development plans for the city. Mutual relations between those elements were the basic objective for developing the VPS method. An overall objective of the method is to determine the absorption capacity for new tall buildings, while assuming full protection of certain strategic views. Such defined research problem enables obtaining clear, complex and intuitive result. VPS analyses may support investment decisions for a given city, including possibility of locating tall buildings, while applying landscape protection measures.
3.2 Computation of VPS surface
The determining of the VPS surface is based on a relatively simple geometrical process. In general, it involves studying visibility of specific sets of points. Input data include coordinates for the set of strategic views. The result is the surface above the city which defines maximum height of buildings to avoid any of new buildings to be seen within strategic views. Calculations are based on a digital 3D city model. The algorithm determines the height of the surface for a given point in the city at the precision level of 15cm. The difficulty of the method is major complexity of data that need to be processed. Finally, the optimization of the calculation process is crucial.
The research presented in the article was based on the software developed by the authors (C++). The program uses CityGML
data (while applying standard semantics to optimize calculation) and surface and development models (DTM, DSM). A general principle for determining the VPS surface can be seen in the example in figure 5 for a section of Dresden city center. The analysis is theoretical and can be used for the presentation of the method. In this particular case, protection was expected to cover views from two public squares in the heart of the city close to Frauenkirche (fig. 5 a and b). The resulting VPS surface is first built for one and then two squares (1 or 2 strategic points). The assumption of the simulation was a strict protection of landscape inside the urban landscape within pre-determined view points.
In case of an individual strategic protected point, VPS is a ruled surface (fig. 5a). The surface sets a boundary between visible and not visible parts of buildings. It is a form of a geometrical echo of existing buildings. It remain unseen and sets the height limit for new buildings. The VPS emulation for individual points is available in the ESRI application (3d Analyst / ArcGIS, skyline barrier tool). However, the analysis combining results for several strategic points is more difficult. The shape of the VPS surface is then more complex. For this reason, optimization of the calculation process (capacity and time required by process versus unsatisfactory precision of results) and adjusting the procedure to cover multiple points are important for the VPS emulation.
Figure 5. Calculating VPS surfaces for 2 squares in Dresden: a) VPS for single view point, b) VPS for two view points; c) ortophotomap of section of Dresden with points marked; d, e) VPS map defining height limits for new buildings
a) b)
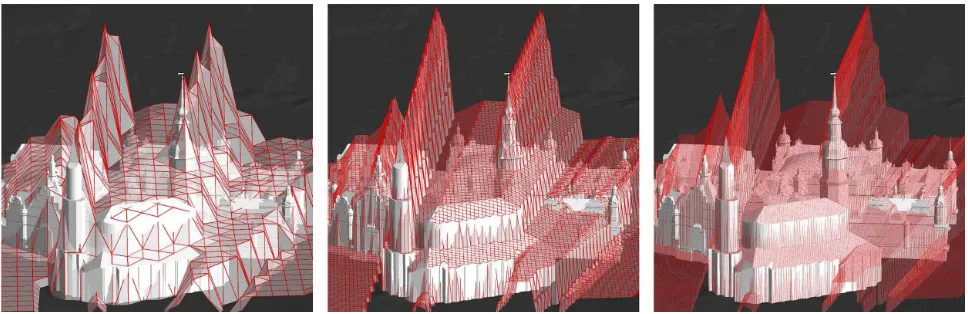
Figure 6. VPS imaging as 3d surfaces in different precision scale
3.3 Visualization of VPS
Imaging of the VPS analysis is possible in the form of a 3d vector surface (fig. 5 a and b) as well as 2d map with differentiated colors (fig. 5 c and d). In this particular case, the shade of a color corresponds to maximum permitted height of buildings where new investment does not interfere with the landscape. The most intensive colors mark locations for possibly the tallest buildings (fig. 5c – color close to black, fig. 5d – shades of red). The number of height ranges and their colors can be adjusted as needed for their interpretation. The height analysis in question covered height levels between 0 to 200m above ground level.
The quality of results depends obviously on the precision of the 3d city model. On the one hand, reliability of height and form of buildings reflected in the model, in particular facilities important for the city landscape, such as historical dominating towers, is crucial for the entire process. On the other hand, precision of VPS can be adjusted. Figure 6 presents examples of the mesh size possible for emulation. The precision translates into the time of emulation. Therefore, possibility of adjusting the factor can be important. Imaging of VPS surfaces in the vector forms is important for examining spatial relations in the city. However, the complexity of the surface is increasing with the number of strategic views. The larger views are covered, the clearer is the 2d map as a form of VPS imaging.
4. CASE STUDY OF VPS FOR DRESDEN 4.1 Scope and objectives
Possibilities for using the VPS method in urban planning can be examined based on more complex analyses of real city space. For the purpose of the article, preliminary studies were performed for Dresden. Landscape values of the city have been presented above (see 2.2, fig. 3). An obvious value of the city is its historical skyline, comprising building along the Brühl's Terrace. The objective there is the provide a strict protection of the skyline by preventing any new architectural facilities being developed in the panorama seen from the level of a boulevard on the River Elbe. Conservations of those views imposes certain limitations to new investment. The objective of the VPS analyses is to determine absorption capacity of the landscape as regards new buildings and finding an answer to the following question: Is it possible to build new tall buildings (200, 100, 50m) that would not interfere with the skyline? Which parts of
the city are particularly susceptible to new investment and where are still possibilities for increasing the height of new buildings?
VPS simulations covered the center of Dresden between Elbe and the main railway station. This section of 6.25km2 is enclosed within a square of 2.5x2.5km. The size of the area concerned was limited due to accessibility of digital data. Nevertheless, it is large enough to enable examining spatial relations within a radius of 1.5km from the river (which is significant for landscape analyses). The scope of protection covered panoramic views of boulevards on the River of Elbe, on its stretch of 1.5km between bridges of Marienbruecke and Albertbruecke (fig. 7). While moving along the area, relations between dominants comprising the baroque skyline change. The view from each point is different, which is reflected in results of the VPS simulation. To reflect actual conditions, 40 strategic points were taken into consideration, with spacing of 35-40m. The analysis was based on the 3d model of Dresden in the LoD2 CityGML format, digital terrain model DTM (grid of 5.0m) and the DSM model based on irregular grid (grid 1m).
4.2 Interpretation of VPS simulation
Already initial simulations for 3 selected points enable to obtain VPS in the form of a 3d surface (fig. 8). For an individual point the surface is clearly the highest above the ground level (fig. 8b). We can also observe ‘echo’ of buildings, in particular towers as seen in the grid. Adding further points to the analysis significantly increases the complexity of the surface. We can see traverse grooves in the original VPS surface (fig. 8a). The grooves reduce the height of particular points in the grid, so they cannot be seen in the second observation point. By adding another point (fig. 8c) we rearrange the structure of the VPS surface and reduce its height. The grid seems to be closer to dominating towers. Primary clear echoes of those buildings are partially reduced.
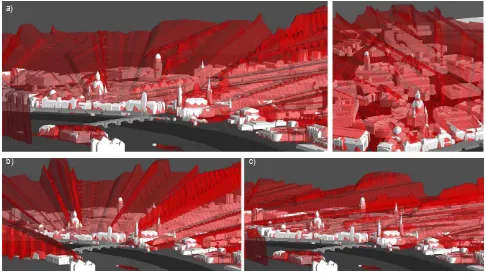
algorithm (Ozimek, 2008). Color rays extending from the observation point are de facto locations where the VPS surface reduces its height and our sight can reach deeper into the city. What we see in the map as rays corresponds to grooves in 3d images of the VPS surface (fig. 9a, b).
Simulations indicate that by adding further strategic points we cause a major change of the emulated VPS surface. This reduces the area where it is possible to develop tall buildings (marked red) and increases the foreground area (marked black). The figure shows views for selected configurations of observation points (fig. 9a÷e). With the increase in the number of observation points covered by the analysis the complexity of VPS surfaces increases. This translates into more restrictive
provisions regarding the height of buildings. In other words, the more strategic views to be protected, the more difficult it is to find a suitable location of a tall building.
4.3 Results
Observation of changes of the VPS surface with the growing number of view points included in simulations is particularly important for better understanding of landscape and relations between foreground and background. By adding points we flatten the VPS surface since it moves closer to the existing skyline. However, in certain areas the process stops at specific levels. Thus, we may define the limit height for new buildings.
Figure 7. Distribution of observation points covered by VPS method
Figure 8. Comparison of VPS emulations for selected views of Dresden skyline seen from river: a) VPS for two view points; b) VPS for one view point (Canaletto view);
c) VPS for three view points a)
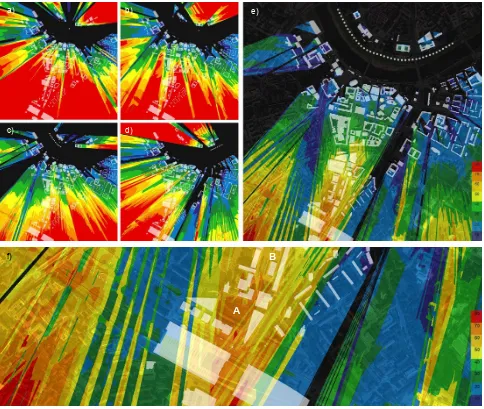
Figure 9. Comparison of simulations using VPS method for view points situated along river:
a) simulation for one point; b) simulation for two points; c) simulation for 11 points situated extremely westward; d) simulation for 8 points situated extremely eastward; e) simulation for 40 points; f) zoom in for a part of simulation for 40 points with area of highest
possible development marked
A measurable result, taking into consideration the objective of protecting the landscape, is the VPS simulation for all 40 strategic points (fig. 9e). Based on analysis of results, we may exclude the possibility of erecting new buildings in excess of 80m. In the vicinity of the main train station, it is possible to build facilities between 70 to 80 m in height within a limited area (fig. 9f-A). The analysis also distinguished an area in the vicinity of Prager Straße where, according to the simulation, it is possible to increase the height of buildings without detrimental impact on the landscape seen from the river (fig. 9f-B). The analyses provide an overview and may illustrate the application of the VPS method.
5. CONCLUSION
The development of the remote detection technology for natural and urban areas creates new possibilities of applying digital data in urban planning. The research problem presented in the
article pertains to the city landscape and protection of its values. It is therefore related to an analysis of relations important for the perception of the city from the level of a man. However, the external 3d digital image of a city in the form of vector or point models can be a valuable tool for more precise analysis of the issue and examining visual relations of inner city areas for the purpose of planning.
The Visual Protection Surface (VPS) method presented in the article enables studying relations between the scope of strategic view protection and possibilities of contemporary development of a city including tall buildings. The contemporary urban planning protects the landscape by concentrating on preserving views that are important for city identity and constituting its cultural value. Distinguishing and protecting such views is a tool for numerous landscape studies and a basis for planning guidelines determining a legal framework for developing new buildings.
a) b)
c) d)
e)
f)
A
Protecting and developing the city landscape and tall buildings is a subject of arguments and controversies. In this context, in order to maintain high quality of urban planning, it is important to look for tools that enable objective analysis of the city landscape. One of such tools is the VPS simulation. Input data include coordinates of particular views and the output is a surface limiting the height of development. The simulation is obtained in a geometrically unbiased manner. The advantage of the method is the possibility of simultaneous analysis of space in the entire city, including its necessary landscape context. The software developed by the authors enables applying the VPS method, and at the current stage provides for examining areas of the city up to 20km2. The computer emulated surface can be useful in the urban planning process.
ACKNOWLEDGEMENTS
The article was prepared within the research project 2TaLL: Application of 3D Virtual City Models in Urban Analyses of Tall Buildings, funded by a Norwegian Financing Mechanism. Digital model of Dresden was provided by Dresden Municipality. We gratefully acknowledge all the support. All illustrations prepared by authors.
REFERENCES
Canada’s Capital Views Protection. Protecting the Visual Integrity and Symbolic Primacy of Our National Symbols, collective work for National Capital Commission, Ottawa 2007.
Czyńska, K., 2007. Metody kształtowania współczesnej sylwety miasta na przykładzie panoram Szczecina. Wykorzystanie wirtualnych modeli miast w monitoringu i symulacji panoram. Doctoral thesis, Wrocław, Poland.
Czyńska, K., 2010. Tall buildings and harmonious landscape. In: Space and Form no 13, pp. 267-280.
Czyńska, K., 2014. Geometrical Aspects of City Skyline – Tall Building Analysis. In: Schröcker, H.-P. and Husty, M. (eds.), Proceedings of the 16th International Conference on Geometry and Graphics, Innsbruck: Faculty of Engineering Science, pp. 519–530.
Czyńska, K., Marzęcki, W., Rubinowicz, P., 2007. Analyses of visual impact and definition of spatial guidelines for high buildings in Szczecin, Urban Study commissioned by Department of Spatial Planning, City of Szczecin, Poland.
Czyńska, K., Marzęcki, W., Rubinowicz, P., 2011. View values of Lublin, Urban Study commissioned by Department of Spatial Planning, City of Lublin, Poland.
Hochhauskonzept Köln 2003, Stadtplanungsamt der Stadt Köln, 2003.
Kolbe, T. H., 2009. Representing and Exchanging 3D City Models with CityGML. In: J. Lee, & S. Zlatanova (Eds.), 3D Geo-Information Sciences. Berlin-Heidelberg: Springer-Verlag, pp. 15-31.
London View Management Framework. Supplementary planning guidance, Study by Greater London Authority, Mayor of London 2012.
McNeill D., 2005. Skyscraper geography. Progress in Human Geography 29, 1, pp. 41-55. doi: 10.1191/0309132505ph527oa
Moser, J., Albrecht, F., Kosar, B., 2010. Beyond visualisation – 3D GIS analyses for virtual city models. In: The International Archives of the Photogrammetry, Remote Sensing and Spatial Information Sciences, ISPRS 5th International 3D GeoInfo Conference, Berlin, pp. 143-147.
Oleński W., 2008. Kształtowanie krajobrazu kulturowego Warszawy – analiza urbanistyczna lokalizacji budynków wysokościowych i ochrona widokowa zespołu starego miasta. In: Zarządzanie krajobrazem kulturowym, Prace Komisji Krajobrazu Kulturowego nr 10, Sosnowiec, pp. 104-113.
Ozimek, P., Ozimek, A., 2008. Computer Aided Method of Visual Absorption Capacity Estimation. In: Buhmann, Pietsch, Heins (Eds.), Digital Design in Landscape Architecture, Proceedings at Anhalt University of Applied Sciences, Wichmann Verlag, Heidelberg, pp. 105-114.
Pal Singh, S., Jain, K., Mandla, V. R., 2013. Virtual 3D city modeling: techniques and applications. In: International Archives of the Photogrammetry, Remote Sensing and Spatial Information Sciences, ISPRS 8th 3DGeoInfo Conference, Istambul,Volume XL-2/W2, pp. 73-91.
Piga, B., Signorelli, V., Morello E., 2012. Anticipating the Impacts of Urban Design Projects Starting from the Pedestrians’ Experience. In: Proceedings of AESOP 26th Annual Congress METU, Ankara.
Poullis, C., You, S., 2009. Automatic reconstruction of cities from remote sensor data. Computer Vision and Pattern Recognition, CVPR 2009. IEEE Conference, pp. 2775-2782, doi: 10.1109/CVPR.2009.5206562.
Rubinowicz, P. Cyber Urban Design. Archivolta 3(59), Cracow 2013, pp. 58-65.
Seeing the history in the view. A method for assessing heritage significance within views, Study by Historic Buildings and Monuments Commission for England, London 2011.
Suleiman, W., Joliveau, T., Favier, E., 2013. A New Algorithm for 3D Isovist. In: Proceedings of 15th International Symposium on Spatial Data Handling Geospatial dynamics, geosimulation and exploratory visualization, Bonn, pp. 157-173.
Verma, V., Kumar, R., Hsu, S., 2006. 3D Building Detection and Modeling from Aerial LIDAR Data. Computer Vision and Pattern Recognition, IEEE Computer Society Conference, vol.2, pp. 2213-2220, doi: 10.1109/CVPR.2006.12