www.elsevier.comrlocateratmos
Some effects of cloud–aerosol interaction on cloud
microphysics structure and precipitation formation:
numerical experiments with a spectral microphysics
cloud ensemble model
A. Khain
), A. Pokrovsky, I. Sednev
The Hebrew UniÕersity of Jerusalem, The Institute of the Earth Sciences, Department of Atmospheric Sciences,
Jerusalem, Israel
Received 17 December 1998; received in revised form 20 May 1999; accepted 20 May 1999
Abstract
Ž .
A spectral microphysics Hebrew University Cloud Model HUCM is used to evaluate some effects of cloud–aerosol interaction on mixed-phase cloud microphysics and aerosol particle size distribution in the region of the Eastern Mediterranean coastal circulation. In case of a high
Ž .
concentration of aerosol particles APs , the rate of warm rain formation is several times lower, a significant fraction of droplets ascends above the freezing level. These drops produce a large amount of comparably small graupel particles and ice crystals. The warm rain from these clouds is less intense as compared to clouds with low drop concentration. At the same time, melted rain from clouds with high droplet concentration is more intense than from low drop concentration clouds. Melted rain can take place downwind at a distance of several tens of kilometers from the convective zone. It is shown that APs entering clouds above the cloud base influence the evolution of the drop size spectrum and the rate of rain formation. The chemical composition of APs influences the concentration of nucleated droplets and, therefore, changes accumulated rain
Ž .
significantly in our experiments these changes are of 25–30% . Clouds in a coastal circulation influence significantly the concentration and size distribution of APs. First, they decrease the concentration of largest APs by nucleation scavenging. In our experiments, about 40% of APs were nucleated within clouds. The remaining APs are transported to middle levels by cloud updrafts and then enter the land at the levels of 3 to 7 km. In our experiments, the concentration of small APs increased several times at these levels. The cut off APs spectrum with an increased concentration of small APs remains downwind of the convective zone for several of tens and even
Ž
hundreds of kilometers. The schemes of drop nucleation based on the dependence of nucleated
)Corresponding author. Tel.:q972-2-658-5822; fax:q972-2-566-2581; E-mail: [email protected]
0169-8095r99r$ - see front matterq1999 Published by Elsevier Science B.V. All rights reserved.
Ž .
. Ž
drop concentration on supersaturation in a certain power and autoconversion based on the
.
Kessler formula are unsuitable for an adequate description of cloud–aerosol interaction. The Kessler formula predicts an incorrect tendency in the rate of raindrop formation while increasing APs’ concentration. Prediction errors concerning the rate of raindrop formation can easily result in
Ž . Ž
a 10-fold increase. It indicates that the spectral bin microphysics scheme or parameterizations
.
based on the bin schemes can be used for an adequate description of cloud–aerosol interaction.
q1999 Published by Elsevier Science B.V. All rights reserved.
Keywords: Spectral cloud microphysics; Cloud–aerosol interaction; Coastal circulation
1. Introduction
Ž .
As is well known, clouds forming over continents continental air masses and over
Ž .
the sea maritime air masses have different regimes of rain formation. These differences
Ž .
are attributed to both different thermal conditions lapse rates and humidity and to different concentration of atmospheric aerosol serving as cloud condensation nuclei
ŽCCN . To reveal the role of atmospheric aerosol, cloud development should be.
compared under similar thermal conditions. Recent observations of cloud development
Ž .
within different types of air masses maritime or continental type reveal crucially different cloud development and rain formation. So, according to Rosenfeld and Lensky
Ž1998 , Lensky and Rosenfeld 1998 observed that in polluted areas over Thailand and. Ž .
Indonesia some clouds do not precipitate at all having narrow spectra of small droplets. At the same time, similar clouds start precipitating in clear air in about 15 min after their formation.
Different regimes of precipitation formation indicate significant differences in cloud microphysics, rates of latent heat release, as well as possible differences in cloud dynamics. The role of cloud–aerosol interaction appears to be significant in those atmospheric phenomena, in which latent heat release is an important energy source. Some indirect evidence of the potentially important effects of atmospheric aerosols on
Ž .
the tropical cyclone TC intensity can be inferred from a recent statistical analysis of
Ž
weekly fluctuations of intensity of landfalling hurricanes in the North Atlantic Cerveny
.
and Balling, 1998 . The TC statistics indicate that the intensity of landfalling storms is
Ž .
usually lower during weekends when human-induced aerosol generation is minimal as compared to weekdays, while associated precipitation reaches its maximum during the same days. This effect cannot be explained by conventional convective parameteriza-tions. It is because these parameterizations imply that precipitation rate is proportional to the rate of latent heat release. Different microphysical structures of clouds, in their turn, cause different radiative cloud properties.
Thus, allowing for cloud–aerosol interaction is potentially very important for the understanding of the dynamics and microphysics of a great number of atmospheric phenomena, as well as the climate and possible climatic changes.
Adequate description of cloud–aerosol interaction turns out to be an actual problem for different numerical models.
In some advanced mesoscale models with explicit microphysics such as RAMS
ŽReisner et al., 1998 , the so-called ‘‘bulk parameterization’’ microphysical schemes are.
used. In these schemes, all microphysical processes are described in terms of integral parameters, such as mass content and number concentration. The comparably small number of integral parameters makes the bulk parameterization schemes computation-ally efficient. However, the ‘‘bulk parameterization’’ microphysical schemes used in the RAMS and MM5 mesoscale models also have limited capabilities in describing the effects of atmospheric aerosols on clouds. For example, in studies by Pielke et al.
Ž1992 , Reisner et al. 1998 and many others, the autoconversion rate the rate of rain. Ž . Ž .
water production by coagulation of small cloud droplets is described by the following
Ž .
formula Kessler, 1969 :
Ausmax K CWC
Ž
yCWCcr.
,0 ,4
Ž .
1where CWC is cloud water content, CCWcr is an empirical threshold value, K is an
Ž . Ž .
empirical constant. It is known, however e.g., Beheng, 1994 , that formulation 1 appears highly intuitive without taking into account any microphysical considerations.
Ž .
For instance, formula 1 ignores any dependence of raindrop production on the cloud droplet size and width of the droplet size spectrum. The latter is the major controlling factor of rain formation.
Ž
The two-dimensional cloud ensemble model HUCM the Hebrew University Cloud
. Ž
Model with detailed description of cloud microphysics Khain and Sednev, 1995, 1996;
.
Khain et al., 1996 has been designed to take into account the effects of cloud–aerosol interaction on latent heat release and precipitation formation. The HUCM microphysics
Ž .
is based on the spectral or bin approach according to which each of the seven types of
Ž .
cloud hydrometeors water drops, three types of ice crystals, snow, graupel and hail are described using size-distribution functions containing several tens of bins of masses. To make it possible to describe cloud–aerosol interaction and drop formation by nucleation
Ž .
processes, a special size distribution for aerosol particles APs is incorporated into the model. This function contains several tens of mass bins as well. Contrary to the bulk parameterization schemes, the size distributions in the model are not determined a priori, but are the result of model integration.
Cloud microphysics models based on spectral microphysics proved to be effective
Ž
when simulating precipitation formation and cloud–aerosol interactions e.g., Khvorostyanov et al., 1989; Khain et al., 1996; Reisin et al., 1996a,b; Levin et al.,
.
1998 .
In the present paper, we use the HUCM to illustrate the effects of cloud–aerosol interaction on cloud microphysical parameters and rain formation in the Eastern Mediterranean coastal zone during the cold season.
2. Model description
Ž .
The computational area of the model in the present study extends 192 km horizontally
Ž .
and 16 km vertically 129=41 grid points . The coastline is located at xs90 km.
Ž .
The variables of the model include wind velocity vorticity and stream function , virtual potential temperature, mixing ratio, the number density size distribution functions
Ž .
of water drops, ice crystals plates, dendrites and columns , snowflakes, graupel and hailrfrozen drops.
The non-linear advection terms were approximated using the Arakawa method, which conserves vorticity, the square of the vorticity and kinetic energy. The stream function was found by solving the Poisson equation. Each size distribution function is described
Ž .
using the same mass grid containing 33 categories bins . The maximum mass in the mass grids corresponds to a water drop with the radius of 3250mm. The model provides calculation of values of different types: precipitation amount, precipitation rates, fluxes of different hydrometeors, mass contents, radar reflectivity from water and ice, the mean and effective radii of droplets and ice particles, fluxes from the underlying surface and so on.
The model takes into account the following microphysical processes: nucleation of
Ž .
CCN; formation nucleation of ice crystals, condensational growthrevaporation of droplets; diffusion growthrsublimation of ice particles; freezing of drops; melting of ice
Žsimplified description , drop–drop, drop–ice and ice–ice collisions; spontaneous.
breakup of rain drops and snowflakes.
In order to describe cloud–aerosol interaction and to reveal the influence of aerosols on the cloud microstructure and cloud thermodynamics, a special size distribution function of APs is used. It also contains 33 mass bins.
The HUCM applies an explicit analytical method for the calculation of supersatura-tions with respect to water and ice. These values of supersaturation are used to calculate drop growth by diffusion and drop nucleation processes. Using the values of supersatura-tion, the critical sizes of APs are determined. The APs of different chemical composition greater than these critical values are activated. The corresponding sizes of cloud droplets are calculated.
Actually, CCN start growing in a water vapor field long before they enter the cloud, even at supersaturations less than critical. These size changes provide the initial value of the wet nuclei radius for subsequent condensation calculations. As was indicated by
Ž . Ž . Ž .
Mordy 1959 , Ivanova et al. 1977 , Kogan 1991 as well as from our supplemental
Ž .
experiments, the smallest nuclei with the dry fraction under about 0.3mm reach their
Ž .
equilibrium radii in a reasonably short time seconds of fraction of seconds . We assumed that these small particles were in the equilibrium and the size of corresponding droplets was calculated from the Kohler equation.
Ž .
Large particles require significant time sometimes, even days to come to their equilibrium radii at 100% relative humidity.
To calculate the initial size of droplets arising on CCN with the dry fraction over 0.3
Ž .
mm, we applied the results of detailed calculations performed by Ivanova et al. 1977 . According to these results, the initial sizes of droplets at zero supersaturation level are about five times as large as the radii of corresponding dry CCN. This assumption excludes the formation of very large droplets at the cloud base just after nucleation.
Ž . Ž .
Ž .
Activation of new crystals is simulated following Meyers et al. 1992 . The type of fresh nucleated crystals depends on temperature. The probability of drop freezing was
Ž . Ž .
assumed proportional to the drop mass probability freezing Khain and Sednev, 1996 . Size spectra evolution by drop–drop, drop–ice and ice–ice collisions is described by solving a system of stochastic collision equations for size distribution functions. The stochastic coalescence equations were solved using the method of Berry and Reinhardt
Ž1974 . Collision kernels for ice–ice collisions depend on temperature and supersatura-.
tion with respect to ice. A stochastic nature of terminal fall velocity of non-spherical ice particles is taken into account by the corresponding increase of the swept volume. The values of terminal fall velocities of different hydrometeors as functions of their mass
Ž .
were taken mainly from Pruppacher and Klett 1978 .
3. Description of numerical experiments
During the cold season, the sea surface temperature is higher than the temperature of the land by about 3 to 108C. In our experiments, the sea–land temperature difference is set equal to 58C. The SST is set equal to 198C, which is a value typical of December. The initial profile of the background wind was chosen as follows: a linear increase was set in the lowest 4 km from 4 to 12 mrs with a further increase toward 30 mrs at zs16 km. Vertical profiles of temperature and humidity were chosen typical of rain
Ž .
events in the Mediterranean region Khain and Sednev, 1996 . Initial relative humidity over the sea was taken equal to 90%, 5% greater than that over the land. The surface temperature was not changed during the model integration.
Ž .
The purposes of numerical experiments are to investigate 1 the influence of concentration and chemical composition of APs on cloud microphysics and rain amount
Ž .
and distribution and 2 the influence of clouds on the concentration and size distribution of APs. Only nucleation scavenging will be taken into account in the study.
In the control experiment E500, a modified gamma distribution function was used to describe the size distribution function of APs subject to nucleation in clouds:
f sAraq1exp yBrg
.
Ž .
2Ž
.
a a a
Ž .
The parameters in Eq. 2 were set so as to be typical of the Eastern Mediterranean
Ž . y3
conditions Levin, 1994 with the concentration of APs near the surface of 500 cm . The spectrum is similar to that observed in the maritime air. The spectrum contains a significant number of particles whose is ranged from 0.01 to 0.1mm. The maximum size of dry APs in the spectrum is about 1mm. There are no ultra-giant coalescence nuclei in the simulations.
The exponential decrease of APs concentration was assumed as the initial condition at ts0, when there was no convection and no clouds:
A z sA exp yzrzU
, where A s8.55P104cmy3mm, B
s17.89mmy0 .5,
Ž .
0Ž
.
0When convection develops convective motions determine the spatial distribution of APs leading to homogenization of APs concentration in the vertical. The homogeniza-tion of AP’s concentrahomogeniza-tion with time takes place in the atmospheric boundary layer beyond the convective zone due to vertical turbulent mixing as well.
Under a dominating contribution of the western background flow, the coastal region even over the land should have a distribution of APs similar to that over the sea. In the paper, we discuss 2-h simulations of the coastal circulation. During this time period, the contribution of such maritime air aerosols must be dominating, and the assumption that spatial distribution of APs is horizontally homogeneous seems to be acceptable.
APs in E500 were assumed to consist of NaCl. The values of APs’ concentration near the surface remain constant during the simulations.
To reveal the influence of APs’ concentration above the cloud base, exp. E500C was conducted, in which APs’ concentration was set equal to 500 cmy3 throughout the whole computational area.
To investigate the influence of APs’ concentration on the rain amount and distribu-tion, experiments E100 and E1000 were conducted. These experiments are similar to the control experiment E500, with the exception that the APs’ concentration at the surface was set close to 100 cmy3 and 1000 cmy3, respectively.
wŽ . x
Experiment E500 NH4 2SO4 was similar to the control experiment E500, with the
Ž .
only exception: APs were assumed to consist of NH4 2SO . This experiment was4 conducted to reveal the sensitivity of model precipitation to the chemical composition of APs.
4. Results of the experiments
4.1. Control experiment E500
Low-level wind convergence between the dominating westerly wind and coastal breeze-like circulation creates favorable conditions for the development of convective clouds over the sea, 15–18 km from the shore line. The clouds are then transported by the background flow toward the land. Vertical velocities in clouds reached up to 9 mrs. The height of the cloud top is 6 to 6.5 km at different time instances.
Ž .
At the time when vertical velocities reach their maximum ts3000 s , the maximum drop concentration was 170 cmy3. The maximum drop concentration varies with time within the range 150 to 250 cmy3. The main feature of the simulation is the alteration of
Ž
cloud microstructure inland. Convective rain water drops with a diameter greater than
.
64mm falls downwind of the zone of convective updraft. A significant fraction of the rain falls over the sea. The existence of the convective rain maximum in the vicinity of
Ž
the shoreline is an observed climatic feature of precipitation in Israel Kutiel and Sharon,
.
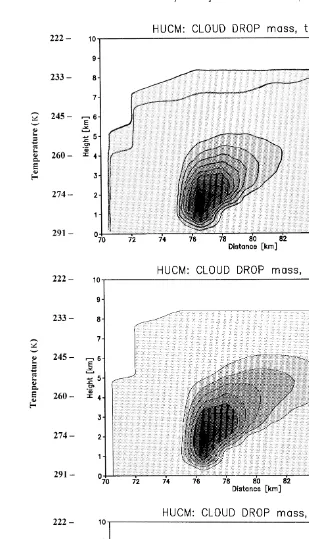
1980 . A significant amount of suppercooled water can be seen above the freezing level
Ž2 km. ŽFig. 1b, Fig. 2b . The maximum of cloud water content CWC of 1.65 g m. Ž . y3 is
Ž .
Ž y3. Ž . Ž . Ž .
Ž y3. Ž . Ž . Ž .
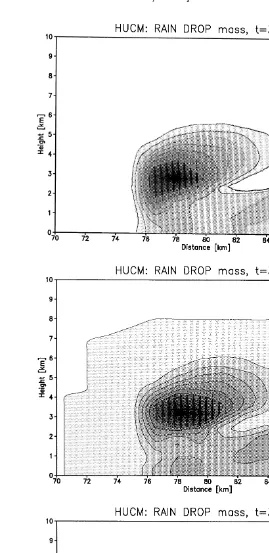
drop content descends with the decrease of the maximum velocity to 2.5 km at ts1 h. Then, the height of the maximum RWC remains actually unchanged.
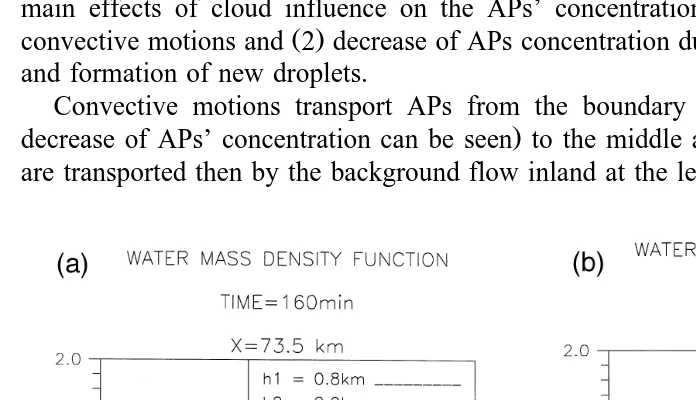
Typical drop size spectra in the area of the maximum convective updraft at 1 km
Žxs73.5 km and 1.5 downwind x. Ž s75 km are shown in Fig. 3. One can see that at.
Ž .
the level zs0.8 km about 400 m above the cloud base , the size distribution of cloud drops is centered at 14 mm. The maximum of the spectrum shifts with the height to greater sizes: 17mm at 2 km, and 22 mm at 3.6 km due to diffusion growth. One can see the formation of raindrops at xs75 km, whose size increases downward reaching the radius of about 1 mm at zs0.8 km.
Ž .
As Khain and Sednev 1996 reported, high-density ice particles, such as frozen drops
Žwith the density of 0.9 g my3.are located in the area of comparably strong updrafts and start precipitating over the land as soon as vertical updrafts decrease. Then, graupel particles begin to contribute to precipitation. Ice crystals and snowflakes are able to enter the land by several tens and even hundreds of kilometers. Therefore, it is mainly melted drops that cause precipitation over the land.
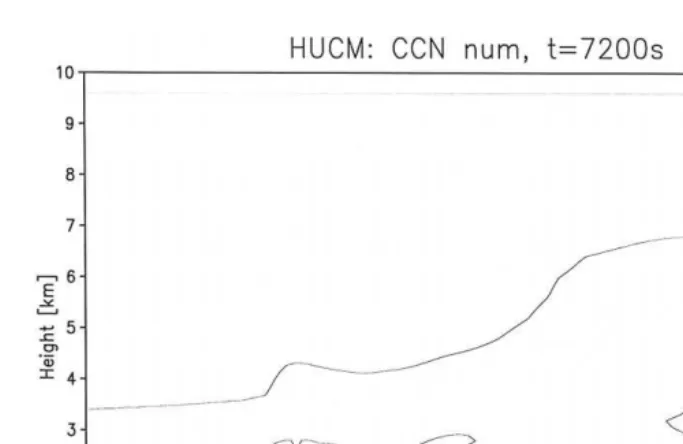
In Fig. 4, the field of APs concentration at ts2 h is presented. One can see two
Ž .
main effects of cloud influence on the APs’ concentration: 1 transport of APs by
Ž .
convective motions and 2 decrease of APs concentration due to the activation of CCN and formation of new droplets.
Ž
Convective motions transport APs from the boundary layer where a significant
.
decrease of APs’ concentration can be seen to the middle atmosphere. These particles are transported then by the background flow inland at the levels of 3 to 7 km.
Ž .
Fig. 3. Typical drop size spectra in the area of the maximum convective updraft at 1 km xs73.5 km and 1.5
Ž . Ž .
km xs75 km downwind of maximum low level updraft. As can be seen from a , process of collisions begins below zs800 m, so that at zs800 m the largest drops reach the 100mm radius. Symbol lnR denotes
Ž .
the logarithm of drop radius with the base es2.7 according to Berry and Reinhardt, 1974 method. Symbol
Ž .
Fig. 4. Fields of APs’ concentration at ts2 h in E500.
Comparison of APs’ concentration within a cloud with that at the cloud base shows that 35 to 40% of APs experience activation and turn into drops. A decrease of APs’ concentration is caused by activation of the largest particles in the APs’ size spectrum.
Ž .
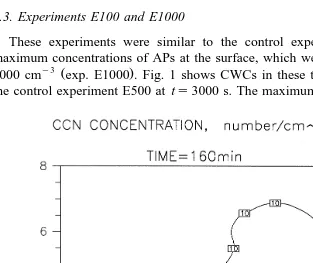
Fig. 5a–c shows size distributions of APs at ts230 min at different heights a in the
Ž .
undisturbed area at the upwind side of the convective activity zone xs69 km, b in the
Ž .
area of maximum convective updraft, xs73.5 km, and c about 60 km inland from the
Ž . Ž .
zone of coastal convection. Comparison of figures a and b indicates a sharp size spectrum cut off at 0.4mm in the area of cloud activity. APs transported by clouds into
Ž . Ž
the middle and upper troposphere have small sizes. Ten kilometers downwind not
.
shown the size spectrum of APs at zs3.6 km indicates the concentration of small APs
Ž
with the radii below 0.4mm three times as high as compared to the concentration in the
.
undisturbed area and the decrease of the concentration of APs’ with the radii greater than 0.4mm by a factor of two. A significant influence of convection on the APs’ size
Ž .
spectrum is pronounced at several tens of kilometers figure c and even 100 km
Ž .
downwind of convective zone not shown .
4.2. Experiment E500C
In this experiment, initial APs’ concentration was set 500 cmy3 over the whole computational region. The main question we are addressing in the experiment is the influence of APs located at levels above the cloud base on cloud microphysics.
Ž .
Fig. 5. Size distributions of APs at ts200 min at different heights a in the unperturbed area at the upwind
Ž .
side of the convective activity zone, xs69 km, b in the area of the maximum convective updraft, xs73.5
Ž .
km, and c 60 km inland from the zone of coastal convection.
to fresh drop nucleation above the cloud base due to the entrainment of APs through cloud boundaries. The analysis of the drop size spectra evolution in E500 and E500C seems to support the conclusion. There is actually no difference in the droplet spectra at
Ž .
zs0.4 and 0.8 km not shown . At zs2 km, the difference in the size spectra becomes noticeable: in E500C, the cloud spectrum contains drops about 1 mm smaller than in E500. The difference in the spectra increases with height, so that at 3.6 km, the drop spectrum in E500C contains cloud drops that are by about 2 mm smaller than in E500. The increase in drop concentration in E500C and a corresponding decrease of the droplet size led to some delay in rain formation and to a corresponding shift of the rain maximum 6 to 10 km downwind. Accumulated rain decreased by about 15%. Thus, the effects of APs located above the cloud base cannot be neglected.
Fig. 6 presents the APs’ concentration field in E500C at 160 min. The minimum value of APs’ concentration was 227 cmy3 as compared to the maximum value of 500 cmy3. This again shows that in the zone of active convection nucleation scavenging can
Ž .
eliminate from the atmosphere up to 40% of APs in case of typical size distribution .
4.3. Experiments E100 and E1000
These experiments were similar to the control experiment E500, except for the
y3 Ž .
maximum concentrations of APs at the surface, which were 100 cm exp. E100 and
y3 Ž .
1000 cm exp. E1000 . Fig. 1 shows CWCs in these two experiments, as well as in the control experiment E500 at ts3000 s. The maximums of CWC in E100, E500 and
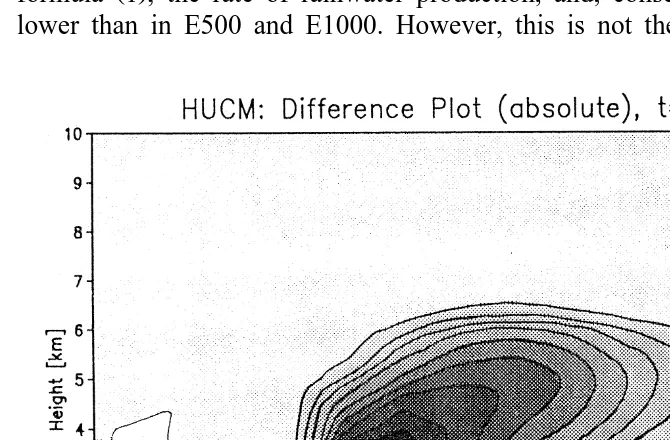
E1000 are 1.1 g my3, 1.65 g my3 and 2.0 g my3, respectively. The difference of the CWC fields in exps. E100 and E1000 is shown in Fig. 7a. From Figs. 2 and 7a one can see that the CWC in E100 is significantly lower than in E1000. According to the Kessler
Ž .
formula 1 , the rate of rainwater production, and, consequently, RWC must also be lower than in E500 and E1000. However, this is not the case in the spectral
micro-Ž . Ž .
Ž
physics model, as shown in Fig. 2a,c, Fig. 7b. The maximums of RWC in E100 clear
. Ž . y3 y3
maritime air , E500 and E1000 relatively dusty air were 1.3 g m , 1.1 g m and 0.85 g my3, respectively. Thus, as we can see in Fig. 7b, the RWC in E100 is nearly twice as large as in E1000. This difference remains in the convective region all the time of model integration. We attribute the difference in the RWCs to the fact that drop
Ž y3.
concentration in E1000 with maximum of 260 cm is several times higher than in
Ž y3.Ž .
E100 with the maximum of 58 cm Fig. 8a–c and, therefore, cloud droplets in E1000 are significantly smaller than in E100.
Thus, the rate of raindrop formation in E100 was twice as large as that in E1000,
Ž .
while according to the Kessler formula 1 it should be half as low. It means that
Ž .
neglecting the effect of drop size in 1 leads to an error by a factor of 4. Note that in E1000 drop concentration is not as large, as in very continental clouds, where drop concentrations can exceed 1000 cmy3. In case cloud development is simulated in a
Ž .
highly dusty air, formula 1 can easily overestimate the rate of rain drop formation by the factor of 10.
Differences in the CWC and RWC between E100 and E1000 lead to differences in
Ž .
cloud ice structure. During the period of active ice formation ts3000 s graupel forms
Ž .
at the levels 3 to 6 km Fig. 9a,b, Fig. 10a,b by collisions of ice crystals with droplets
Ž
of greater mass. Because in E1000 the mean drop size is smaller droplets have a lower
.
terminal fall velocity than in E100, droplets ascend to higher levels before forming
Ž
graupel. Thus, graupel particles in E1000 are located at higher levels than in E100 see
.
the fields of mass and concentration differences in Fig. 9c, Fig. 10c . Graupel particles, located at higher levels, where the velocity of the background flow is higher, are transported inland faster. Over the land, the largest of them descend because of a fast decrease of the air vertical velocity inland. The maximum of graupel mass content
Ž .
descends from 4 km at 3000 s to 2.5 km at ts4200 s. Fig. 11a–c, Fig. 12a–c . At the same time, graupel particles in E100 are larger, they grow owing to intensive accretion of small droplets and the largest of them precipitate within 10 km downwind of the maximum convective updraft. As a result, at ts4200 s the graupel mass content in E1000 turns out to be greater than in E100 in the region with x)82 km.
Concentrations of columnar crystals and dendrites are similar in both experiments
Ž y1. Ž .
10–15 l . Plate-like crystals form within the layer of 6 to 7 km not shown .
Ž y1.
Concentration of plate-like ice crystals in E1000 up to 500 l is much higher than
Ž y1.
that in E100 up to 100 l . The majority of plate-like crystals forms in the model by freezing of small droplets at low temperatures. As it was discussed above, the concentra-tion of small cloud droplets in E1000 is much higher than that in E100. It explains the difference in plate crystal concentration. At the same time, the crystals in E1000 are smaller than in E100. Their size is usually less than 15mm. Most particles cannot be detected by the equipment available. At the same time, small ice crystals influence significantly the radiation properties of clouds. This indicates the importance of adequate
Ž . Ž . Ž .
Fig. 8. Cloud drop concentrations in a E100 and b E1000 and c the difference between these fields. The
Ž y3. Ž
drop concentration in E1000 with the maximum of 260 cm is several times higher than in E100 with the
y3.
description of cloud–aerosol interaction to provide the correct determination of cloud radiation properties.
Ž .
Snowflakes form from the very beginning at the heights of 5 to 6 km not shown . The mass of snowflakes is smaller than that of graupel by a factor of 1.5 to 2. The mass of snowflakes in E100 is greater than in E1000. We explain the result as follows. Snowflakes in our model are formed, first, as a result of collisions of ice crystals. Then, the mass of snowflakes grows by riming. In spite of a higher ice crystal concentration in
Ž .
E1000, many crystals mainly plate-like crystals are too small to collide.
The height of graupel and snow generation decreases with time from 5 km to 6 km at ts3000 s to 3–4 km at ts6000 s. We attribute this effect, first of all, to the descent of ice particles within downdrafts on the downwind side of the convective zone and
Ž .
sequential entrainment into the areas of suppercooled rain. Ovtchinnikov 1998 dis-cussed the important role of ice recirculation for graupel formation.
Ž .
As it was noted above, precipitation over the land x)90 km is related to the
Ž .
melting of ice particles mainly graupel in the present experiments . Graupel mass content over the land is greater in E1000 than in E100. Thus, over the land melted rain in E1000 is greater than in E100. We illustrate this result by Fig. 13a–c, Fig. 14a–c, where radar reflectivity of water and total ice at ts5400 s are presented, respectively. Radar reflectivity in the spectral HUCM is calculated directly using the size spectra of
Ž .
cloud particles according to its definition see Khain and Sednev, 1996 for more detail . The radar reflectivity of supercooled water in E100 is concentrated in the zone of high updraft velocity, from 75 to 84 km. In E1000, the zone of supercooled water reflectivity extends further inland to 87 km. It is related to a smaller mass of raindrops in E1000, as it was shown above. The radar reflectivity of liquid water in E100 exceeds 40 DBz at xs84 to 89 km. The zone of the maximum radar reflectivity begins from the melting level, which indicates a dominating contribution of large rain droplets formed as a result
Ž .
of graupel and frozen drops melting. In E1000 figure b , the zone with radar reflectivity exceeding 40 DBz is located further inland: from 86 to 93 km. The maximum is reached below the 1-km level. This indicates a significant contribution of warm rain at seashore in this case.
In the convective zone below 2.5 km the radar reflectivity of liquid water is greater in
Ž .
exp. E100 location of large raindrops . Above 2.5 km, the reflectivity in E100 is smaller than in E1000 because in E100, large drops either remain below the level or turn
Ž .
into graupel or hail . At the same time, the radar reflectivity of total ice in the convective zone is greater in E100, because of larger size of graupel. Further inland at x)90 km, radar reflectivity of ice in E1000 can be 12 DBz higher than in E100. Respectively, in E1000 radar reflectivity of liquid water is 12–14 DBz higher than in E100, which shows clearly the dominating contribution of melted raindrops.
Thus, we see that difference in AP concentration leads to redistribution of precipita-tion in time and space.
Ž . Ž . Ž .
Fig. 9. Graupel mass content in experiments a E100 and b E1000 and c the difference between the mass
Ž .
()
A.
Khain
et
al.
r
Atmospheric
Research
52
1999
195
–
220
Fig.
11.
The
same
as
in
Fig.
9,
but
at
t
s
4200
Fig.
12.
The
same
as
in
Fig.
11,
but
at
t
s
4200
Fig.
13.
Radar
reflectivity
of
liquid
water
at
t
s
5400
Fig.
14.
Radar
reflectivity
of
total
ice
at
t
s
5400
Analysis of vertical velocities in the convective zone shows that in E1000 vertical
Ž
updraft velocities as well as compensation downdrafts are higher by about 1 mrs or by
. Ž .
12% than those in E100 not shown . This increase in updraft is reached in spite of larger loading in exp. E1000. We attribute this effect to a greater contribution of latent heat of fusion in exp. E1000, because in this experiment a larger fraction of drops ascends above 2-km level and experiences freezing.
[( ) ]
4.4. Experiment E500 NH4 2SO4
This experiment was similar to the control experiment E500, with only one
excep-Ž .
tion: APs were assumed to consist of NH4 2SO . Size distributions of APs were4 assumed to be the same as in the control experiment. Because the critical size of APs
Žand corresponding concentration of nucleated drops depends on their chemical compo-.
sition, precipitation also depends on the chemical composition of APs. The purpose of the experiment is to evaluate the sensitivity of precipitation to the variation of the chemical composition of APs.
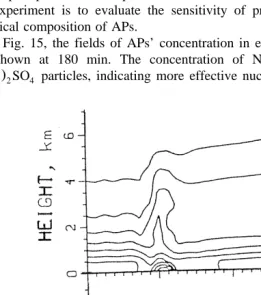
wŽ . x
In Fig. 15, the fields of APs’ concentration in experiments E500 and NH4 2SO4 are shown at 180 min. The concentration of NaCl APs is smaller than that of
ŽNH4 2. SO particles, indicating more effective nucleation and higher concentration in4
wŽ . x
the first case. As a result, the accumulated rain and precipitation rate in the case of
ŽNH4 2. SO APs turned out to be 20 to 30% higher than in the case of NaCl APs.4 Thus, accumulated rain and rain rates are sensitive to the APs chemical composition.
5. Discussion and conclusions
A spectral microphysics cloud ensemble model is used to evaluate the effect of cloud–aerosol interaction on the microphysics of mixed-phase clouds and on the APs size distribution in the region of coastal circulation. A situation typical of the Eastern Mediterranean is simulated. The sea surface is warmer than the land surface. The background wind is directed inland. As a result, the coastal circulation at low levels turned out to be opposite to the direction of the background flow and a zone of air convergence arises over the sea at about 20 km offshore.
It was shown that concentration, size distribution, spatial distribution and chemical composition of atmospheric APs crucially influence cloud microphysics, processes of rain and ice formation. Natural or human-induced increase of atmospheric AP
concentra-Ž .
tion can lead to a change of the cloud type from, say, maritime to continental type with
Ž .
corresponding decrease by several times of the rate of warm rain formation and increase in the ice crystal formation. In case of a background wind, it leads to a significant spatial redistribution of precipitation. In case of a low APs’ concentration warm rain prevails in the vicinity of the region of cloud formation. Graupel and frozen drops in these clouds are large and also fall in the vicinity of cloud formation.
In case of a high APs’ concentration, the rate of warm rain formation can be several times lower, a significant fraction of droplets ascends above the freezing level. These drops produce large amounts of comparably small graupel particles and ice crystals. Warm rain from these clouds is less intense than from clouds of low drop concentration. At the same time, melted rain from these clouds is more intense than from low drop concentration clouds. Melted rain can take place downwind at a distance of several tens of kilometers from the convective zone. Because of very different ice particle concentra-tions, radiation properties of clouds must be also different. This problem needs a special consideration.
It is shown that APs entering clouds above the cloud base influence the evolution of drop size spectrum and the rate of rain formation.
The chemical composition of APs influences the concentration of nucleated droplets
Ž .
and, therefore, changes accumulated rain significantly in our experiments by 25–30% . Clouds in a coastal circulation influence significantly the concentration and size distribution of APs. First, they decrease of the concentration of largest APs by nucleation scavenging. In our experiments, about 40% of APs were nucleated within clouds. The remaining APs are transported to middle levels by cloud updrafts and then enter the land at the levels of 3 to 6 km. In our experiments, the concentration of small APs increased several times at these levels. The cut off APs spectrum with a greater concentration of small APs remains downwind of the convective zone for several tens and even hundreds of kilometers.
Ž
The schemes of drop nucleation based on the dependence of nucleated drop
. Ž
.
Kessler formula are unsuitable for an adequate description of cloud–aerosol interaction. The Kessler formula predicts incorrect tendency as to the rate of raindrop formation while increasing APs’ concentration. Prediction errors of the rate of raindrop formation
Ž .
can easily give a 10-fold increase. This indicates that the spectral bin microphysics
Ž .
schemes or parameterizations based on the bin schemes can be used for an adequate description of cloud–aerosol interaction.
Finally, it must be stressed that despite the fact that the method of Berry and
Ž . Ž
Reinhardt 1974 used in this study has no numerical spreading in contrast to the
.
Kovetz and Olund, 1969 scheme , it has, however, another deficiency: the method does not conserve the mass of hydrometeors, especially large ice particles. We have con-ducted a supplemental experiment similar to E500, except with a mass grid containing
Ž
43 mass bins. The results showed an increase of the precipitation rate formed from
.
melted particles of about 20%. No significant difference in the results at t-1 h were observed. The difference in content of large ice particles became pronounced in 1.5 h, when these particles formed downwind of the zone of active convection. Note, however, that no qualitative differences in the results were observed when the number of grid points in the mass mesh had been increased.
Activities connected with updating the model by introducing the new collision
Ž .
scheme developed by Bott 1998 is under way. This scheme has no numerical spreading, conserves the mass and is effective from the computational point of view. We are going to present the results of the utilization of the scheme in future publications.
Acknowledgements
Ž
The authors are grateful to Christiane Textor the Max-Plank Institute for
Meteorol-.
ogy, Hamburg for her assistance in calculations and useful discussions, as well as to Dr.
Ž .
Danny Rosenfeld The Hebrew University of Jerusalem for useful discussions and for
Ž .
providing us with observational data. The Israel Ministry of Science grant 6767-95 and
Ž .
the Israel Academy of Science grant 572r97 supported the study.
References
Beheng, K.D., 1994. A parameterization of warm cloud microphysical conversion processes. Atmos. Res. 33, 193–206.
Berry, E.X., Reinhardt, R.J., 1974. An analysis of cloud drop growth by collection: Part 1. Double distributions. J. Atmos. Sci. 31, 1814–1824.
Bott, A., 1998. A flux method for the numerical solution of the stochastic collection equation. J. Atmos. Sci. 55, 2284–2293.
Cerveny, R.S., Balling, R.C., 1998. Weekly cycles of air pollutants, precipitation and tropical cyclones in the
Ž .
coastal NW Atlantic region letter to Nature . Nature 394, 561–563.
Ivanova, E.T., Kogan, Y., Mazin, I., Permyakov, M.S., 1977. The ways of parameterization of condensation
Ž .
drop growth in numerical models. Izvestia, Atmospheric and Oceanic Physics 13 N11 , 1193–1201. Kessler, E., 1969. On the distribution and continuity of water substance in atmospheric circulation. Met.
Monographs 10, 84.
Khain, A.P., Sednev, I., 1996. Simulation of precipitation formation in the Eastern Mediterranean coastal zone using a spectral microphysics cloud ensemble model. Atmos. Res. 43, 77–110.
Khain, A.P., Sednev, I., Khvorostyanov, V., 1996. Simulation of deep convection–breeze interaction in the Eastern Mediterranean using a cloud ensemble model with an explicit description of warm and ice microphysical processes. J. Clim. 9, 3298–3315.
Khain, A., Pokrovsky, A., Sednev, I., 1998. Simulation of cloud–aerosol interaction with a spectral microphysics cloud ensemble model. First Israel–Germany Bi-National Workshop on trends in Aerosol Research, Atmospheric and Industrial Aerosols. Israel Ministry of Science, Deutsche Forschungsgemein-schaft, Israel, June 2–3.
Khvorostyanov, V., Khain, A., Kogteva, E., 1989. A two-dimensional non-stationary microphysical model of a three-phase convective cloud and evaluation of the effects of seeding by crystallizing reagent. Soviet Meteorology and Hydrology 5, 33–45.
Kogan, Y., 1991. The simulation of a convective cloud in a 3-D model with explicit microphysics: Part 1. Model description and sensitivity experiments. J. Atmos. Sci. 48, 1160–1189.
Kovetz, A., Olund, B., 1969. The effect of coalescence and condensation on rain formation in a cloud of finite vertical extent. J. Atmos. Sci. 26, 1060–1065.
Kutiel, H., Sharon, D., 1980. Diurnal variation of rainfall in Israel. Arch. Meteorol., Geophys. Bioklimatol., Ser. A 29, 387–395.
Lensky, I., Rosenfeld, D., 1998. Space-borne insights into precipitation formation processes in continental and maritime convective clouds: Part 1. Case studies. Conference on Cloud Physics, Everett, 17–21 Aug., pp. J32–J35.
Levin, Z., 1994. Aerosol composition and its effect on cloud growth and cloud seeding. Sixth WMO Scientific Conference on Weather Modification and Applied Cloud Physics, Paestum, Italy, 28 May–4 June, pp. 367–395.
Levin, Z., Wurzler, S., Reisin, T., 1998. Modification of mineral dust particles by cloud processing and subsequent effects on drop size distributions. Conference on Cloud Physics, Everett, 17–21 Aug., pp. 504–505.
Meyers, M.P., DeMott, P.J., Cotton, W.R., 1992. New primary ice-nucleation parameterizations in an explicit cloud model. J. Appl. Meteorol. 31, 708–721.
Mordy, W., 1959. Computations of the growth by condensation of a population of cloud droplets. Tellus 11, 16–44.
Ovtchinnikov, M., 1998. An investigation of ice production mechanisms using a 3-D cloud model with explicit microphysics. Cooperative Institute for Mesoscale Meteorological Studies, Norman, OK 73019, Report 107, 128 pp.
Pielke, R.A., Cotton, W.R., Walko, R.L., Tremback, C.J., Lyons, W.A., Grasso, L.D., Nichols, M.E., Moran, M.D., Wesley, D.A., Lee, T.J., Copeland, J.H., 1992. A comprehensive meteorological modeling system-RAMS. Meteorol. Atmos. Phys. 49, 69–91.
Pruppacher, H.R., Klett, J.D., 1978. Microphysics of Clouds and Precipitation. Kluwer Academic, 941 pp. Reisin, T., Levin, Z., Tzivion, S., 1996a. Rain production in convective clouds as simulated in an
axisymmet-ric model with detailed microphysics: Part 1. Description of model. J. Atmos. Sci. 53, 497–519. Reisin, T., Levin, Z., Tzivion, S., 1996b. Rain production in convective clouds as simulated in an
axisymmetric model with detailed microphysics: Part 2. Effects of varying drops and ice initiation. J. Atmos. Sci. 53, 1815–1837.
Reisner, J., Rasmussen, R.M., Bruintjes, R.T., 1998. Explicit forecasting of supercooled liquid water in winter storms using the MM5 mesoscale model. Q. J. R. Meteorol. Soc. 124, 1071–1107.
Rosenfeld, D., Lensky, I., 1998. Space-borne insights into precipitation formation processes in continental and maritime convective clouds: Part 1. Methodology. Conference on Cloud Physics, Everett, 17–21 Aug., pp. J28–J31.
Simpson, J., Tao, W.-K., 1993. Goddard cumulus ensemble model: Part 2. Applications for studying cloud
Ž .
precipitating process and for NASA TRMM. TAO 4 1 , 73–116.
Yin, Y., Levin, Z., Reisin, T., Tzivion, S., 1999. The effect of giant cloud condensational nuclei on the development of precipitation in convective clouds — a numerical study. Atmos. Res., in press.