Dynamical assessment of the accretionary record in the shell
of the mussel
Semimytilus algosus
from a rocky shore in
Chile
S. Abades
a,*, C.A. Richardson
b, R. Otaı´za
aaFacultad de Ciencias,Uni6ersidad Cato´lica de la Ssma,Concepcio´n,Paica6ı´3000,Concepcio´n,Chile bSchool of Ocean Sciences,Uni6ersity of Wales,Bangor,Menai Bridge,Anglesey,LL59 5EY, UK
Received 3 April 2000; received in revised form 16 August 2000; accepted 18 August 2000
Abstract
Patterns of tidal microgrowth bands present in acetate peels of shell sections of the Chilean mussel Semimytilus algosusfrom three tidal levels on a wave-exposed shore were analyzed for the presence of recurring periodicities using numerical tools derived from signal nonlinear analysis. Both chaotic and coherent structure were found within the microgrowth pattern record, with mussels from the middle and lower tidal zones displaying a coherent structure to the patterns, whilst those from the upper tidal level displayed a chaotic banding pattern with a strong tidal component. It is suggested that because mussels in the upper tidal zone are subject to a wider suite of environmental conditions they are influenced by the spring-neap lunar tidal cycle to a greater extent than those growing in the mid to low tidal zone and display deterministic chaotic growth. This allows the mussels to grow continuously in the highly variable conditions that prevail in the upper tidal zone without continuous interruptions to shell deposition. © 2000 Elsevier Science Ireland Ltd. All rights reserved.
Keywords:Semimytilus algosus; Microgrowth increments; Recurrence quantification analysis; Chaos
www.elsevier.com/locate/biosystems
1. Introduction
Since the early 1970s the record of internal growth lines and bands contained in the calcified parts of a range of marine invertebrate phyla has been shown to be valuable in understanding onto-logical changes in growth, particularly in those organisms that posses a shell such as the bivalve
molluscs (Pannella and MacClintock, 1968; Rosenberg and Runcorn, 1975; Lutz and Rhoads, 1980; Richardson, 1993). The shell growth record comprises a pattern of microgrowth bands left by the accretionary system during shell construction when the organism is immersed and actively feed-ing. It has been suggested that the observed pat-terns of bands result from the sequential alternation of aerobic and anaerobic metabolic pathways that occur for example in intertidal bivalves during tidal immersion and emersion. * Corresponding author.
E-mail address:[email protected] (S. Abades).
During shell formation in bivalves aerobic path-ways promote the addition of inorganic material around the growing margin of the shell (Lutz and Rhoads, 1980; Richardson et al., 1981). Whereas during anaerobic metabolism partial dissolution of recently deposited shell occurs in order to buffer the acid environment within the extrapallial fluid involved in shell formation. The consequence of these episodes of aerobic – anaerobic metabolism results structurally in the formation of a wide growth increment and a narrow mi-crogrowth band (Lutz, 1976; Lutz and Rhoads, 1980).
Due to the intimate relationship between the physiological state of the bivalve and the prevail-ing environmental conditions the microgrowth in-cremental record has been proposed as a tool for the extraction of environmental information from the marine environment (see Rhoads and Lutz, 1980; Richardson, 1993 and references therein). Moreover, due to the interdependence of the many different physiological compartments of the body (i.e. how energy supply is shared between the different bodily functions) their influence on shell growth could potentially be ascertained from the incremental record of growth (Pannella and MacClintock, 1968; Richardson, 1989). In this way, a global categorization of the manner in which the physiology of an organism is working has been proposed by describing the rhythmicity displayed in the shell in terms of an endogenous – exogenous continuum (Palmer, 1973; Newell, 1979; Rhoads and Lutz, 1980).
In this paper we adopt an alternative, but com-plementary, approach to the traditional analysis of the molluscan growth record. We describe and analyze the internal microgrowth pattern record in the shell of the Chilean intertidal mussel,
Semimytilus algosus, and classify the ontogenetic
microgrowth pattern signal in the shell by means of techniques for data exploration of patterns in high dimensional space. A comparative approach was adopted, searching initially for order and pattern in the series of microgrowth increments in the shell and then investigating differences in the banding patterns in mussel shells from different tidal levels.
2. Materials and methods
Clumps of mussels S. algosus, (length 10 – 30 mm) were collected on March 30th 1998 from the high, mid and low intertidal zone (1.2, 0.8 and 0.4 m above chart datum (CD) respectively) from an intertidal rocky shore at Playa Blanca, Bahı´a Coronel (37°02%S; 73°10%W), Chile. Mussels were
boiled, the flesh removed and the shells dried at 60°C. Ten shells from each tidal level were embed-ded in Metaset resin (Buehler Ltd. UK) and then cut radially along the maximum growing axis from the umbo to the margin. The cut surface of each shell was ground smooth, polished with dia-mond paste and then etched for 30 min in 1% Decal (a formic acid based decalcifier) (Richard-son, 1989). Acetate peel replicas were prepared of the dry etched surfaces of nine shells from the high and low tidal levels and ten from mid tide level and mounted on glass slides and viewed in the light microscope. The width of each individual growth increment between adjacent bands was measured using a calibrated eyepiece graticule in sequences of up to 300 microgrowth bands from the shell margin towards the umbo. In this way the pattern of growth increments deposited by individual mussels from similar and different tidal levels was obtained for comparison with the pre-vailing tidal regime and estimated periods of tidal/ daily immersion and emersion.
The microgrowth band measurements from each of the 28 mussels examined from the three tidal levels together with the estimated immersion times were analyzed using methods developed un-der Chaos Theory (Webber and Zbilut, 1994; Abraham and Gilgen, 1995) in order to investi-gate whether any patterns or rhythms were con-tained within the data. The analysis allows a description in a simple iconographic manner of the increment widths and immersion period data signals that behave in a linear or nonlinear fash-ion. It is possible to recognize structure within what appears to be noisy signals usually classified as ‘random’ by traditional parametric standard techniques (like fast Fourier transformations).
dimensional abstract space using the time delays method (Eckmann et al., 1987). This dimensional expansion allows an estimation of the number of variables involved in the generation of the ob-served data (see Takens Theorem in Stark et al., 1996), and also describes the way they are related, e.g. whether the data are in a linear or a chaotic system. An embedding dimension of ten was used for every data set of microgrowth increments measured. When a data series is expanded into a higher dimensional space, the original sequence is fractioned into small pieces, producing a particu-lar array of vectors in this abstract space, where similar sequences share a common neighbour-hood. To represent this repetition of states, a dot is placed in a delay map every time a couple of vectors are close to each other as defined by a radiusrin higher space. In this way, a dot repre-sents a recurrent state of the system under scrutiny (Webber and Zbilut, 1994, 1996, 1997; Zbilut et al., 1997; Schreiber, 1998; Zbilut et al., 1998). Recurrence plots explore graphically the existence of hidden patterns in short sequences, qualifying recurrences of states that are not neces-sarily periodic. These plots are symmetrical over the main diagonal that roughly represents time so any half of the plot is equal and can be used to interpret the output (Webber and Zbilut, 1997).
A natural extension of RP is recurrence quan-tification analysis (RQA), which quantifies repeat-able patterns in the data and the manner in which they are organized into higher dimensional space, giving six output variables, every one characteriz-ing a different aspect of the system under study (Webber and Zbilut, 1996, 1997). One advantage of RQA is that dynamical indices can be calcu-lated from different data sets and statistically compared by traditional parametric techniques. The variables derived from RQA are (1) the per-centage of recurrences (%R), which reveal the periodicity of the measurements, (2) the percent-age of determinism (%D), which estimates the recurrent points forming short strips of two or more points parallel to the main diagonal line in the recurrence plots, as opposed to random scat-tered dispersion, describing then, organized struc-ture in the signal, (3) entropy, measured by the Shannon index, that quantifies the pieces of
infor-mation that are required to describe the signal, given a comparative idea of the complexity shown by different data sets, and (4) the mean distance, (DIS) between embedded vectors in multidimen-sional space. For comparative purposes, %R, %D, entropy and mean distance were estimated.
RQA was performed on the growth increment records in each mussel from each tidal level to compare the consistency and differences in the patterns of shell construction. The growth pattern sequences were compared using one way ANOVA (Underwood, 1997). The temporal evolution of %Rwas also explored for both the growth incre-ments and the estimated immersion times in each mussel from each tidal level. A tree diagram was constructed (Legendre and Legendre, 1983) to classify all the microgrowth pattern measurements based on the dynamical variables derived from RQA. The unweighted-paired grouping method of agglomeration was run using a correlation matrix of computed r-Pearson correlation index.
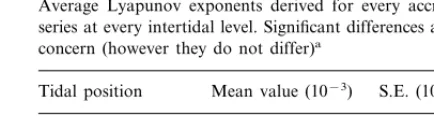
Global Lyapunov exponents were also calcu-lated for every series of band width measure-ments, characterizing time divergence of nearly initial points in higher dimensional space which gives a measure of the ‘order’ exhibited in time by the accretionary records (Eckmann et al., 1986; Collet, 1992).
3. Results
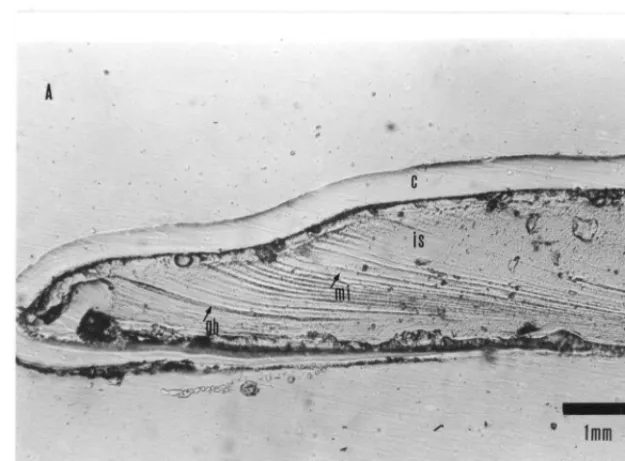
The appearance of the microgrowth pattern record in S. algosus is shown in Fig. 1. Fig. 1a shows the inner record left in the growing margin of the shell during the last activity of the accre-tionary system. Fig. 1b magnifies another section of a shell to illustrate the resolution under which measurements of the microgrowth increments that were measured.
sel shells from the different tidal levels. However, when recurrence plots were constructed (Fig. 3) a higher dimensional patterned structure emerged forming a distribution of points parallel to the main diagonal, a pattern that is usually depicted by low-dimensional chaotic systems (Webber and Zbilut, 1997). Estimated global Lyapunov expo-nents agree well with these observations (Table 1), having positive values close to zero. When the quantified dynamical variables were estimated through RQA, consistency was found between the microgrowth pattern records (i.e. percentage re-currences) in the mussels from the low and middle tidal levels, but significant differences were recorded in the mussels from the high tidal level (one way ANOVA, 2 d.f, F=21.08, P0.01)
(Fig. 4a). Similar results were obtained using per-centage determinism (Fig. 4b; one way ANOVA, 2 d.f., F=6.08,P=0.007) and entropy measure-ments (Fig. 4c; one way ANOVA, 2 d.f.,F=4.72,
P=0.018).
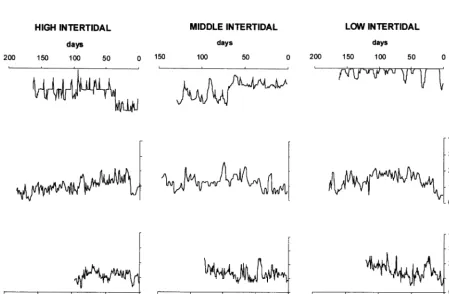
Fig. 5 summarizes into a tree diagram (i.e. UPGMA, r-Pearson) the dynamical variables derived from the RQA. It can be clearly seen that the microgrowth pattern records of the mussels from the upper tidal level together with one mid tide level mussel form a separate cluster from the remaining mussels from the mid shore and those from the lower shore level. A comparison of the temporal changes in the microgrowth pattern record at each tidal level with the corresponding immersion time periods (Fig. 6) shows a clear
Fig. 3. Recurrence plot to illustrate the kind of picture obtained when records of microgrowth patterns are time delayed and embedded in higher dimensional space to recover system functioning information. The map is a collection of points symmetrical to the main diagonal. Note the organization of points in strips running parallel to the main diagonal. This is suggestive of a non-linear (perhaps chaotic) ensemble of the state variables that forms the accretionary system that originated from the observed microgrowth increments. All the accretionary series depicted the same underlying organization, but not necessarily the same spatial pattern shown here.
correspondence between the microgrowth incre-ments and immersion time in the mussels from high tide (Fig. 6a), which is not apparent in the shells from the other two lower tidal levels (Fig. 6b and c).
4. Discussion
Descriptions of growth patterns can be used to study the degree of correlation between the envi-ronment and the physiological state of the organ-ism (see review in Rhoads and Lutz, 1980). As a result this approach has been broadly adapted by many workers during the last two decades (Richardson, 1993). Studies of the effects of envi-ronmental factors on shell growth have been largely based on experimental investigations that have demonstrated close agreement between the microgrowth increment patterns and the expected tidal amplitude changes (Richardson et al., 1979, 1980). This evidence for tidally induced growth patterns in bivalve shells has come from species
growing under macrotidal conditions, tidal regimes characterized by large tidal amplitudes between high and low water and during the spring-neap lunar cycle. In this paper we have provided quantitative evidence for periodicities in the growth patterns in mussels growing in a mi-crotidal regime (tidal amplitudeB2 m). In the study it was impossible to validate the periodicity of the microgrowth increments using marked transplanted mussels, an approach that has been
Table 1
Average Lyapunov exponents derived for every accretionary series at every intertidal level. Significant differences are of no concern (however they do not differ)a
S.E. (10−1) Mean value (10−3)
Tidal position
High intertidal 51 11
Middle intertidal 50 11
60
Low intertidal 10
undertaken successfully elsewhere (Richardson, 1989). S. algosus is a highly mobile mussel occu-pying rocky intertidal Pacific wave-exposed plat-forms and in these situations it would have been extremely difficult to retain marked mussels in cages secured to the shore. Statistical analysis of the microgrowth patterns has allowed the identifi-cation of recurrent periodicities within the growth record of S. algosus although considerable varia-tion in the periodicities amongst mussels from the same tidal level was observed.
Examination of the percentage recurrences within the microgrowth increment record (Fig. 4a) showed good discrimination between the patterns displayed by the mussels inhabiting the high tidal level and those from the middle-low tidal zone. Measurement of the nonlinear dynamical vari-ables, percentage of determinism and entropy sug-gest that the rate of shell deposition in mussels from the high shore level is different from that observed in mussels growing at mid and low tide shore levels (Fig. 4). If the skeletal record were to be used to understand the complex interaction between the physiological condition of the mus-sels and their fluctuating environment as has been
Fig. 4. (a) Mean percentage recurrences derived from RQA for accretionary series. Intertidal positions differ in such a way that the middle and low shore mussels present a lower recur-rence structure than animals from the high intertidal level. Differences are significant (see text). In (b) the Mean determin-ism (percentage) derived from the quantification of recurrences forms strips of three or more points. As in (a) differences are significant (see text), high intertidal animals having a dynami-cally more organized structure than the middle and low ani-mals. (c) Entropy, measured by the Shannon Index of information. The figure shows that the accretionary system in high shore mussels needs more information than the middle and low shore mussels to describe the series of observations, i.e. they are more complex.
Fig. 6. Correspondence of recurrences in time, between a one series of microgrowth increments and the corresponding series of recurrences derived from tidal immersion periods (daily basis) at every intertidal height. There is a clear syncrony in high shore (a) that is lost at middle (b) and low (c) intertidal.
jectories, positive values and those close to zero are indicative of low dimensional deterministic chaos whilst highly positive values can not dis-criminate between high dimensional chaos from ‘random walk’ (Eckmann et al., 1986; Collet, 1992). Biologically the current mathematical analysis implies strong differences in the way in-dividual mussels respond, even when they are growing at the same tidal level under apparently similar growing conditions. Our field observa-tions of S. algosus on wave-swept Chilean shores indicate that it is a mobile mussel moving often daily amongst the dense beds of the dominant mussel species Perumytilus purpuratus. Unlike many bivalve species that remain anchored to the substrate or within the sediment and display pronounced tidal growth patterns (Richardson, 1993) S. algosus’s mobility within a small tidal range (B2 in) may account for the lack of any clearly defined spring-neap lunar tidal pattern in the shells of all but those mussels that exist in the upper shore levels.
Ecologically, it is convenient to have a system that behaves in this way, because organisms that inherently possess deterministic chaos will be more predisposed to reacting to the rich variety of environmental responses that they will be ex-posed to in their natural habitat. This promotes flexibility and adaptability through a diverse repertoire of responses when the organism is faced with unexpected environmental changes (May, 1976; Hoyert, 1992). From the standpoint of shell growth it ensures that the growth pro-cess, normally a continuous one, does not col-lapse when stressful conditions prevail. If a system behaves in a strictly deterministic way then any unexpected event will be reflected as a ‘perturbation’ in the growth process. The growth of mussels occupying wave-swept shores would continually be interrupted by the force of the breaking waves and their swash unless they pos-sessed a growth process that was largely inde-pendent of these perturbations. The correspondence between periodic tidal events and the shell microgrowth patterns in the shells
of S. algosus from the upper shore level suggests
that variability in the growth increments could proposed (Rhoads and Lutz, 1980), then the
tra-be explained by tidal movements. By contrast no temporal connection is apparent between the mi-crogrowth increments and the tidal pattern of immersion imposed on the mussels in the mid-dle and low intertidal levels. This suggests thatS.
algosus has the freedom to respond to extreme
conditions, similar to those experienced by mus-sels and other bivalve species from coastal waters of high latitudes, where the tidal amplitude is large and the organism is periodically emersed or immersed for long periods of the tidal cycle. We suggest that under such macrotidal regimes, when a mussel is emersed for several hours an effective anaerobic pathway becomes operative, the process becomes reversed under immersed conditions. On exposed rocky shores like Playa Blanca (Chile) where a microtidal regime (a small tidal amplitude is in operation), local conditions like windy days and splash, etc. would maintain the mussels under moist and damp conditions and anaerobic metabolism would probably not be usually neces-sary. Observations of S. algosus in their natural environment suggest that during emersion at low tide a fugitive wave is enough to induce the animals to open their shell valves when they would be otherwise closed to avoid desiccation. Thus periods of anaerobiosis during low water will be punctuated by short aerobic events. If the mussels did not possess deterministic chaos be-haviour then the continual switch between aerobic and anaerobic conditions would continually result in disrupted shell deposition rather than continu-ous shell growth.
The present evidence from the shell mi-crogrowth patterns suggests that along the tidal gradient, mussels growing in the upper intertidal zone experience somewhat different growing con-ditions to those growing lower down on the shore, in the middle-low intertidal zone. The growth of the upper shore mussels is in response to the chaotic environmental conditions imposed by the rise and fall of the tides whereas the growth of the mid-lower shore mussels appears to reflect indi-vidual variations in shell deposition. Despite the unstable mechanisms governing shell accretion the morphology of the shell ofS.algosus is similar at the different tidal levels.
Acknowledgements
The work was carried out in the School of Ocean Sciences, University of Wales-Bangor whilst SA was supported by the EU funded ALFA project: Monitoring, Metrology and Con-trol of the Marine and Terrestrial Environment (Contract No. ALR/B7.3011/94.04-5.0088.10). Consumable costs for the work were funded by research grants to CAR. Charles Webber and Joe Zbilut generously provided material to implement the recurrence quantification analyses (RQA).
References
Abraham, F.D., Gilgen, A.R., 1995. Chaos Theory in Psychol-ogy. Praeges, Connecticut.
Collet, P., 1992. Regular and chaotic behaviour of dynamical systems. In: Goles, E., Martı´nez, S. (Eds.), Statistical Physics, Automata Networks and Dynamical Systems. Kluwer, Dordrecht, Netherlands.
Eckmann, J.-P., Kamphorst, S., Ruelle, D., Ciliberto, S., 1986. Lyapunov exponents from a time series. Phys. Rev. A 34, 4971.
Eckmann, J.-P., Kamphorst, S., Ruelle, D., 1987. Recurrence plots of dynamical systems. Europhys. Lett. 4, 973 – 977. Hoyert, M.S., 1992. Order and chaos in fixed-interval
sched-ules of reinforcement. J. Exp. Anal. Behav. 57 (3), 339 – 363.
Legendre, L., Legendre, P., 1983. Numerical Ecology. Devel-opments in Environmental Modelling, vol. 3.
Lutz, R., Rhoads, D., 1980. Growth patterns within the molluscan shell: an overview. In: Rhoads, D., Lutz, R. (Eds.), Skeletal Growth of Aquatic Organisms. Biological Records of Environmental Change. Plenum, New York, pp. 203 – 254.
Lutz, R.A., 1976. Annual growth patterns in the inner shell of Mytilus edulis. J. Mar. Biol. Assoc. UK 56, 723 – 731. May, R., 1976. Simple mathematical models with very
compli-cated dynamics. Nature 261, 459 – 467.
Newell, R.C., 1979. Biology of Intertidal Animals. Maine Ecological Surveys, Faversham, Kent, UK.
Palmer, J.D., 1973. Tidal rhythms. The clock control of the physiology of marine organisms. Biol. Rev. 48, 377 – 418. Pannella, G., MacClintock, C., 1968. Biological and
environ-mental rhythms reflected in molluscan shell growth. J. Paleontol. 42, 64 – 80.
Rhoads, D., Lutz, R., 1980. Skeletal Growth of Aquatic Organisms. Biological Records of Environmental Change. Plenum, New York.
Richardson, C.A., 1993. Bivalve shells: chronometers of envi-ronmental change. In: Morton, B. (Ed.), The Marine Biol-ogy of the South China Sea. Proceedings of the First International Conference on the Marine Biology of Hong Kong and South China Sea. Hong Kong University Press, Hong Kong.
Richardson, C.A., Crisp, D.J., Runham, N.W., 1979. Tidally deposited growth bands in the shell of the common cockle Cerastoderma edule(L.). Malacologia. Proc. Eur. Malacol. Congress. 18, 277 – 290.
Richardson, C.A., Crisp, D.J., Runham, N.W., 1980. An endogenous rhythm in the shell deposition inCerastoderma edule. J. Mar. Biol. Assoc. UK. 60, 991 – 1004.
Richardson, C.A., Crisp, D.J., Runham, N.W., 1981. Factors influencing shell deposition during a tidal cycle in the intertidal bivalveCerastoderma edule. J. Mar. Biol. Assoc. UK. 61, 465 – 476.
Rosenberg, G.D., Runcorn, S.K., 1975. In: Rosenberg, G.D., Runcorn, S.K. (Eds.), Growth Rhythms and the History of the Earth’s Rotation. Wiley, London.
Schreiber, T., 1998. Interdisciplinary application of nonlinear time series methods. In: Habilitationsschrift im Sinne von § 3 Abs.2 der Habilitationsordnung des Fachbereichs Natur-wissenshaften I der Bergischen Universitdt-Gesamthoch-schule Wuppertal.
Stark, J., Broomhead, D.S., Davies, M., Huke, J., 1996.
Takens embedding theorems for forced and stochastic systems. In: Proceedings of the 2nd World Congress of Nonlinear Analysts, Athens, Greece.
Underwood, A., 1997. Experiments in Ecology. Their Logical Design and Interpretation Using Analysis of Variance. Cambridge University Press, Cambridge, UK.
Webber, C., Zbilut, J., 1994. Dynamical assessment of physio-logical systems and states using recurrence plot strategies. J. Appl. Physiol. 76 (2), 965 – 973.
Webber, C., Zbilut, J., 1996. Assessing deterministic structures in physiological systems using recurrence plot strategies. In: Khoo, K. (Ed.), Bioengineering Approaches to Pul-monary Physiology and Medicine. Plenum, New York. Webber, C., Zbilut, J., 1997. Recurring structuring of
dynami-cal and spatial systems. In: Colosimo, A. (Ed.), Complexity in the Living: a Modelistic Approach, Proceedings of an International Meeting, Rome, Italy.
Zbilut, J., Webber, C., Zak, M., 1997. Quantification of heart rate variability using methods derived from nonlinear dy-namics. In: Drzewiecki, G., Li, J. (Eds.), Analysis and Assessment of Cardiovascular Function. Springer, New York.
Zbilut, J., Giuliani, A., Webber, C., 1998. Recurrence quantifi-cation analysis and principal components in the detection of short complex signals. Phys. Lett. A. 237, 131 – 135.
.