THE USE OF PRINCIPAL COMPONENT ANALYSIS IN IDENTIFYING AND
INTEGRATING VARIABLES RELATED TO FORAGE QUALITY AND
METHANE PRODUCTION
A. Jayanegara 1, H. P.S. Makkar 2 and K. Becker 2
1 Department of Nutrition and Feed Technology, Faculty of Animal Science
Bogor Agricultural University, Jl. Agatis Kampus IPB Darmaga Bogor 16680 – Indonesia
2 Department of Animal Production in the Tropics and Subtropics (480b)
University of Hohenheim, Fruwirthstrasse 12, 70593 Stuttgart, Germany Corresponding E-mail: [email protected]
Received Sept 16, 2009; Accepted November 19, 2009
ABSTRACT
This research was aimed to explore the use of multivariate statistics i.e. principal component analysis (PCA) in identifying and integrating variables related to forage quality and ruminal methane production, and in classifying forage species into both characteristics. Seventeen plants were used as a database for the above mentioned purposes. Plant samples were determined for their chemical composition, cumulative gas production (represents the nutrient degradation) and methane production after 24 hours of fermentation period using the Hohenheim gas test. The results showed that the PCA could clearly identify factors related to forage quality and methane production and separated them into different principal components (PC). The obtained PC1 was related to methane production and substantially influenced positively by crude protein, NDF, ADF (positive), total phenols, total tannins, condensed tannins and tannin activity (negative). On the other hand, the obtained PC2 was related to cumulative gas production (forage quality) and substantially influenced by crude protein (positive), NDF, ADF and condensed tannins (negative). Classification and screening of forages that have high quality and low methane production are possible using the PCA technique. Rhenum undulatum, Peltiphyllum peltatum and Rhus typhina were found to have such desired characteristics.
Key words: PCA, multivariate, gas, quality, methane, forage
INTRODUCTION
Productivity of ruminants is affected by the quality of forage consumed. Several factors related to quality of forage are energy content, fiber, protein, anti-nutritional compounds and the digestibility of forage in gastro-intestinal tract. On the other hand, the concern on global warming due to accumulation of green-house gases has increased in the last decades, especially for CO2 (carbon dioxide), CH4 (methane) dan N2O (dinitrogen oxide). Ruminants are among major contributors of methane accumulation in the atmosphere which is generated from microbial fermentation in the rumen. Methane produced by ruminants contributes to 95% of the anthropogenic total methane and 18% of the total green-house gases in the atmosphere (Kreuzer & Soliva, 2008). Methane emission is not only associated with environmental problem but also reflects the loss of energy from animal and, hence, can not be utilized for production purpose.
Approximately 6–10% of the gross energy of the feed consumed by ruminants is lost as methane (Jayanegara, 2008a).
The above-mentioned factors have led to the exploration of forages that not only good in quality but also able to reduce methane formation in the rumen. Statistical evaluation on forage quality and ruminal methane emission so far is limited to univariate analysis, especially the analysis of variance (ANOVA) and followed by post-hoc tests after ANOVA such as Fischer’s test (LSD, least significant difference), Duncan’s test and Tukey’s test (honestly significant difference). Orthogonal contrast and polynomial orthogonal have also been used for analyzing structured treatments, both structured qualitatively and quantitatively. However, the use of multivariate statistics for data exploration that involved many variables simultaneously was scarcely done.
variables related to forage quality and methane emission. It was expected that by the use of PCA, variables determining forage quality and methane emission can be identified simultaneously as well as their relationships. Moreover, PCA technique is possible to be used for classification of forages according to their intrinsic characteristics. In this case, the author was interested to obtain forage species possessing high quality and low methane formation in the rumen.
MATERIALS AND METHODS
Forage and Data Sources
The data used in the present study were from Jayanegara et al. (2009a) with total of 17 forage species (Table 1). All samples except Salix alba, Rhus typhina and Peltiphyllum peltatum were collected from Mongolia. The plants collected from Mongolia were used locally in the region of production as medicinal plants. Salix alba and R. typhina were collected from the Botanical Garden of the University of Hohenheim in Stuttgart
(Germany) and P. peltatum was provided by Dr. John Wallace from the Rowett Research Institute in Aberdeen (UK). Prior to chemical composition analysis, all forages were air-dried, ground and passed to a 1 mm sieve.
Chemical Composition Analysis of Forage Forage samples were analyzed for their dry matter (DM) content using oven at 100 oC for 16 h. Crude protein (CP) and ether extract (EE) were analyzed according to AOAC (1990), whereas neutral detergent fiber (NDF) and acid detergent fiber (ADF) were analyzed by the method of Van Soest et al. (1991). Total phenols (TP) and total tannins (TT) were determined using Folin-Ciocalteu method, while condensed tannins (CT) using the butanol-HCl-Fe method (Makkar, 2003). Total phenols and total tannins were expressed as tannic acid equivalent, while condensed tannins was expressed as leucocyanidin equivalent. Biological activity of tannins was determined based on the in vitro gas production increase with or without polyethylene glycol (PEG) addition
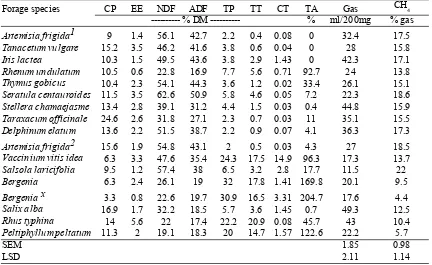
Table 1. Forage database used in principal component analysis (PCA)
Forage species CP EE NDF ADF TP TT CT TA Gas
--- % DM --- % ml/200mg % gas
9 1.4 56.1 42.7 2.2 0.4 0.08 0 32.4 17.5
Tanacetum vulgare 15.2 3.5 46.2 41.6 3.8 0.6 0.04 0 28 15.8
10.3 1.5 49.5 43.6 3.8 2.9 1.43 0 42.3 17.1
10.5 0.6 22.8 16.9 7.7 5.6 0.71 92.7 24 13.8
10.4 2.3 54.1 44.3 3.6 1.2 0.02 33.4 26.1 15.1
11.5 3.5 62.6 50.9 5.8 4.6 0.05 7.2 22.3 18.6
13.4 2.8 39.1 31.2 4.4 1.5 0.03 0.4 44.8 15.9
24.6 2.6 31.8 27.1 2.3 0.7 0.03 11 35.1 15.5
13.6 2.2 51.5 38.7 2.2 0.9 0.07 4.1 36.3 17.3
15.6 1.9 54.8 43.1 2 0.5 0.03 4.3 27 18.5
6.3 3.3 47.6 35.4 24.3 17.5 14.9 96.3 17.3 13.7
9.5 1.2 57.4 38 6.5 3.2 2.8 17.7 11.5 22
6.3 2.4 26.1 19 32 17.8 1.41 169.8 20.1 9.5
3.3 0.8 22.6 19.7 30.9 16.5 3.31 204.7 17.6 4.4
16.9 1.7 32.2 18.5 5.7 3.6 1.45 0.7 49.3 12.5
14 5.6 22 17.4 22.2 20.9 0.08 45.7 43 10.4
11.3 2 19.1 18.3 20 14.7 1.57 122.6 22.2 5.7
SEM 1.85 0.98
LSD 2.11 1.14
Source: Jayanegara et al. (2009a)
CH4
Artemisia frigida1
Iris lactea
Rhenum undulatum Thymus gobicus Seratula centauroides Stellera chamaejasme Taraxacum officinale Delphinum elatum
Artemisia frigida2 Vaccinium vitis idea Salsola laricifolia Bergenia
Bergenia x Salix alba Rhus typhina
Peltiphyllum peltatum
CP, crude protein; EE, ether extract; NDF, neutral detergent fiber; ADF, acid detergent fiber; TP, total phenols; TT, total tanins; CT, condensed tannins; TA, tannin activity
after 24 h fermentation (Jayanegara and Sofyan, 2008).
Determination of forage quality and methane production
Forage quality was determined in vitro using Hohenheim gas production method (Menke et al., 1979). Detailed description of this method can be seen in Jayanegara & Sofyan (2008). Forage quality was associated with total gas production due to very high correlation (r2 = 0,92) between recording the total gas production, the outlet of in vitro syringe was inserted to the inlet of methane analyzer. Data obtained was percentage of methane in the total gas.
Statistical Analysis
Principal component analysis (PCA) was applied to the obtained data using SPSS software version 17.0. The PCA technique transforms the number of original variables into few new variables called principal components (PC). The result was presented as loading plot (the relationship of variables) and score plot (used in the classification of forage).
RESULTS AND DISCUSSION
Reduction of Variables into Principal Components
Principal component analysis or PCA is a multivariate statistics method that involved data reduction from correlated variables (Fievez et al., 2003). Ian (2005) stated that when large multivariate datasets are analyzed, it was often desirable to reduce their dimensionality using PCA technique. It replaces the original variables by a smaller number of derived variables, the principal components, which are linear combinations of the original variables. Often, it is possible to retain most of the variability in the original variables with very few derived variables. The PCA technique so far is scarcely applied in the field of animal science. However, there were some authors reported the use of PCA in their data analysis such as Destefanis et al. (2000), Fievez et al. (2003) and Kadegowda et al. (2008).
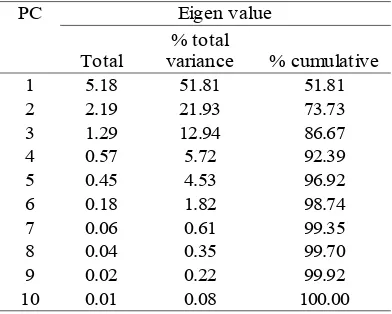
Reduction of variables using PCA started by examining Eigen values. The Eigen value of each principal component (PC) is presented in Table 2, arranged from the highest to the lowest values. Kaiser (1960) recommended to explore only the PC whose Eigen values higher than 1.0 since they reflect considerable amount of variation to the total variation. In the present study, there are three PC whose Eigen values > 1.0, i.e. PC1, PC2 and PC3. PC1 has Eigen value of 5.180, whereas PC2 and PC3 have Eigen values of 2.193 and 1.294, respectively. PC1 to PC3 represent 51.81%, 21.93% and 12.94% of the total variation, respectively, and all of them contribute 86.67% to the total variation. Therefore, only these three PC which are used further for derivatizing factor loading.
Factor Loading and Relationship between Variables
Factor loading is the correlation between the original variable and the factor derived from PCA (Field, 2005), and the values range from –1 to 1. A value close to –1 or 1 shows a strong correlation between a variable and a factor, whereas a value close to 0 shows a weak correlation. As a rule of thumb, Field (2005)
recommended to interprete only the factor loading whose absolute value higher than 0.4 which explains 16% of the total variation. Factor loading of each variable in the PC whose Eigen value > 1.0 is presented in Table 3.
PC1 can be interpreted as the factor related to methane formation in the rumen in vitro (factor loading of methane production in PC1 = 0.881).
Crude protein (CP), NDF and ADF contribute to the increase of methane production with the factor loading of 0.556, 0.758 and 0.745, respectively. Phenolic compounds in forage i.e. total phenols (TP), total tannins (TT), condensed tannins (CT) and tannins activity (TA) lead to the decrease of methane with the factor loading of –0.959, – 0.916, –0.420 and –0.945, respectively. The next component i.e. PC2 can be interpreted as the factor related to forage quality (factor loading of cumulative gas production = –0.753). Crude protein contribute positively to the forage quality with factor loading of –0.672, while NDF, ADF and CT contribute negatively to the forage quality with factor loading of 0.599, 0.552 and 0.531, respectively. However, PC3 is not easy to be interpreted since there is only ether extract (EE) component whose factor loading higher than 0.4 i.e. 0.913.
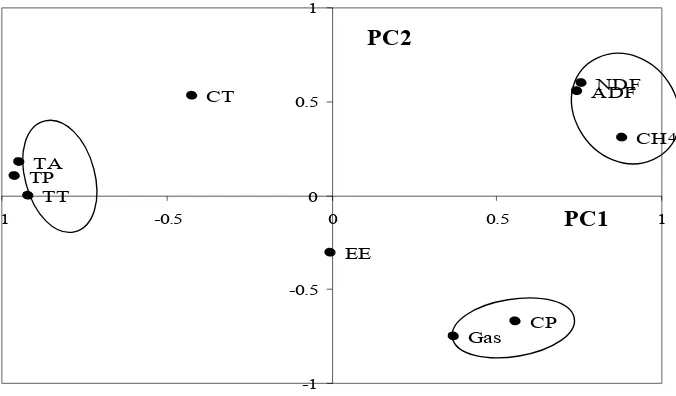
The relationship between variables is presented in Figure 1. It is the plot of factor loading in PC1 (variables related to methane production) and PC2 (variables related to forage quality). Component NDF and ADF contribute in increasing methane production in the rumen. Higher fiber content increases methane production by shifting short chain fatty acid proportion towards acetate which produces more hydrogen as a substrate in the methanogenesis pathway (Beauchemin et al., 2008). Therefore, one approach to reduce methane emission in ruminants is by increasing concentrate proportion which means increasing soluble carbohydrate fraction in the ration (Kreuzer & Soliva, 2008).
This approach seems to be not practical in the developing countries, however, since it increases production cost which may not be compensated by the increase of animal’s productivity.
Phenolic compounds in the form of TP, TT and TA have considerable contribution in the reduction of methane emission, while weaker effect is of CT. This is in agreement with some previous reports, both tannin phenolics (Carulla et al., 2005; Puchala et al., 2005) and non tannin phenolics (Jayanegara, 2009b). The mechanisms of phenolic compounds in inhibiting methane formation in ruminants have been proposed by Tavendale et al. (2005), i.e. (1) indirectly, through reduction in fibre digestion, which decreases H2 production, and (2) directly, through inhibition of the growth of methanogens. It seems that the condensed tannins decrease methane more
Variable PC1 PC2 PC3
CP 556 98
EE 913
NDF 758 599 184
ADF 745 552 208
TP 103 186
TT 0 353
CT 531 386
TA 174
Gas 371 132
881 309 91
Table 3. Factor Loading of Each Variable in the Principal Components (PC) whose Eigenvalue > 1.0
–0,672 -–0,003 –0,304
–0,959 –0,916 –0,420
–0,945 –0,199
–0,753 CH4
Figure 1. Relationship between variables in PC1 (x) and PC2 (y).
CP EE
NDF ADF
TP TT
CT
TA
Gas
CH4
-1 -0.5 0 0.5 1
-1 -0.5 0 0.5 PC1 1
through the first mechanism, while hydrolysable tannins act more through the second mechanism and/or through inhibition of hydrogen producing microbes. Additionally, tannins could decrease the activity of methanogens. Furthermore, tannins are known to decrease protozoal number (Makkar et al., 1995) and as discussed above, the decrease in methane production could be mediated through decrease in protozoal number.
Factors that influence forage quality can also be identified in Figure 1. Crude protein positively contributes to forage quality, whereas CT, NDF and NDF negatively influence the forage quality. Protein is easily digested fraction by rumen microbes (Fox et al., 2004) and, hence, increasing cumulative gas production. On the other hand, the relationship between highly fiborous materials and low digestibility has been well recognized. Structural components of plant such as cellulose, lignin, cell wall, NDF and ADF negatively influenced nutrient digestibility of sheep in vivo, while soluble carbohydrate (starch) and crude
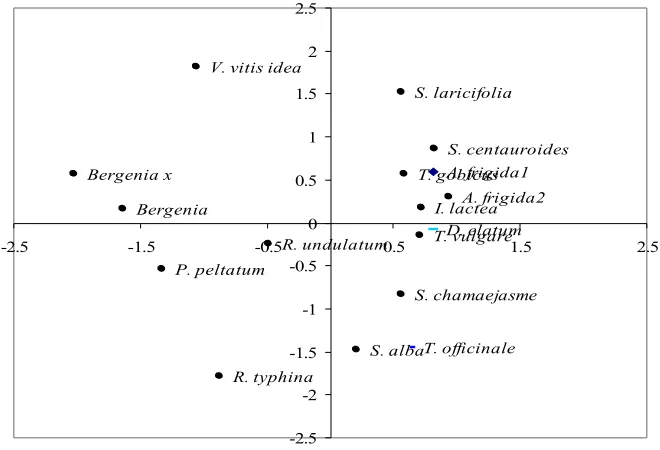
Factor Score and Forage Quality Classification Factor score is a relative score of each object (in this case the object is forage species) in a principal component (Field, 2005). Factor score
can be used for forage quality classification multivariately by plotting PC1 as horizontal axe (x) and PC2 as vertical axe (y) in two dimension. The result of forage classification based on factor score is presented in Figure 2. In PC1 (horizontal axe), direction to the positive value (right) shows high methane production. On contrary, direction to the negative value (left) shows low methane production. In PC2 (vertical axe), direction to the positive value (up) shows low cumulative gas production which means low forage quality. Conversely, direction to the negative value (down) shows high forage quality (high cumulative gas production). Therefore, forages can be classified into four quadrants (Figure 2), i.e. quadrant I (forages with high methane and low quality), quadrant II (forages with low methane and low quality), quadrant III (forages with low methane and high quality) and quadrant IV (forages with high methane and high quality).
Figure 2 can be interpreted differently according to different purposes. One may have interest in screening forage species possessing low methane production and high quality, i.e. forages in quadrant III. One may also want to avoid the use of forages possessing high methane production and low quality, i.e. forages in quadrant I. There are three forages in quadrant III, i.e. Rhenum undulatum, Peltiphyllum peltatum and Rhus typhina. This means that these forages have high potential to be widely used as ruminants’ feed since they possess not only high quality for production purpose, but also have
Figure 2. Factor score of each forage species in PC1 (x) and PC2 (y).
ability to reduce methane emission compared to other forages and give additional benefit by decreasing the rate of methane accumulation in the atmosphere and global warming.
CONCLUSION
Principal component analysis (PCA) technique may be used in identifying and integrating variables related to forage quality and ruminal methane production simultaneously. Components CP, NDF and ADF increase methane production, while phenolic compounds like TP, TT, CT and AT decrease the methane production. Component CP also positively related to forage quality, while NDF, ADF and CT negatively related to the forage quality. Moreover, PCA may be used in forage classification, and in this case is used for screening of forages possessing high quality and low methane production. In the present study, based on the PCA technique, Rhenum undulatum, Peltiphyllum peltatum dan Rhus typhina were found to have such desirable characteristics. Nevertheless, there is a need to conduct such screening approach using larger databases to obtain most promising multi purpose forages in a wider scale.
REFERENCES
AOAC. 1990. Official Methods of Analysis, 15th edition. Association of Official Analytical Chemists, Arlington, VA, USA.
Beauchemin, K.A., S.M. McGinn, T.F. Martinez and T.A. McAllister. 2007. Use of condensed tannin extract from quebracho trees to reduce methane emissions from cattle. J. Anim. Sci. 85: 1990–1996.
Beauchemin, K.A., M. Kreuzer, F. O’Mara and T.A. McAlister. 2008. Nutritional management for enteric methane abatement: a review. Aust. J. Exp. Agric. 48:21–27. Carulla, J.E., M. Kreuzer, A. Machmüller and
H.D. Hess. 2005. Supplementation of Acacia mearnsii tannins decreases methanogenesis and urinary nitrogen in forage-fed sheep. Aust. J. Agric. Res. 56:961–970.
De Boever, J.L., J.M. Aerts, J.M. Vanacker and D.L. De Brabander. 2005. Evaluation of the nutritive value of maize silages using a gas production technique. Anim. Feed Sci. Technol. 123: 255–265.
Destefanis, G., M.T. Barge, A. Brugiapaglia and S. Tassone. 2000. The use of principal component analysis (PCA) to characterize beef. Meat Sci. 56: 255–259.
Field, A. 2005. Discovering Statistics using SPSS. Second Edition. SAGE Publications, London.
Fievez, V., B. Vlaeminck, M.S. Dhanoa and R.J. Dewhurst. 2003. Use of principal component analysis to investigate the origin of heptadecenoic and conjugated linoleic acids in milk. J. Dairy Sci. 86: 4047–4053. Fonnesbeck, P.V., J.L. Christiansen and L.E.
Harris. 1981. Factors affecting digestibility of nutrients by sheep. J. Anim. Sci. 52: 363– 376.
Fox, D.G., L.O. Tedeschi, T.P. Tylutki, J.B. Russel, M.E. Van Amburgh, L.E. Chase, A.N. Pell and T.R. Overton. 2004. The Cornell Net Carbohydrate and Protein System model for evaluating herd nutrition and nutrient excretion. Anim. Feed Sci. Technol. 112: 29–78.
Goel, G., H.P.S. Makkar and K. Becker. 2008. Effect of Sesbania sesban and Carduus pycnocephalus and Fenugreek (Trigonella foenum-graecum L.) seeds and their extracts on partitioning of nutrients from roughage- and concentrate-based feeds to methane. Anim. Feed Sci. Technol. 147: 72–89. Ian, J. 2005. Principal Component Analysis. John
Wiley and Sons, Ltd., Aberdeen, UK. Jayanegara, A. 2008a. Reducing methane
emissions from livestock: nutritional approaches. Proceedings of Indonesian Students Scientific Meeting (ISSM), Institute for Science and Technology Studies (ISTECS) European Chapter, 13-15 May 2008, Delft, the Netherlands: 18–21.
Jayanegara, A. and A. Sofyan. 2008b. Penentuan aktifitas biologis tannin beberapa hijauan secara in vitro menggunakan ‘Hohenheim Gas Test’ dengan polietilen glikol sebagai determinan. Med. Pet. 31 (1): 44–52.
Jayanegara, A., N. Togtokhbayar, H.P.S. Makkar and K. Becker. 2009a. Tannins determined by various methods as predictors of methane production reduction potential of plants by an in vitro rumen fermentation system. Anim. Feed Sci. Technol. 150: 230–237. Jayanegara, A. 2009b. Ruminal methane
Kadegowda, A.K.G., L.S. Piperova and R.A. Erdman. 2008. Principal component and multivariate analysis of milk long-chain fatty acid composition during diet-induced milk fat depression. J. Dairy Sci. 91: 749– 759.
Kaiser, H.F. 1960. The application of electronic-computers to factor-analysis. Educ. Psychol. Meas. 20: 141–151.
Kreuzer, M. and C.R. Soliva. 2008. Nutrition: key to methane mitigation in ruminants. Proc. Soc. Nutr. Physiol. 17: 168–171.
Makkar, H.P.S., M. Blümmel & K. Becker. 1995. In vitro effects of and interactions between tannins and saponins and the fate of tannins in the rumen. J. Sci. Food Agric. 69: 481– 493.
Makkar, H.P.S. 2003. Quantification of Tannins in Tree and Shrub Foliage, A Laboratory Manual. Kluwer Academic Publishers, p. 102.
Menke, K.H., L. Raab, A. Salewski, H. Steingass, D. Fritz and W. Schneider. 1979. The
estimation of the digestibility and metabolisable energy content of ruminant feedingstuffs from the gas production when they are incubated with rumen liquor. J. Agric. Sci. 93: 217–222.
Puchala, R., B.R. Min, A.L. Goetsch and T. Sahlu. 2005. The effect of a condensed tannin-containing forage on methane emission by goats. J. Anim. Sci. 83: 182–186.
Tavendale, M.H., L.P. Meagher, D. Pacheco, N. Walker, G.T. Attwood and S. Sivakumaran. 2005. Methane production from in vitro rumen incubation with Lotus pedunculatus and Medicago sativa, and effects of extractable condensed tannin fractions on methanogenesis. Anim. Feed Sci. Technol. 123/124: 403–419.