Berly Martawardaya (FEUI)
Disampaikan pada Diskusi IESR
Jakarta, 23 September 2015
Negara yang kaya sumber daya alam justru
rendah pertumbuhan ekonomi, lemah
industrialisasi dan rawan konflik (Sach &
Warner 2001, Frankel 2010)
3
The Resource Curse: Introduction
It has been observed for some decades that the possession of oil or other valuable
mineral deposits or natural resources does not necessarily confer economic success.
Many African countries such as Angola, Nigeria, Sudan, and the Congo are rich in oil,
diamonds, or other minerals, and yet their peoples continue to experience low per capita
income and low quality of life. Meanwhile, the East Asian economies Japan, Korea,
Taiwan, Singapore and Hong Kong have achie ved western-level standards of living
despite being rocky islands (or peninsulas) with virtually no exportable natural resources.
Auty (1993, 2001) is apparently the one who coined the phrase “natural resource curse”
to describe this puzzling phenomenon. Its use spread rapidly.
1
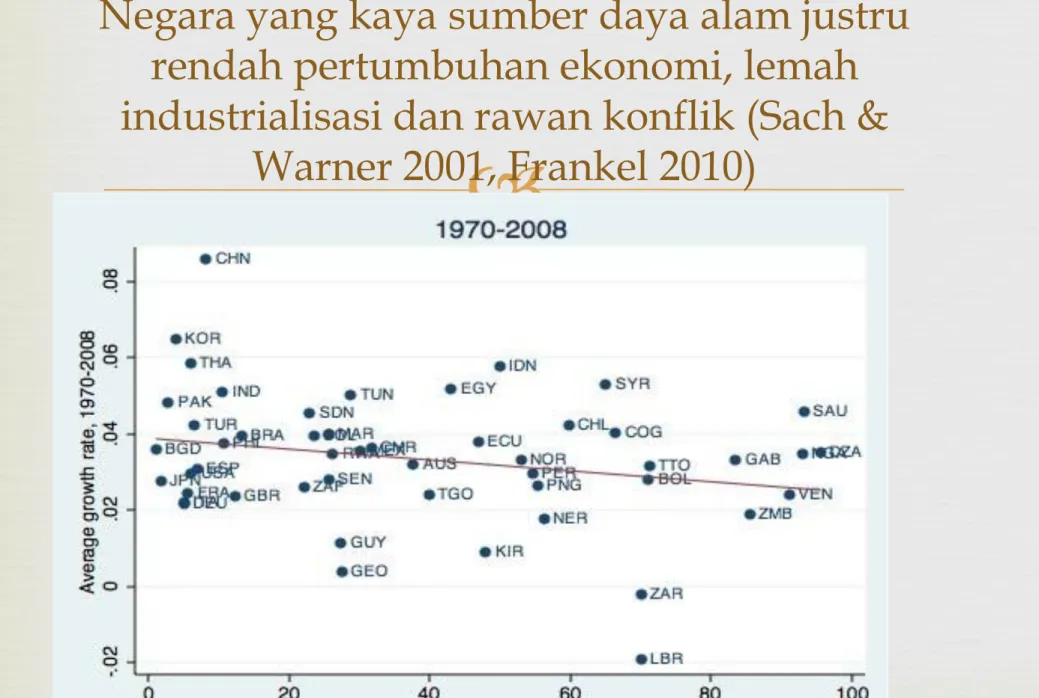
Figure 1 illustrates for a cross section of countries, over the last four decades.
Exports of fuels, ores and metals as a fraction of total merchandise exports appear on the
horizontal axis and economic growth on the vertical axis. Conspicuously high in growth
and low in natural resources are China and some other Asian countries. Conspicuously
high in natural resources and low in growth are Venezuela and Zambia. The overall
relationship on average is slightly negative. The negative correlation is not very strong,
masking almost as many resource successes as failures. But it certainly suggests no
positive correlation between natural resource wealth and economic growth.
Figure 1: Statistical relationship between mineral exports and growth.
1
Two other surveys of the resource curse, Stevens (2003) and van der Ploeg (2010), are
written for energy specialists and economic theorists, respectively. The present survey
casts a wider net, is intended for a more general audience, and offers policy prescriptions.
40
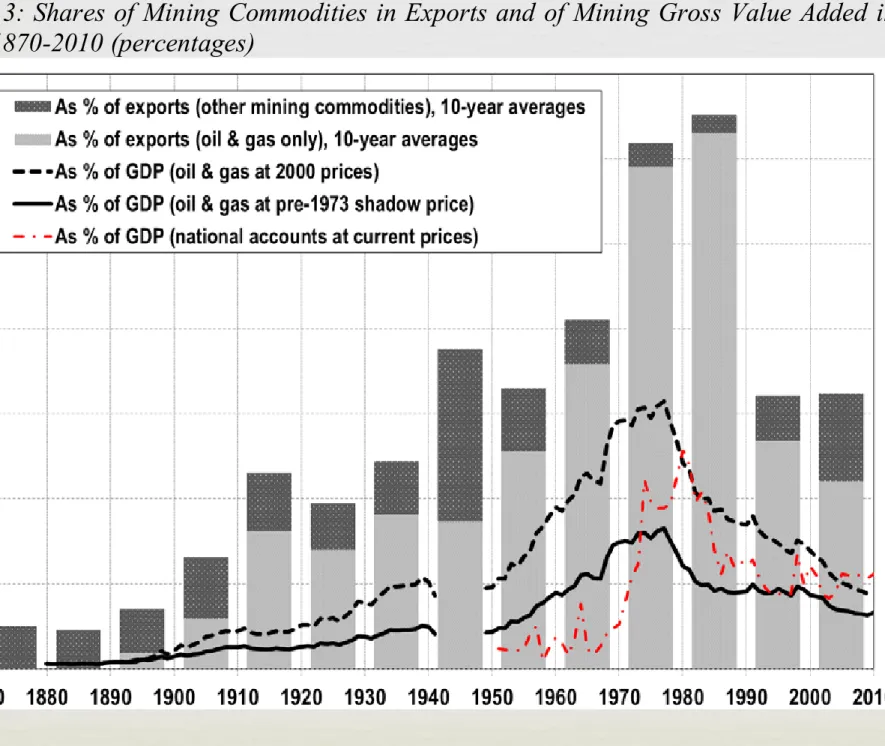
Figure 3: Shares of Mining Commodities in Exports and of Mining Gross Value Added in
GDP, 1870-2010 (percentages)
Notes: No data 1942-45 for foreign trade and 1942-48 for GDP. Van der Eng (2010) only
contains GDP estimates in 2000 prices, not current prices. Nominal oil and gas prices in
Indonesia rose by a factor of 465 from 1973 to 2010, while nominal prices of all other
goods and services combined rose by a factor of 180. The share of oil and gas GVA in GDP
in 2000 prices is therefore also estimated with just 40% of GVA in oil and gas as a proxy
for the contribution of oil and gas to total GVA at an assumed pre-1973 shadow price.
Sources: Calculated from Indonesia’s foreign trade statistics 1870-2010, see the Appendix;
Indonesia’s national accounts in current prices 1951-2010; GVA in Mining in 2000 prices,
see Figure 1; GDP in 2000 prices 1880-2010 Van der Eng (2010), replacing the old
estimates of total GVA in mining with the ones in Figure 1.
41
Figure 4: Share of Tax and Non-Tax Income from Mining in Total Central Government
Revenue and in Gross Value Added from Mining, 1870-2010 (percentages)
Notes: No data for 1942-47. 1870-1940 comprises net government income from tin, coal,
gold and silver mining, revenues from mining concessions, dividends from NIAM and
GMB joint ventures, oil industry crisis levy in the 1930s, mining export duties and mining
company tax (both estimated from totals in proportion to the share of mining in exports),
and excludes income from the salt monopoly; 1948-2010 comprises 1948-66 mining
company tax and 1948-2010 mining-related export duties (both estimated from totals in
proportion to the share of mining in exports), 1952-59 net transfers from all SOEs, 1960-72
net transfers from SOEs Permina and Pertamina, 1967-89 oil company tax, 1990-2010
non-tax revenue from mining, 1994-2010 net profit transfers by SOEs (mining SOEs were
predominant), 1999-2010 income tax from oil and gas firms.
Sources: Mining GVA in current prices, see the Appendix; government income 1870-1940
calculated from Encyclopedia (Vol.1: 750-758; Vol.7: 154-163), Mulder (1938), and budget
papers included in Bijlagen bij de Handelingen van de Staten Generaal (1870-1940) and
Bijlagen bij de Handelingen van de Volksraad (1918-1942); 1948-2010 from Nota
Keuangan Negara (1948-1959), Statistik Keuangan (1960-89), Statistik Ekonomi dan
Keuangan Indonesia (1990-2010).
2012 © S KMIG A S – A ll ri gh ts re se rve d
5
0
50
100
150
200
250
300
Others
Malaysia
Other Africa
Indonesia
Egypt
Australia
Vietnam
Oman
India
Azerbaijan
Ecuador
Norway
Mexico
Algeria
Angola
Brazil
China
Qatar
Kazakhstan
Nigeria
US
Libya
Russian Federation
United Arab …
Kuwait
Iraq
Iran
Canada
Saudi Arabia
Venezuela
MMMBO
World Proven Oil Reserves
Indonesia’s proven oil reserve: 3.6
BBO
is rank #27, only 0.2% of total world
Total world oil reserves
Des-2013: 1684 billion barrel
0
200
400
600
800
1000
1200
Others
Vietnam
Ukraine
Pakistan
Netherlands
Azerbaijan
Oman
Uzbekistan
Malaysia
Other Africa
India
Kazakhstan
Libya
Kuwait
Egypt
Canada
Norway
Indonesia
China
Iraq
Australia
Algeria
Nigeria
Venezuela
United Arab …
Saudi Arabia
US
Turkmenistan
Qatar
Russian Federation
Iran
World Proven Gas Reserves
TCF
Indonesia’s gas reserve: 100 TCF
is rank #14, only 1.5% of total world
Total world gas reserves
Des-2013: 6558 TCF
Indonesia bukan
negara kaya
minyak……
… dan bukan
negara kaya
gas……
Apakah Indonesia Negara Kaya Migas?
2012 © S KMIG A S – A ll ri gh ts re se rve d