Web Based Map Generations of Mobile Robot Movement using
Scalable Vector Graphic
Harindra Wisnu Pradhana#1, Achmad Widodo#2, Suryono#3 1
Dept. of Information System, 2Dept. of Mechanical Engineering, 3Dept. of Physics #
Diponegoro University 1
JL Imam Barjo Semarang Indonesia, 2,3JL Prof. Sudharto SH Semarang Indonesia 1
[email protected], [email protected], [email protected]
Abstract—Mobile robot movement carry various valuable information. The mobile robot movement needs to be visualized in order to get understood by human eye. This paper describes the process of movement data composition and conversion to prepare the information required to build a map. The map composed by mapping every movement into polar coordinate area. The map stored into a database for flexible future usage. Commonly used web based interface chosen to display the map via web browser. The map generated by server side script that transforms polar data into full map. For observation purpose, sample robot movement used to test the map generation result.
Keywords: mapping, web, robot, vector, SVG.
INTRODUCTION
The development of mobile robotics leads human being into a whole new era. Many human doing job and activity being replaced by autonomous robot. These robots are in charge of taking dangerous, heavy lifting and also boring monotone jobs from our daily activity. Some of these robots are stand in one particular place, but some others are continuously moving from one place to another. Mobile robot have a particular job such as bringing materials from one place to another, observing line of progress or as a scout discovering new places or environment. Some of these mobile robots had its own map and movement path, but the scouting robot barely knew the area of observation.
This research would try to develop a mechanism to build map automatically from a mobile robot movement. Movement of a mobile robot can be represented as a vector which contains angle and distance of the movement [3]. A vector itself consists of several components for
example vector
⃗
A
consists of scalar component la andangular component θa [3]. These vector components illustrated on the Fig. 1 below.
Vector Components
Vector
⃗
A
can also be extracted into horizontal component and vertical component. Fig. 1 show usvertical component of vector
⃗
A
labeled Ay andhorizontal component of vector
⃗
A
labeled Ax. Reference [1] show simple trigonometry used to extract the vertical and horizontal component of a vector described in (1) and (2).
A
y=
l
sin
θ
A
x=
l
cos
θ
Vector Additions
Fig. 2 above shows us components of vectors being
added each other. For vectorC⃗ with scalar componentlc
and angular componentθc as the result of ⃗A+ ⃗B , the addition described in (3) and (4).
l
c=
√
(
l
asin
θ
a+
l
bsin
θ
b)
2
+ (
l
acos
θ
a+
l
bcos
θ
b)
2
θ
c=
tan
−1(
l
asin
θ
a+
l
bsin
θ
b)
(
l
acos
θ
a+
l
bcos
θ
b)
MOBILE ROBOT MOVEMENT
Calibration
To get the precise information of the movement of the mobile robot, a calibration process needs to be done first. The calibration process compares the data parsed from the robot into the system with the measurement of the movement of the robot. The data parsed from the robot are expressed as a digital integer value, and the measurement of the movement expressed as a scalar value in millimeters for straight movement and angle for the rotating movement. As the result, a coefficient of the movement will be stored in millimeters per step for the straight movement and angle per step for the rotating movement. For s is straight movement coefficient and r is rotating movement coefficient conversion process can be described in (5) and (6).
l
=
s
×
l
parse θ=r×θparse
Movement Data Composition
In order to gather the information of robotic movement, the data parsed need to be composed into
standard form and stored into database [4]. The data stored need to carry every important aspects of the movement which is the vector components. To save data storage, only the basic components of the vectors stored, they are the angle and distance of the movement. The movement a mobile robot can be illustrated in Fig. 3.
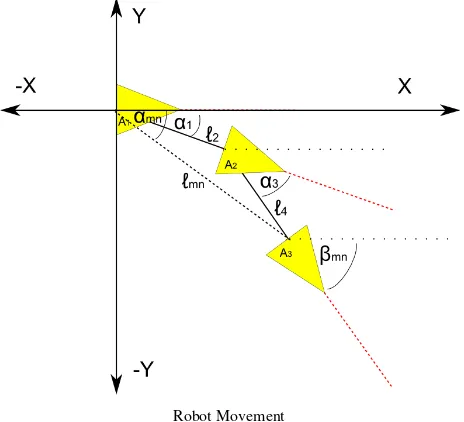
Robot Movement
Fig. 3 above show the movement of a mobile robot represented in angular and scalar form. The position of robot at A2 is the movement from A1 to A2 and the position of robot at A3 are resultant of movement from A1 to A2 and from A2 to A3, therefore we can conclude that a final position of the robot from its initial position are the sum
of every movement vector. For A⃗n is the final position of
robot on step n with two componentln and αn and also β is the angle where the orientation of the robot, using vector addition concept on (3) and (4), movement recapitulations process can be described with (7) and (8) when the final orientation of the robot described in (9).
l
n=
√
(
∑
x=1x=n
l
xsin
θ
x)
2+ (
∑
x=1x=n
l
xcos
θ
x)
2(7)
θ
n=
tan
−1
(
∑
x=1
x=n
l
xsin
θ
x)
(
∑
x=1
x=n
l
xcos
θ
x)
β
n=
∑
x=1x=n
θ
x
MAP PREPARATION
Scalable Vector Graphics
to fulfill the demand of information and the available shapes of an SVG.
The SVG uses Cartesian coordinate system which requires the vertical and horizontal component of a vector in order to be drawn [2]. The Cartesian system of SVG actually flipped vertically compared with the common Cartesian coordinate system. The SVG positive y-axis are pointing down while the y-axis of common coordinate system pointing up. The SVG coordinate also limited on the drawing area which only show the certain area on positive axis both x and y.
Visualization in this research will use standard SVG path using previously defined marker to show the movement direction of the mobile robot. The mobile robot final position showed on the map using triangle shaped SVG polygon. The smallest angle of the triangle show the front end of the robot and the shortest side of the triangle show the rear end of the robot.
Data Preparations
To illustrate every movement vector position, every vector start and end point gathered and plotted into Cartesian area. As mentioned before, every starting point of every vector's is the end point of the previous vector. So the movement information of the mobile robot can be rendered as an SVG path passing through every end point of each vertically flipped vector.
In order to maintain the visibility of the map, several variable need to be declared first such as map height, map width and map margins. These map variables can be set by the program or user input. The actual map needs to be transformed to match the drawing area of SVG. Both vertical and horizontal area must be included on the drawing area. Information comparison between the width and height required to decide will it be horizontally or vertically aligned. Calculation of map height and width required to determine the comparison.
The drawing area need to be reduced by the margin size. Since the margin take place on all four side of the map, the height and the width need to be subtracted by the margin twice.
Before plotting, every point of the data needs to be transformed into Cartesian form. The data then shorted to find the maximum and minimum value of both horizontal and vertical axis to estimate the map size.
For every point available on the map represented as
The ratio of the map and the drawing area compared to Fig. out which area are wider in perspective ratio. If the map ratio bigger than the drawing area, the map will be horizontally fitted into the drawing area and vertically
center aligned, otherwise if the drawing area ratio bigger than the map, the map will be vertically fitted into the drawing area and horizontally center aligned.
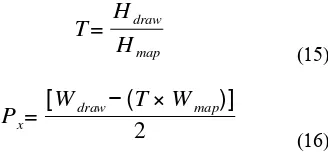
For height, width, ratio and transformation coefficient represented as H, W, R and T, (12) applies.
if Rmap < Rdraw, and horizontal padding represented as Px, (15) and (16) applies the vertical value. The transformation processes described in (17) and (18).
X
draw=
T
(
X
map−
X
min)+
M
+
P
x
Y
draw=
H
draw−
T
(
Y
map−
Y
min)+
M
−
P
y Equations (17) and (18) show minimum value of x and y added into the coordinate as subtraction value of x and y. The subtraction with the minimum value used to make sure all of the point passed by the robot shown on the SVG map. When the minimum value is negative, this subtraction will add the minimum point and move it into zero axis. Otherwise when the minimum value is positive, this subtractions reduce the minimum point and move it into zero axis.
MAP GENERATION
The generations of the map require the data to be processed using the previously described term and equations. After the data processing complete, the map can be plotted into drawing area using SVG tags.
Data Processing
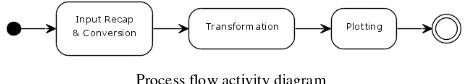
explanation. The process flows illustrated on the diagram in Fig. 4 below.
Process flow activity diagram
Fig. 4 above shows the three steps of data visualization from the input processing, map transformation and the plotting. The input recapitulations and conversions process can be detailed on the diagram in Fig. 5 below.
Input recap & conversion activity diagram
The transformation process begins with determination of both map and drawing area width, height and ratio. The transformation process also had a conditional check is the ratio of the map larger than the ratio of the drawing area, if so the process then calculating T based on width and also calculate Py. Otherwise if the ratio of the drawing area larger than the ratio of the map then calculating T based on height and also calculate Px. Every point on the map then transformed. Transformation processes displayed in Fig. 6 below.
Transformation activity diagram
Data Plotting
The information plotted into the drawing area using SVG tags. As mentioned before, there are several shapes used explained further below.
A triangle shape drawn to the drawing area to represents the robotic position. The triangle encoded using a polygon tag that mentions all the vertex of the triangle. The sides of the triangle drawn in black with 1pixel width and the inner of the triangle filled with yellow color. The triangle can be rotated according to the position of the robot. Important to be noted is that the rotation system in the SVG coordinate is different with the common Cartesian coordinate. The common Cartesian coordinate, positive angle rotate counterclockwise, otherwise the SVG coordinate use clockwise rotation for positive angle. For the robot position in Adraw(xdraw,ydraw) and the orientation of the robot as βn, the triangle can be plotted using the following code.
<polygon points="X-5,Y+7 X,Y-7 X+5,Y+7" fill="yellow" stroke="black" stroke-width="1" transform="rotate(-β X,Y)" />
<text x="X+25" y="Y+5" fill="black">Robot</text>
A path plotted to illustrate the robot movement. The path had triangle mark to show where the robot moves into. Every single vector data will be represented by each
vertex of the whole path. The path plotted with black 1pixel width line using the following code.
<path d="M X1 Y1 L X2 Y2 L X3 Y3 ... L Xn Yn" following point will use L prefix to state that the line will be drawn between the two points.
Testing
Using a data sample, a trial map can be generated to test the concept and equations of this research. The data input both angle and distance generated randomly and then processed. This research uses two sets of random data for testing purpose. The sets of data used displayed at table 1. The output script generated for data set 1 displayed below.
<polygon points="10,177 25,172 10,167 " fill="yellow" stroke="black" stroke-width="1" transform="rotate(132 10,172)" />
<text x="20" y="177" fill="black">Robot</text> <path d="M 125 28 L 225 38 L 290 84 L 276 149 L 223 142 L 153 161 L 137 131 L 93 91 L 59 91 L 59 118 L 10 172" marker-mid="url(#Triangle)" fill="none" stroke="black" />
The second data set also got the map generated by the system. The final output of the second dataset displayed below.
<polygon points="10,126 25,121 10,116 " fill="yellow" stroke="black" stroke-width="1" transform="rotate(175 10,121)" />
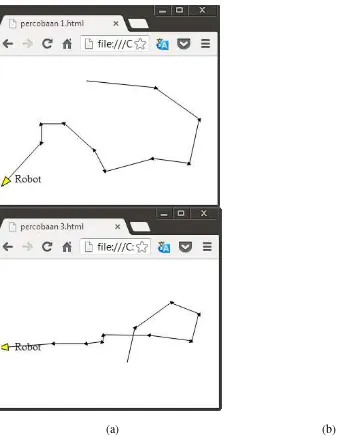
The script above displayed on the browser to view the map. Both map displayed using Google Chrome browser. The display captured and displayed in Fig. 7.
(a) (b)
Map generated from sample data set (a) data set 1, (b) data set 2
A comparison can be done between the map and the data set. A positive angle shown as turning right on the map and a positive angle shown as turning left on the map. The distance of movement displayed as the line length.
The above script also tested using several browsers to check the compatibility. Each browser access the first data set and captured in Fig. 8 below.
(a) (b) (c)
Map generation testing (a) Google Chrome, (b) Mozilla Firefox, (c) Internet Explorer
Fig. 8 shows the map accessed using Google chrome Mozilla Firefox and also Internet Explorer. The Google chrome browser and Mozilla Firefox fully support SVG tags and display the exact same map while the Internet Explorer only display the label of the robot and failed to draw the path and polygon. Several version of Internet Explorer isn't seems to support SVG tags.
CONCLUSION
Visualization of mobile robot can be generated using simple XML tags. Movement of robot can be considered as several numbers of vectors. Final position of a mobile robot can be calculated by adding all the vector of the entire movement. Several version of Internet Explorer is still having difficulties of displaying SVG image while Mozilla Firefox and Google Chrome had better support of SVG image.
ACKNOWLEDGMENT
Researcher would like to thank the W3 group for proposing such a simple yet powerful vector graphic tools capable to visualize every aspect of a vector.
REFERENCES
Alisa Favinger, Jim Lewis, "The Polar Coordinate System", M.A. thesis, University of Nebraska-Lincoln, Nebraska, 2008. Erik Dahlstrom, et al. "Scalable Vector Graphics 1.1 Second Edition"
W3C Recommendation, August 2011.
John Peacock, Foundation of Mathematical Physics, Topic: "Vector, Tensor and Field", University of Edinburgh, Edinburgh, 2009. Yang Cao, "Towards Virtual Watersheds: Integrated Data Mining,
Management, Mapping and Modeling", AWRA Spring Specialty Conference, Orlando FL, March 2010.