Phenolic and phenolic-related factors as
determinants of suitability of mountain birch
leaves to an herbivorous insect
Vladimir Ossipov
a,b,*, Erkki Haukioja
a, Svetlana Ossipova
a,b,
Sinikka Hanhima¨ki
a, Kalevi Pihlaja
baSection of Ecology, Department of Biology, University of Turku, FIN – 20014 Turku, Finland b
Laboratory of Physical Chemistry, Department of Chemistry, University of Turku, FIN - 20014, Turku, Finland
Received 19 July 1999; accepted 17 May 2000
Abstract
We investigated the role of phenolic and phenolic-related traits of the leaves of mountain birch (Betula pubescensssp.czerepanovii) as determinants of their suitability for the growth of larvae of the geometridEpirrita autumnata. As parameters of leaf suitability, we determined the contents of total phenolics, gallotannins, soluble and cell-wall-bound proanthocyanidins (PAS and PAB, respectively), lignin, protein precipitation capacity of tannins (PPC), and leaf toughness. In addition, we examined concentrations of soluble carbohydrates and protein-bound amino acids as background variables describing the nutritive value of leaves. The correlation of the leaf traits of our 40 study trees with the tree-specific relative growth rate (RGR) ofE. autumnatashowed that the only significant correlation with RGR was that of PAS} the largest fraction of total phenolics} and even that explained only 15% of the variation inE. autumnatagrowth. The nonlinear estimation of the relationship between RGR and PAS by piecewise linear regression divided the 40 study trees into two groups: (i) 19 trees with good leaves forE. autumnata(RGR ranging from 0.301 to 0.390), and (ii) 21 trees with poor leaves (RGR ranging from 0.196 to 0.296). The suitability of leaves within these two groups of trees was determined by different phenolic traits. Within the good group, the suitability of leaves for larvae was determined by the PPC of extracts, which strongly correlated with gallotannins, and by the total content of gallotannins. In contrast, the leaves of poor trees had significantly higher contents of both PAS and PAB, but leaf toughness correlated only negatively with the RGR ofE. autumnatalarvae. We also discuss the causes of
*Correspondence address: Department of Chemistry, University of Turku, FIN - 20014, Turku, Finland. Tel.: +358-2-333-6728; fax: +358-2-333-6700.
E-mail address:[email protected] (V. Ossipov).
variation in the phenolic and phenolic-related factors that determine the suitability of leaves forE. autumnatalarvae in different groups of trees. # 2001 Elsevier Science Ltd. All rights reserved.
Keywords: Betula pubescensssp.czerepanovii; Birch;Epirrita autumnata; Gallotannins; Lignin; Phenolics; Plant–insect relationships; Proanthocyanidins
1. Introduction
In higher plants the shikimate pathway produces various phenolic compounds, such as hydroxybenzoic and hydroxycinnamic acids, flavonoids, coumarins, lignins and hydrolysable and condensed tannins (proanthocyanidins). In woody plants, these metabolites represent the major route of carbon channelling and account for approximately 30–40% of the plant dry mass. Phenolics have wide ranging functions, including structural support, pigmentation, signalling and defence against environmental and biotic stresses (Dixon and Paiva, 1995; Douglas, 1996). They have traditionally been considered to play an important role in plant–herbivore interactions (Feeny, 1976; Rhoades and Cates, 1976; Herms and Mattson, 1992; Bryant et al., 1993; Haukioja et al., 1998).
The phenolics of mountain birch leaves (Betula pubescensssp. czerepanovii) have been assumed to contribute to the plant’s resistance against herbivorous insects, for three reasons: (i) the leaves generally have very high levels of phenolics, often exceeding 10% of the dry mass; (ii) foliar tannins are effective in protein precipitation and are therefore presumably well suited for defensive functions; and (iii) after leaf damage, concentrations of leaf phenolics increase considerably and remain high during the year following defoliation (Tuomi et al., 1984; Haukioja et al., 1985a; Neuvonen et al., 1987; Nurmi et al., 1996; Ossipov et al., 1997; Kaitaniemi et al., 1998). However, in attempts to associate insect performance with leaf chemistry, we have found only weak correlations, and different experiments have yielded partly contradictory results (Haukioja et al., 1985b; Tuomi et al., 1988; Neuvonen and Haukioja, 1991; Suomela et al., 1995; Ruohoma¨ki et al., 1996; Kaitaniemi et al., 1998). We think that this discrepancy can be explained by high among-tree variation in the composition and content of some phenolics; in addition, the suitability of leaves for insects in different trees and at different developmental phases of leaves may be determined by different compounds (Kause et al., 1999).
now in a position to study the role of phenolics and phenolic-related leaf traits in more detail.
We realize that the content of phenolics, or of any plant secondary metabolites, do not alone determine leaf quality for herbivores; after all, herbivores require nutritive compounds from their diet. Accordingly, we measured the contents of protein-bound amino acids and soluble carbohydrates in the birch leaves to provide background information to suitability (Tenow, 1972; Haukioja et al., 1988).
Earlier work has demonstrated that the performance ofEpirrita autumnatalarvae
on trees with high and low concentrations of gallotannins depends on different phenolics, gallotannins and proanthocyanidins (Kause et al., 1999). It was also found that difference between trees with low and high concentration of gallotannins could be explained at least in part by phenological differences among the trees. To further elucidate the multiplicity of chemical factors determining birch leaf suitability forE. autumnatalarvae, we replicated the experiment in a different year. We used a larger number of trees, with higher among-tree variation in leaf suitability, and determined a more extensive array of phenolic and phenolic-related leaf traits, including leaf toughness and lignin content.In the present work, we found
that the suitability of birch leaves for E. autumnata larvae is the result of the
combined action of at least three phenolic factors}gallotannin and
proanthocya-nidin concentrations and leaf toughness} and that the relative intensity of these
factors varies among trees.
2. Materials and methods
2.1. Study site and organisms
Our study area is located near the Kevo Subarctic Research Station of Turku University, in northern Finland (698450N, 278010E), at an altitude of 150 m above sea level. The area is covered by a forest consisting almost purely of mountain birch (Betula pubescensssp.czerepanovii(=tortuosa) (Orlova) Ha¨met-Ahti). Forty mature mountain birch trees were randomly chosen from a single homogeneous forest plot. The growth type of mountain birch is indeterminate, with two kinds of shoots, short shoots and long shoots (Ruohoma¨ki et al., 1997). Short shoot leaves (usually three leaves per shoot) burst simultaneously in spring, and are therefore evenly aged within a tree. This is in contrast to long shoot leaves, which are produced continuously at growing branch tips until late summer, and which therefore vary in age even within a shoot. To control for leaf age within an individual tree, we used only short shoot leaves in our analysis. To evaluate among-tree variation in the time of leaf burst and consequently in leaf age, the length of the leaves was recorded on 7 June at the time of bud break.
The autumnal moth, Epirrita autumnata (Bkh.), is a univoltine polyphagous
time of birch budbreak (Tammaru et al., 1995). The larvae feed on short shoots for most of their larval period since there simply are no long shoots available.
E. autumnatapopulation densities fluctuate cyclically at about 10-yr intervals; they may reach outbreak levels and defoliate vast areas of birch forests (Tenow, 1972; Haukioja et al., 1988).
2.2. Plant sample preparation
A total of 15–25 leaves from short shoots only, i.e. even-aged leaves, were sampled throughout the canopy of the experimental trees on 28 June, between 9 and 10:30 a.m. Unlike the previous experiment (Kause et al., 1999), the leaves of our experimental trees had completed active growth at the time of sampling. The samples were immediately placed in an insulated box filled with ice and transported to the nearby laboratory. The plant material was vacuum dried. The leaf samples of individual trees were then homogenized into a powder and stored in plastic vials at
ÿ208C.
About 200 mg of the powder was suspended in 10 ml of 70% aqueous acetone, allowed to stand for 1 h at room temperature with continuous stirring and
centrifuged for 10 min at 2500g. The pellet was re-extracted twice. The acetone
extract was reduced to the aqueous phase by evaporation at room temperature, and the resulting aqueous phase was frozen and lyophilized. The lyophilized residue was redissolved in 9 ml of water and centrifuged for 20 min at 3000g. This purified extract was used for the determination of soluble phenolics, carbohydrates and protein precipitation capacity of tannins. The acetone-insoluble residue was collected, lyophilized and weighed, and was used for the determination of cell-wall-bound proanthocyanidins, lignin and protein-bound amino acids.
2.3. Biochemical determinations
2.3.1. Total content of soluble phenolics
A modification of the Folin-Ciocalteau method (Torres et al., 1987) was used to determine the total content of phenolic compounds. An 0.1 ml sample of the purified extract was placed in a 15 ml tube and mixed with 5.9 ml water. 1.0 ml of this diluted extract was mixed with 1.0 ml 1 N Folin-Ciocalteau’s phenol reagent (Fluka, BioChemika, Buchs) in a 10-ml centrifuge tube and allowed to stand for 2–5 min.
Then 2 ml of 20% Na2CO3was added. After 10 min incubation at room temperature,
the mixture was centrifuged for 8 min at 1500gand the absorbance was measured at
730 nm on a Perkin-Elmer Spectrophotometer 550. The standard curve was created with known concentrations of gallic acid.
2.3.2. Soluble proanthocyanidins (PAS)
mixture of 1-butanol/concentrated HCl (95:5, v/v) in a 10-ml screw-top glass centrifuge tube. The optimal concentration of water in the reaction mixture was 10–11% (v/v). After mixing, the tubes were placed in a constant-level water bath
for 50 min at 958C. The tubes were then cooled to room temperature and absorbance
at 555 nm was measured. The standard curve was prepared with known concentrations of proanthocyanidins, which were isolated from mature birch leaves and purified by preparative chromatography on Sephadex LH-20 (Ossipova et al., in press).
2.3.3. Cell-wall-bound proanthocyanidins (PAB)
PAB were analyzed in the acetone-insoluble residue by the same method as PAS (Ossipova et al., in press). About 7 mg of the dry residue was suspended in a reaction mixture containing 6 ml of 1-butanol/concentrated HCl (95:5, v/v) and 0.7 ml of water. The sample was heated for 50 min at 958C, cooled and centrifuged for 10 min
at 2500g. The absorbance of the solution at 555 nm was then measured.
2.3.4. Total content of gallotannins
Quantitative analysis of gallic acid in the hydrolysate of extracts was used for the determination of total gallotannins (a modification of the method by Inoue and Hagerman, 1988). One ml of extract was placed in a 2-ml Teflon-lined screw-cap
glass tube, freeze-dried and dissolved in 1 ml 1 M H2SO4.The tube was capped and
hydrolysis was run for 4 h at 1008C. A 0.1 ml aliquot of the hydrolysate was then
diluted to 1 ml with distilled water. 0.2 ml of this sample was mixed with 0.3 ml of 0.667 % methanolic rhodanine solution. After exactly 5 min, 0.2 ml of 0.5 M KOH solution was added. After 2.5 min, the mixture was diluted to 5 ml with distilled water. Five to 10 min later the absorbance at 520 nm was read. The rhodanine assay was standardized with gallic acid.
2.3.5. Lignin
Lignin was assayed by derivatization with thioglycolic acid (modified from the method of Lange et al., 1995). Approximately 15 mg of the acetone-insoluble residue was placed in a 1.5-ml Eppendorf screw-cap vial and treated consecutively with 1.5 ml of the following solvents and solutions, with mixing for 15 min followed by
centrifugation for 5 min at 7000g (Eppendorf centrifuge 5417C): (a) 1 M NaCl, (b)
1% (w/v) sodium dodecyl sulphate (SDS), (c) H2O (twice), (d) ethanol, (e) CHCl3/ CH3OH (1:1, v/v), and (f) acetone (twice). The remaining insoluble material was vacuum-dried overnight and treated with 1 ml of 2 M HCl and 0.2 ml of thioglycolic acid for 4 h at 958C. After cooling to room temperature, the mixture was centrifuged
for 10 min at 7000g. The supernatant was removed with a Pasteur pipette, and the
concentrated HCl and the LTGA was allowed to precipitate for 4 h at 48C. The mixture was centrifuged as above, the supernatant was removed with a Pasteur pipette, and the pellet was vacuum-dried. The pellet was dissolved in 1 ml of 0.5 M NaOH and diluted to 15 ml with 0.5 M NaOH. Absorption at 280 nm was measured, using an absorption value of 0.316/mg lignin (Lange et al., 1995) for the calculation of lignin content in cell wall preparations.
2.3.6. Protein precipitation capacity (PPC) of tannins
For determination of the PPC of tannins in birch leaf extracts, a radial diffusion method with agarose gel was used (Hagerman, 1987). In this assay, tannins diffuse through a protein-containing gel. A visible disk-shaped precipitate develops as the tannin interacts with the protein. The area of the disk is linearly related to the amount of tannins placed in the well. A 1 ml aliquot of the extract from birch leaves was freeze-dried and diluted in 0.2 ml of water. Two successive aliquots of 0.01 ml each were applied to the diffusion gel. After 96 h of incubation at 308C, the diameters of the rings were measured. The data were presented as the area of tannin–protein precipitate in cm2gÿ1of dry mass of birch leaves.
2.3.7. Leaf toughness
The toughness of 10 leaves per tree was measured with a penetrometer (Department of Chemistry, University of Turku, Finland), similar to that described by Feeny (1970), on leaf blades outside major veins. The results are expressed in g
mmÿ2necessary to puncture the blade.
2.3.8. Protein-bound amino acids
Approximately 20 mg of the acetone insoluble residue was hydrolyzed with 5 ml
6 N HCl for 24 h at 1058C. An 0.05 ml aliquot of the hydrolysate was placed in a
Microcentrifuge tube, dried for 2 h at 1058C and dissolved in 0.2 ml of 0.1 M borate buffer, pH 11.4. Protein-bound amino acids were derivatized with 9-fluorenylmethyl chlorformat (FMOC-Cl) and analyzed by HPLC (Bank et al., 1996). For
derivatization, 0.2 ml of FMOC reagent in acetone (1.5 mg mlÿ1) was added to
0.2 ml of amino acid solution, mixed immediately and then allowed to stand for 40 min at room temperature. An 0.05 ml aliquot of amino acid derivatives was added to the vials with 0.95 ml of 25% (v/v) acetonitrile in 0.05 M boric acid. An 0.02 ml aliquot of the diluted sample was injected into an HPLC system.
The HPLC system (La Chrom system, Merck-Hitachi) consists of a pump L-7000, a fluorescent detector L-7480, a programmable autosample L-7250, and an interface D-7000. Peak Master (Harley System) software, run under Microsoft Windows 3.11, was used for data acquisition and processing. The sample was injected into a
RP-HPLC column (1503.9 mm i.d., Pico-Tag1, Waters).
tetramethylammonium chloride and 0.01% (w/v) sodium azide. Solvent B was 80% (v/v) of 20 mM sodium acetate solution containing 5 mM tetramethylammonium chloride and 0.01% (w/v) sodium azide (adjusted to pH 4.5 with concentrated phosphoric acid) plus 20% (v/v) methanol. Solvent C was acetonitrile. For elution the next gradient was used: 0–15 min, 25–40 % C in A (linear gradient); 15–20 min, 40 % C in A (isocratic); 20.1–30 min, 36–38 % C in B (linear gradient); 30–45 min, 38–60 % C in B (linear gradient); 45–47 min, 40–80% C in B (linear gradient); 47–
55 min, 80% C in B (isocratic). The flow rate was maintained at 1 ml minÿ1
throughout the analysis with a column pressure of 70–113 bar. Fluorescence was monitored at 254 and 630 nm (excitation and emission wavelengths, respectively). Calibration curves were obtained using an amino acid standard solution AA-S-18 (Sigma).
2.3.9. Carbohydrates
The soluble carbohydrates of the birch leaves were analyzed by capillary gas– liquid chromatography (GLC) in the form of TMS-derivatives (Kallio et al., 1985). A 1.0 ml of purified extract and 0.1 ml of sorbitol solution (internal standard, 10 mg
mlÿ1) were placed in a 1.5 ml screw-cap vial and freeze-dried overnight. The dry
material was dissolved in 0.3 ml pyridine and 0.15 ml of a mixture of bis(trimethyl-silyl)trifluoracetamid (Merck) and chlortrimethylsilan (Aldrich) (99/1, v/v). The
reaction mixture was kept at 608C for 1 h and left to stand overnight at room
temperature. The sample was then filled to 1.0 ml with pyridine and used for GLC analysis. The TMS-derivatives of carbohydrates were analyzed with the Perkin-Elmer Autosystem GC with a flame ionization detector and Perkin-Perkin-Elmer integrator 1020, using a 30 m HP-1 capillary column (crosslinked methyl sylicone gum, 0.25 mm
i.d., film thickness 0.25mm, Hewlett-Packard, USA). The injector split ratio was
1:50 and the flow rate of the carrier gas, nitrogen, 40 ml minÿ1. The temperature of
the injector and detector was 2808C. The temperature of column was programmed as
follows: (1) 1508C, 1 min; (2) 150–2408C, 48C minÿ1; (3) 240–2908C, 208C minÿ1; (4) 2908C, 14 min. The injected volume was 1 ml.
2.4. Growth of E. autumnata larvae
The leaf quality of each of the 40 trees was bioassayed by measuring the growth
rates of newly molted 5th instarE. autumnata larvae for 24 h. Prior to the feeding
trial, all larvae had been treated identically. The trees used for feeding the larvae were from the same mountain birch population as the experimental trees. Five leaves from each tree were sampled for bioassay between 5:30 and 6:30 a.m. on June 27, i.e. one day before the sampling of leaves for the biochemical analyses. Five broods of
The growth trial was conducted at 128C, which corresponds to the average summer temperature in the area. As an index of leaf quality, we used the relative growth rate of the larvae: RGR¼ ðlnðmeÞ ÿlnðmbÞÞ=time, where mb and me are the calculated dry masses of a larva at the beginning and end of the growth trial, respectively. Dry
larval masses (DM) were calculated from fresh masses (FM) as DM=0.125*FM1.113
(Neuvonen and Haukioja, 1984).
2.5. Statistical analysis
All parameters of both birch leaves and herbivore growth were reduced to tree-specific means, and these means were used in statistical analyses (Statistica, StatSoft, 1994). The correlations both among leaf parameters and between these parameters
and the RGR ofE. autumnata were tested using multiple regression analysis. In a
preliminary analysis of the data, PAS was the only leaf trait that correlated significantly with RGR, and even that explained only 15% of growth variation. Multiple regression assumes a linear relationship between the dependent and the independent variable. Accordingly, we studied the nature of the relationship between the dependent variable RGR and the independent variable PAS and other phenolic traits by nonlinear regression models. We used Piecewise Linear Regression with a breakpoint (option from Nonlinear Regression, Statistica, StatSoft, 1993), which estimates two separate linear regression equations; one for RGR values that are less than or equal to the breakpoint and one for RGR values that are greater than the breakpoint. As a result, our 40 study trees were divided into two groups, with good
and poor leaf quality for E. autumnata. The correlations between leaf traits and
RGR ofE. autumnatawere then tested within these groups separately. Differences in
the values of leaf traits between the two groups were analyzed byt-tests.
3. Results
3.1. Growth of larvae
Table 1 summarizes the traits measured for both larvae and leaves. The RGR of
E. autumnataon the leaves of the 40 trees ranged from 0.196 to 0.390: the best tree supported larval growth twice as well as the worst one. The coefficient of variation of
E. autumnatagrowth rate on the leaves of our study birches was about three times as great as in the previous experiment with 5th instar larvae (Kause et al., 1999).
3.2. Phenolic and phenolic-related parameters of birch leaves
gallotannins was much lower and showed large variation among trees (Table 1). Another independent method for the determination of gallotannins, summing up individual gallotannins from the HPLC analysis, gave the same value (data not shown). Interestingly, the total content of soluble phenolics correlated positively with the content of gallotannins (r¼0:53;P50:001), but there was no correlation with PAS, the main group of soluble phenolics in birch leaves.
The protein precipitation capacity of leaf extracts (PPC) correlated strongly with the concentrations of total gallotannins (r¼0:73;P50:001). This also explains the relatively high variation in PPC among trees (Table 1). In spite of the very high concentrations of PAS in the leaf extracts, their correlations with PPC were not significant in this study, and were in accordance with our other experiments with mountain birch (Ossipov et al., 1997; Kaitaniemi et al., 1998; Kause et al., 1999). This is consistent with our findings demonstrating that the specific PPC of isolated and purified PAS from birch leaves was much lower than that of gallotannins (Ossipova et al., in press).
Leaf toughness is an important trait contributing to plant resistance against insects (Feeny, 1970; Coley, 1983; Coley and Barone, 1996). Toughness results from the composition of cell walls and especially from the presence of different phenolic compounds in the walls (Haslam, 1988). In woody plants, the most important cell-wall-bound phenolic is lignin. Contrary to our expectation, the average lignin content was very low (Table 1), and did not correlate with leaf toughness (r¼ ÿ0:04;P¼0:82). There was also no significant correlation between toughness and cell-wall-bound proanthocyanidins, although the content of PAB in the leaves was about six times higher than that of lignin (Table 1).
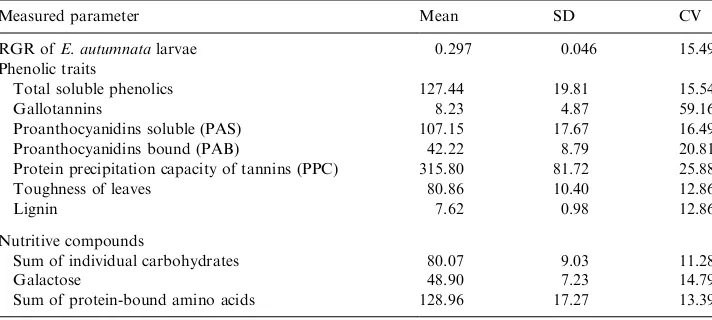
Table 1
Relative growth rate ofE. autumnatalarvae (RGR) on leaves of 40 birch trees and values of parametersa measured in these leaves
Measured parameter Mean SD CV
RGR ofE. autumnatalarvae 0.297 0.046 15.49
Phenolic traits
Total soluble phenolics 127.44 19.81 15.54
Gallotannins 8.23 4.87 59.16
Proanthocyanidins soluble (PAS) 107.15 17.67 16.49
Proanthocyanidins bound (PAB) 42.22 8.79 20.81
Protein precipitation capacity of tannins (PPC) 315.80 81.72 25.88
Toughness of leaves 80.86 10.40 12.86
Lignin 7.62 0.98 12.86
Nutritive compounds
Sum of individual carbohydrates 80.07 9.03 11.28
Galactose 48.90 7.23 14.79
Sum of protein-bound amino acids 128.96 17.27 13.39
3.3. Nutritive compounds of birch leaves
HPLC analysis of protein hydrolysates indicated 17 individual amino acids; the main components were leucine and glutamic and aspartic acids (data not shown). The total protein content, as the sum of protein-bound amino acids, was about 130 mg gÿ1of dry mass, with relatively low variability among trees (Table 1). The proportion of free amino acids made up 0.5–0.9% of protein-bound amino acids; the main compounds were histidine, glutamine, alanine, phenylalanine, proline, serine, lysine and two unidentified amino acids (data not shown).
The soluble carbohydrates present in the birch leaves were glucose, fructose, sucrose, inositol and galactose. The main compounds were galactose and sucrose. For the characterization of this group of nutritive compounds only two parameters were used: the content of galactose and the sum of the biochemically related
carbohydrates}glucose, fructose and sucrose (Table 1).
3.4. Phenolics as determinants of birch leaf quality for E. autumnata
In the pooled data, PAS was the only leaf trait which correlated significantly with
the RGR of E. autumnata larvae (Table 2). Since Feeny (1969, 1970), a negative
correlation between PAS and RGR has been found in numerous studies concerning condensed tannins. In our experiment, however, PAS was not a strong determinant
of the suitability of leaves for E. autumnata larvae, explaining just 15% of the
variance in RGR (Table 2).
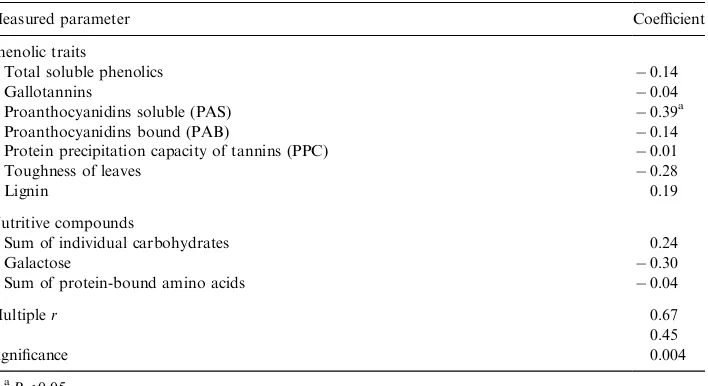
Table 2
Correlation coefficients and multiple regression coefficients between RGR ofE. autumnataon leaves of 40 birch trees and parameters measured in these leaves
Measured parameter Coefficient
Phenolic traits
Total soluble phenolics ÿ0.14
Gallotannins ÿ0.04
Proanthocyanidins soluble (PAS) ÿ0.39a
Proanthocyanidins bound (PAB) ÿ0.14
Protein precipitation capacity of tannins (PPC) ÿ0.01
Toughness of leaves ÿ0.28
Lignin 0.19
Nutritive compounds
Sum of individual carbohydrates 0.24
Galactose ÿ0.30
Sum of protein-bound amino acids ÿ0.04
Multipler 0.67
r2 0.45
Significance 0.004
a
3.5. Chemistry of trees with good and poor leaves for E. autumnata growth
The low correlation between the phenolic traits of birch leaves and their suitability for E. autumnata larvae could be due to the nonlinear relationship between these variables (Kause et al., 1999). The nonlinear estimation of the relationship between the dependent variable RGR and the independent variable PAS divided our 40 study trees at the breakpoint RGR=0.297 into two groups, with good (21 trees,
RGR>0.297) and poor (19 trees, RGR50.297) leaf quality forE. autumnata. The
use of other independent variables (total gallotannins, PAB, PPC and toughness) gave the same breakpoint, RGR=0.297. Unlike the findings of Kause et al. (1999),
the difference between the two groups of trees in the suitability of leaves for E.
autumnata did not result significantly from differences in leaf flush phenology (t¼0:18;P¼0:43).
The only leaf chemical traits that differed significantly between trees that
were good or poor for E. autumnata larvae were PAS and PAB (Table 3).
It is worth mentioning that neither the contents of individual phenolics
(gallotannins, chlorogenic and p-coumaroylquinic acids, quercetin-, myricetin-,
and kaempferol-glycosides) nor individual nutritive compounds (carbohydrates and protein-bound amino acids) differed significantly between the two groups of trees (data not shown).
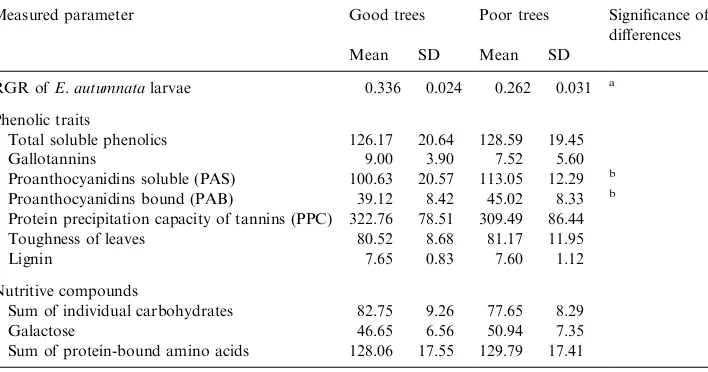
Table 3
RGR ofE. autumnatalarvae on leaves of two groups of birch trees separated by nonlinear estimation of RGR dependence on concentration of PAS and values of parameters measured in these leaves. For more information see Table 1
Measured parameter Good trees Poor trees Significance of differences
Mean SD Mean SD
RGR ofE. autumnatalarvae 0.336 0.024 0.262 0.031 a Phenolic traits
Total soluble phenolics 126.17 20.64 128.59 19.45
Gallotannins 9.00 3.90 7.52 5.60
Proanthocyanidins soluble (PAS) 100.63 20.57 113.05 12.29 b Proanthocyanidins bound (PAB) 39.12 8.42 45.02 8.33 b Protein precipitation capacity of tannins (PPC) 322.76 78.51 309.49 86.44 Toughness of leaves 80.52 8.68 81.17 11.95
Lignin 7.65 0.83 7.60 1.12
Nutritive compounds
Sum of individual carbohydrates 82.75 9.26 77.65 8.29
Galactose 46.65 6.56 50.94 7.35
Sum of protein-bound amino acids 128.06 17.55 129.79 17.41
a
P50.001. b
3.6. Leaf traits and growth of E. autumnata on good and poor trees
In the group of good trees, suitability of leaves forE. autumnatalarvae correlated negatively with the PPC of the extract (r¼ ÿ0:60;P50:05) and total content of gallotannins (r¼ ÿ0:48;P50:05) (Table 4). Multiple regression analysis showed that the traits used explained about 48% of the variation in RGR, and that the contribution of PPC alone was about 36%. In addition, about 55% of the variation in PPC was explained by total gallotannins, and only 15% by PAS.
In the group of poor trees, suitability of leaves forE. autumnatalarvae correlated negatively with leaf toughness only (r¼ ÿ0:67;P50:05) (Table 4). Multiple regression analysis indicated that all the leaf traits combined explained about 81% of the variation in RGR. The contribution of toughness alone was 45%. Although poor trees had significantly higher concentrations of PAS and PAB than good trees,
these traits did not correlate significantly with the growth ofE. autumnata larvae
(Tables 3 and 4).
4. Discussion
Four phenolic and phenolic-related leaf traits correlated negatively with larval growth, but in the pooled data only the concentration of PAS was a significant, Table 4
Correlation coefficients and multiple regression coefficients between RGR ofE. autumnataon leaves of two groups of trees and parameters measured in these leaves. For more information see Table 1
Measured parameter Good trees Poor trees
Phenolic traits
Total soluble phenolics ÿ0.20 ÿ0.13
Gallotannins ÿ0.48a ÿ0.18
Proanthocyanidins soluble (PAS) ÿ0.30 ÿ0.09
Proanthocyanidins bound (PAB) 0.09 0.35
Protein precipitation capacity of tannins (PPC) ÿ0.60b ÿ0.09
Toughness of leaves 0.05 ÿ0.67c
Lignin 0.30 0.29
Nutritive compounds
Sum of individual carbohydrates ÿ0.40 0.34
Galactose 0.21 ÿ0.30
Sum of protein-bound amino acids 0.32 ÿ0.15
Multipler 0.69 0.90
r2 0.48 0.81
Significance 0.005 0.0001
a
P50.05. b
P50.01. c
although not a strong, predictor of larval growth. Within the groups of good and
poor trees for E. autumnata growth, on the other hand, concentration of
gallotannins, PPC and toughness} but not PAS or PAB} displayed significant
correlations with growth ofE. autumnata larvae.
Previously, a negative correlation between total gallotannins and the performance ofE. autumnatalarvae was found within the group of trees with a high concentration of gallotannins in the leaves (Kause et al., 1999). In the present experiment, the
suitability of the leaves of good trees for E. autumnata correlated negatively
with total gallotannins and PPC, in spite of the relatively low concentration of
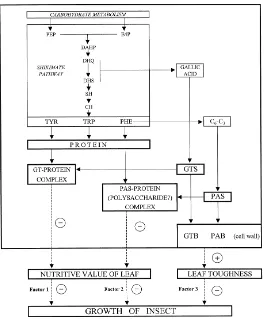
gallotannins and the high concentration of proanthocyanidins. The significant effect of gallotannins could operate via their high specific PPC compared with that of proanthocyanidins (Ossipova et al., in press). Thus gallotannins may play an important role in defending leaves from herbivores, probably by inhibiting the herbivore’s digestive enzymes and by forming strong molecular complexes with ingested proteins (Fig. 1, factor 1). However, high concentrations of gallotannins do not necessarily lead to lower consumption of leaves. In some cases, the larvae compensated for the effect of this factor on growth by consuming more (Kause et al., 1999).
Unlike phenylpropanoids, the biosynthesis of gallotannins in higher plants
probably does not proceed via L-phenylalanine, one of the end products of the
shikimate pathway. It is assumed that they are formed from dehydroshikimic acid, which is an intermediate compound of the shikimate pathway (Ishikura et al., 1984; Gross, 1992). Evidence for the functioning of this pathway in mountain birch leaves has been obtained recently (Ossipov et al., unpublished observations). The process of gallotannin synthesis is less energy-costly than the formation of phenylpropanoids (condensed tannins, lignin), and does not compete directly with protein synthesis for phenylalanine. These are presumably the two main reasons why active gallotannin synthesis and accumulation can coincide with the most active growth and development of birch leaves (Haukioja et al., 1998). They may also explain why gallotannins do not respond to environmental treatments in the ways the carbon nutrient balance hypothesis (Bryant et al., 1993) and the growth differentiation hypothesis (Lorio, 1986, Herms and Mattson, 1993) assume to be typical for phenylpropanoids (Koricheva et al., 1998).
The second phenolic factor, which reduces the suitability of birch leaves for
E. autumnata, is that of proanthocyanidins (Fig. 1, factor 2). Earlier we have shown that PAS are important for leaf suitability within the group of trees with a low concentration of gallotannins (Kause et al., 1999). In the present study, PAS and PAB were the only traits, which were significantly higher in the leaves of poor trees as compared to good ones. However, the correlations between PAS and RGR were low in the pooled data and not significant in the groups of good and poor trees. Proanthocyanidins are a class of natural phenolic compounds with large variation in chemical structure and molecular mass, and probably also in biological activity (Haslam, 1988,1995; Reed, 1995). A potential explanation for the low correlation
between proanthocyanidins and the leaf suitability for E. autumnata is that their
content has been determined as a pooled value.
wall of forming xylem cells is the main cause of their high durability (Sarkanen and Hergeret, 1971; Luck et al., 1994). However, the presence of this phenolic polymer in the primary cell walls of autotrophic tissues is not characteristic; in plant leaves, lignin is localized mainly in xylem vessels (Stafford, 1988). A low content of lignin and its unequal distribution in leaf tissues may explain why this phenolic polymer did not participate directly in the formation of birch leaf toughness.
Instead of lignin, other phenolic compounds, such as proanthocyanidins, flavonoid glycosides, and derivatives of hydroxybenzoic and hydroxycinnamic acids have been found in the cell walls of autotrophic tissues (Shen et al., 1986; Stafford, 1988; Strack et al., 1989; Keller et al., 1996). Birch leaves contain relatively large amount of PAB, but there was no correlation between PAB and leaf toughness.
Earlier work has demonstrated that gallotannin concentrations decrease rapidly during leaf maturation, and we have suggested that this may be due to the transformation of soluble gallotannins into insoluble cell-wall-bound constituents (Ossipov et al., 1997). From a physiological point of view, this process may be directly related to the formation of cell walls. It is even possible that the function of the high PPC of gallotannins may be primarily for the contacting and binding of gallotannins with the proteins and polysaccharides of the cell wall, and only secondarily as a defensive mechanism against insects (Haslam, 1988, 1995). We therefore suggest that the increasing toughness of birch leaves in the process of maturation may be due to the accumulation of gallotannins or ellagitannins, the products of gallotannin transformation, in the cell walls (Salminen et al., unpublished observations).
Summing up, the suitability of birch leaves for the main birch defoliator,
the larvae of E. autumnata, depends on the combined action of three phenolic
and phenolic-related factors: gallotannins, proanthocyanidins and toughness (Fig. 1). The relative role and intensity of these factors, however, may differ in different trees, depending on the age and developmental stage of the leaves and on environmental factors. In the group of good trees, for instance, the
suitability of leaves for E. autumnata larvae was affected by all three phenolic
factors, but the concentration of gallotannins and their high ability to reduce the digestibility of nutritive compounds may have been decisive. In the group of poor trees, gallotannin concentrations and leaf toughness were the same as in the good trees; the main chemical barrier limiting larval growth was presumably formed by the more active accumulation of both PAS and PAB. We assume that the leaves of good trees are incapable of maintaining the synthesis of defensive proanthocyanidins at the level that is characteristic for trees resistant against insects.
Acknowledgements
References
Bank, R., Jansen, E., Beekman, B., te Koppele, J., 1996. Amino acid analysis by reverse-phase high-performance liquid chromatography: improved derivatization and detection conditions with 9-fluorenylmethyl chloroformate. Anal. Biochem. 240, 167–176.
Bryant, J.P., Reichardt, P.B., Clausen T, .P., Werner, R.A., 1993. Effects of mineral nutrition on delayed inducible resistance in Alaska paper birch. Ecology 74, 2072–2084.
Coley, P.D., 1983. Herbivory and defensive characteristic of tree species in a lowland tropical forest. Ecol. Monographs 53, 209–229.
Coley, P.D., Barone, J.A., 1996. Herbivore and plant defenses in tropical forests. Annu. Rev. Ecol. Syst. 27, 305–335.
Dixon, R.A., Paiva, N.L., 1995. Stress-induced phenylpropanoid metabolism. Plant Cell 7, 1085–1097. Douglas, C.J., 1996. Phenylpropanoid metabolism and lignin biosynthesis: from weed to trees. Trends
Plant Sci. 1, 171–178.
Feeny, P., 1969. Inhibitory effect of oak leaf tannins on the hydrolysis of protein by trypsin. Phytochemistry. 8, 2119–2126.
Feeny, P., 1970. Seasonal changes in oak leaf tannins and nutrients as a cause of spring feeding by winter moth caterpillars. Ecology 51, 565–581.
Feeny, P., 1976. Plant apparency and chemical defence. In: Wallace, J.W., Mansel, R.L. (Eds.), Recent Advances in Phytochemistry, Vol. 10. Biochemical Interactions Between Plants and Insects, Plenum Press, New York, pp. 1–40.
Gross, G., 1992. Enzymatic synthesis of gallotannins and related compounds. In: Stafford, H., Ibrahim, R. (Eds.), Recent Advances in Phytochemistry, Vol. 26. Phenolic Metabolism in Plants, Plenum Press, New York, pp. 297–324.
Hagerman, A.E., 1987. Radial diffusion method for determining tannin in plant extracts. J. Chem. Ecol. 13, 437–449.
Haslam, E., 1988. Plant polyphenols (syn. vegetable tannins) and chemical defence}a reappraisal. J.
Chem. Ecol. 14, 1789–1805.
Haslam, E., 1995. Natural polyphenols: complexation with peptides and proteins as a mechanism of action in medicine. In: Autus, S., Ga´bor, M., Vetschera, K. (Eds.), Flavonoids and Bioflavonoids. Akade´miai Kiado´, Budapest, pp. 13–33.
Haukioja, E., Niemela¨, P., Sire´n, S., 1985a. Foliage phenols and nitrogen in relation to growth, insect damage, and ability to recover after defoliation, in the mountain birchBetula pubescensssp.tortuosa. Oecologia 65, 214–222.
Haukioja, E., Suomela, J., Neuvonen, S., 1985b. Long-term inducible resistance in birch foliage: triggering cues and efficacy on a defoliator. Oecologia 65, 363–369.
Haukioja, E., Neuvonen, S., Hanhima¨ki, S., Niemela¨, P., 1988. The autumnal moth in Fennoscandia. In: Berryman, A.A. (Ed.), Dynamics of Forest Insect Populations. Patterns, Causes, and Implications. Plenum Press, New York, pp. 164–178.
Haukioja, E., Ossipov, V., Koricheva, J., Honkanen, T., Larsson, S., Lempa, K., 1998. Biosynthetic origin of carbon-based secondary compounds: cause of variable responses of woody plants to fertilization? Chemoecology 8, 133–139.
Herms, D.A., Mattson, W.J., 1992. The dilemma of plants: to grow or defend. Quart. Rev. Biol. 67, 283–335.
Inoue, K., Hagerman, A., 1988. Determination of gallotannin with rhodanine. Anal. Biochem. 169, 363–369.
Ishikura, N., Hayashida, S., Tazaki, K., 1984. Biosynthesis of gallic and ellagic acids with14C–labeled compounds inAcerandRhusleaves. Bot. Mag. (Tokyo) 97, 355–367.
Kaitaniemi, P., Ruohoma¨ki, K., Ossipov, V., Pihlaja, K., Haukioja, E., 1998. Delayed induced changes in the biochemical composition of host plant leaves during an insect outbreak. Oecologia 116, 182–190.
Kause, A., Ossipov, V., Haukioja, E., Lempa, K., Hanhima¨ki, S., Ossipova, S., 1999. Multiplicity of biochemical factors determining quality of growing birch leaves. Oecologia 120, 102–112.
Keller, H., Hohlfeld, H., Wray, V., Hahlbrock, K., Scheel, D., Strack, D., 1996. Changes in the accumulation of soluble and cell wall-bound phenolics in elicitor-treated cell suspension cultures and fungus-infected leaves ofSolanum tuberosu. Phytochemistry 42, 389–396.
Koricheva, J., Larsson, S., Haukioja, E., Keina¨nen, M., 1998. Regulation of woody plant secondary metabolism by resource availability: hypothesis testing by means of meta-analysis. Oikos 83, 212–226. Lange, M.B., Lapierre, C., Sandermann Jr., H., 1995. Elicitor-induced spruce stress lignin. Structural
similarity to early developmental lignins. Plant Physiol. 108, 1277–1287.
Lorio, O.L., 1986. Growth-differentiation balance: a basis for understanding southern pine beetle-tree interactions. For. Ecol. Manage. 14, 259–273.
Luck, G., Liao, H., Murray, N., Grimmer, H., Warminski, E., Williamson, M., Lilley, T., Haslam, E., 1994. Polyphenols, astringency and proline-rich proteins. Phytochemistry 37, 357–371.
Neuvonen, S., Haukioja, E., 1984. Low nutritive quality as defence against herbivores: Induced responses in birch. Oecologia 63, 71–74.
Neuvonen, S., Haukioja, E., Molarius, A., 1987. Delayed inducible resistance against a leaf-chewing insect in four deciduous tree species. Oecologia 74, 363–369.
Neuvonen, S., Haukioja, E., 1991. The effects of inducible resistance in host foliage on birch-feeding insects. In: Tallamy, D.W., Raupp, M. (Eds.), Phytochemical Induction by Herbivores. Wiley, New York, pp. 277–291.
Nurmi, K., Ossipov, V., Haukioja, E., Pihlaja, K., 1996. Variation of total phenolic content and low-molecular-weight phenolics in foliage of the mountain birch trees (Betula pubescensssp.tortuosa). J. Chem. Ecol. 22, 2033–2050.
Ossipov, V., Nurmi, K., Loponen, J., Prokopiev, N., Haukioja, E., Pihlaja, K., 1995. HPLC isolation and identification of flavonoids from white birchBetula pubescensleaves. Biochem. Syst. Ecol. 23, 213–222. Ossipov, V., Nurmi, K., Loponen, J., Haukioja, E., Pihlaja, K., 1996. HPLC separation and identification of phenolic compounds from leaves ofBetula pubescensandBetula pendula. J. Chromatogr. A 721, 59–68. Ossipov, V., Loponen, J., Ossipova, S., Haukioja, E., Pihlaja, K., 1997. Gallotannins of birchBetula
pubescensleaves: HPLC separation and quantification. Biochem. Syst. Ecol. 25, 493–504.
Ossipova, S., Ossipov, V., Haukioja, E., Loponen, J., Pihlaja, K. Proanthocyanidins of mountain birch leaves: quantification and properties. Phytochem Anal., in press.
Reed, J.D., 1995. Nutritional toxicology of tannins and related polyphenols in forage legumes. J. Anim. Sci. 73, 1516–1528.
Rhoades, D., Cates, R. (1976) Toward a general theory of plant antiherbivore chemistry. In: Wallace, J.W., Mansel, R.L. (Eds.), Recent Advances in Phytochemistry, Vol. 1. Biochemical Interactions Between Plants and Insects. Plenum Press, New York, pp. 168–213.
Ruohoma¨ki, K., Chapin III, F.S., Haukioja, E., Neuvonen, S., Suomela, J., 1996. Delayed inducible resistance in mountain birch in response to fertilization and shade. Ecology 74, 30–38.
Ruohoma¨ki, K., Haukioja, E., Repka, S., Lehtila¨, K., 1997. Leaf value: effects of damage to individual leaves on growth and reproduction of mountain birch shoots. Ecology 78, 2105–2117.
Sarkanen, K., Hergeret, H., 1971. Classification and distribution. In: Sarkanen, K., Ludwig, C. (Eds.), Lignins. Occurrence, Formation, Structure and Reactions. Wiley Interscience, New York, pp. 43–94. Statistica for Windows, 1994. Quick reference. StatSoft Inc., Tulsa, OK.
Shen, Z., Haslam, E., Falshow, C., Begley, M., 1986. Procyanidins and polyphenols ofLarix gmelinibark. Phytochemistry 26, 2629–2635.
Stafford, H., 1988. Proanthocyanidins and the lignin connection. Phytochemistry 27, 1–6.
Strack, D., Heilemann, J., Wray, V., Dirks, H., 1989. Structures and accumulation patterns of soluble and insoluble phenolics from Norway spruce needles. Phytochemistry 28, 2071–2078.
Suomela, J., Ossipov, V., Haukioja, E., 1995. Variation among and within mountain birch trees in foliage phenols, carbohydrates and amino acids, and in growth ofEpirrita autumnatalarvae. J. Chem. Ecol. 21, 1421–1446.
Tenow, O., 1972. The outbreaks ofOporinia autumnataBkh. andOperophtheraspp. (Lep Geometridae) in the Scandinavian mountain chain and northern Finland 1862–1968. Zool. Bidr. Uppsala 2 (Suppl.), 1–107. Terrill, T.H., Rowan, A.M., Douglas, G.B., Barry, T.N., 1992. Determination of extractable and bound
condensed tannin concentrations in forage plants, protein concentrate meals and cereal grains. J. Sci. Food Agric. 58, 321–329.
Torres, A.M., Mau-Lastovicka, T., Rezaaiyan, R., 1987. Total phenolics and high-performance liquid chromatography of phenolic acids of avocado. J. Agric. Food Chem. 35, 921–925.
Tuomi, J., Niemela¨, P., Haukioja, E., Sire´n, S., Neuvonen, S., 1984. Nutrient stress: An explanation for plant antiherbivore responses to defoliation. Oecologia 61, 208–210.