Improved common carotid elasticity and intima-media thickness
measurements from computer analysis of sequential ultrasound
frames
Robert H. Selzer
a,c, Wendy J. Mack
a,b, Paul L. Lee
c, Helen Kwong-Fu
c,
Howard N. Hodis
a,b,*
aDepartment of Medicine,Di6ision of Cardiology,Atherosclerosis Research Unit,Uni6ersity of Southern California School of Medicine,
2250Alcazar Street,CSC132,Los Angeles,CA90033,USA
bDepartment of Pre6enti6e Medicine,Uni6ersity of Southern California School of Medicine,1540Alcazar Street,CHP218,Los Angeles,
CA90033,USA
cJet Propulsion Laboratory,California Institute of Technology,4800Oak Gro
6e Dri6e,Pasadena,CA91109,USA Received 4 May 1999; received in revised form 25 February 2000; accepted 2 March 2000
Abstract
B-mode ultrasound has gained popularity as a non-invasive method for direct visualization of superficial vessels. With B-mode ultrasound, arterial stiffness can be directly measured since image acquisition of the arterial wall thickness and vessel diameter can be obtained simultaneously in a dynamic fashion throughout the cardiac cycle. Recently, a method was developed to measure carotid arterial diameter and intima-media thickness (IMT) from B-mode images that utilizes computerized edge tracking-multi-frame image processing that automatically measures arterial diameter and IMT in multiple sequential tracking-multi-frames spanning several cardiac cycles. To evaluate this method, replicate B-mode common carotid artery ultrasound examinations and blood pressure measurements were obtained in 24 subjects 1 – 2 weeks apart. Approximately 80 sequential frames spanning two cardiac cycles were analyzed from each ultrasound examination to obtain maximum arterial diameter (Dmax), minimum arterial diameter (Dmin),
and IMT using a computerized edge detection method. The intraclass correlations ofDmax,Dmin, and IMT were 0.97 – 0.99 and
the mean absolute difference for these measurements were 0.03 – 0.11 mm. The coefficient of variation forDmaxandDminwere 1.28
and 1.18%, respectively. The intraclass correlation for several standard arterial stiffness indices, Peterson’s elastic modulus, Young’s modulus, arterial distensibility, compliance, and the beta stiffness index ranged between 0.84 and 0.89. Additionally, it was determined that averaging IMT over five frames centered atDminreduced single frame IMT measurement variability by 27%
(P=0.005) compared with IMT measured from a single frame corresponding toDmin. Comparison of the phasic relationship of
DmaxandDminmeasured from the B-mode ultrasound image with the simultaneously recorded electrocardiogram (ECG) signal in
the 24 subjects, provided a more accurate method of frame selection for arterial diameter extrema independent of the ECG signal. The method of computerized edge detection-sequential multiframe image processing presented in this paper represents a technological advance for image analysis of B-mode ultrasound images of common carotid arterial dimensions that is highly reproducible and directly applicable to noninvasive imaging of atherosclerosis. © 2001 Elsevier Science Ireland Ltd. All rights reserved.
Keywords:Ultrasound; Carotid artery; Arterial stiffness; Intima-media thickness; Atherosclerosis; Biomedical technology
www.elsevier.com/locate/atherosclerosis
1. Introduction
Cardiovascular disease remains the leading cause of morbidity and mortality in industrialized nations. An
increase in arterial wall stiffness appears to be a com-mon pathological pathway for the many factors that lead to initiation and progression of the vascular changes associated with cardiovascular disease [1,2]. Functional disturbances of the vascular wall may occur early in the atherosclerotic process, even before the anatomical changes of intima-media thickening become
* Corresponding author. Tel.: +1-323-4421478; fax: + 1-323-4422685.
perceptible [3 – 5]. Therefore, the study of dynamic arte-rial wall properties of large arteries such as the carotid and femoral arteries is becoming more common. Since the mechanical and structural properties of the arterial wall may change before the occurrence of clinical symp-toms of cardiovascular disease, non-invasive measure-ment of arterial wall stiffness could become important in identifying individuals at risk for cardiovascular disease [6,7]. This could lead to earlier and possibly more effective strategies for the prevention of cardio-vascular disease. Therefore, improved and easily de-ployed methods for determining arterial luminal dimensions has important implications for the study of arterial wall stiffening in cardiovascular disease.
B-mode ultrasound has gained popularity as a non-invasive method for direct visualization of superficial vessels. With B-mode ultrasound, arterial stiffness can be directly measured since image acquisition of arterial wall thickness and vessel diameter can be obtained in a dynamic fashion throughout the cardiac cycle as the artery expands and contracts with each cardiac pulsa-tion and relaxapulsa-tion, respectively [8,9]. Whereas B-mode methods for image acquisition of the arterial wall and vessel diameter have been described in many reports, methods for making the actual measurements over the entire cardiac cycle to capture the dynamic nature of the vessel are sparse [10,11].
Previously, it was reported that computerized edge detection substantially reduced measurement variability of arterial wall intima-media thickness (IMT) [12]. Re-cently, methods were developed for the application of computerized edge detection to B-mode ultrasound im-ages to measure arterial wall stiffness. The purpose of this report is to: (1) describe a technological advance-ment in which computerized edge detection algorithms are used in a dynamic fashion over the entire cardiac cycle to make measurements of arterial wall thickness and vessel diameter with sequential multiframe technol-ogy; (2) determine the short-term variability of arterial derived measurements between ultrasound images ac-quired 1 – 2 weeks apart using sequential multiframe analysis methods; (3) compare single frame IMT versus multiframe IMT averaged measurements; and (4) deter-mine the phasic relationship of maximum and mini-mum carotid arterial diameter with the electrocardiogram (ECG) signal.
2. Methods
2.1. Study subjects
The present study was conducted in 24 healthy ran-domly selected subjects enrolled in the Vitamin E Atherosclerosis Prevention Study (VEAPS), an ongo-ing, randomized, double-blind, placebo-controlled
arte-rial imaging clinical tarte-rial designed to determine whether vitamin E supplementation reduces the progression of subclinical atherosclerosis. Recruitment criteria for VEAPS included men and women 40 years or older without symptoms of cardiovascular disease, an LDL-C]130 mg/dl, and agreement to abstain from antioxi-dant supplement use for the duration of the trial.
2.2. Study protocol
Prior to randomization into VEAPS, high resolution B-mode ultrasound examination of the right carotid artery was performed twice, 1 – 2 weeks apart, under standardized conditions on all subjects [12]. Pulse pres-sure (difference in systolic and diastolic blood prespres-sure) was obtained for each subject from right brachial artery blood pressure measurements after a minimum of 20 min in a supine position using an automated blood pressure measurement device (Dinamap Critikon 8100, Huntsville, AL). Blood pressure was measured 4 times at each examination and averaged.
2.3. Image acquisition
2.4. Computer image processing
For each ultrasound examination, matching longitu-dinal views of the common carotid artery were located and 80 successive frames, representing a minimum of two cardiac cycles, were digitized. When this work was carried out, the frame digitizer (Data Translation Model 2861, Marlboro, MA) could only digitize and store 16 sequential frames from each pass of the video tape. Thus, the personal computer was programmed to acquire 16 images per pass of the video tape from a Sanyo VCR Model GVR S950, commanded to play forward and backward as many times as needed to acquire approximately 80 sequential frames. With the current computer system, 80 or more frames can be acquired and stored on high speed computer disk in real-time from a single VCR pass.
The computer program PROSOUND1 [12] was used
to track the near and far wall media-adventitia echoes to determine arterial diameter over a 1-cm length of the common carotid artery and the far wall lumen-intima echo, tracked over the same segment, was used together with the far wall media-adventitia echo to determine IMT. The diameter and IMT for each frame were taken as the respective average of approximately 70 – 100 indi-vidual measurements of diameter and IMT acquired along the 1-cm segment.
When a single frame is analyzed by PROSOUND, the operator uses a mouse to identify a few points along each boundary. A smooth curve through these points serves as a guide to the edge detection process. The program then searches in the vicinity of this initial curve for the true boundary using an intensity gradient detection method described in Ref. [12]. Only the first frame of an 80 frame sequence is processed in this fashion. The second frame uses the true detected edge coordinates from the first frame as the approximate boundary for the edge detection process. This sequence is then repeated. Operator intervention is only needed when the artery moves a relatively large distance be-tween frames and causes the edge tracking to fail. This effect is most frequently seen during the systolic expan-sion of the artery. In these cases, the operator redirects the tracking program to the general vicinity of the changed boundaries. The time to digitize and store 80 frames (approximately two cardiac cycles) on the hard disk is 1.9 min. The time required to track 80 digitized frames is 8.2 min, plus time for intervention when needed. When operator intervention is needed, on aver-age, it is required for one or two frames per cardiac cycle.
Application of the computerized multiframe image processing method to all of the processable frames
generated a sequence of arterial diameter and IMT measurements over two cardiac cycles. A 5 point mov-ing average filter was applied to these sequences of measurements. The maximum and minimum arterial diameters and the IMT at the point of maximum diameter and minimum diameter were determined over each cardiac cycle. The arterial dimensions (IMT and diameter) were averaged over two successive cardiac cycles. The arterial diameter and IMT values were used together with the blood pressure measurements to cal-culate several standard arterial stiffness indices (elastic-ity measurements).
2.5. Elasticity measurements
Ep=PP/[(Dmax−Dmin)/Dmin)]=PP/DD
where, Ep=Peterson’s elastic modulus; PP (pulse
pres-sure)=systolic blood pressure (Ps)−diastolic blood
pressure (Pd); Dmax=maximum artery diameter; Dmin=minimum artery diameter; DD=(Dmax−Dmin)/ Dmin.
Using these definitions, the other indices were defined as follows: Compliance COMPL=(Dmax
2
−Dmin 2
)/PP
where, IMTDmin=intima-media thickness of the arterial far wall at the minimum arterial diameter.
2.6. IMT measurements
IMT measurements were obtained at the point of minimum (IMTDmin) and maximum (IMTDmax) arterial diameter to compare the difference in IMT during minimum and maximum arterial excursion, roughly equivalent to end-diastole and peak systole, respec-tively. Additionally, to determine whether frame aver-aging affects variability, difference in IMTDmin on successive cardiac cycles was compared, with and with-out five frame averaging.
2.7. Phasic relationship of carotid artery diameters with the electrocardiogram
To determine more precisely where Dmin and Dmax
occur relative to the standard ECG waves, the frames corresponding to Dmin and Dmax in each cardiac cycle
were noted along with the frames corresponding most closely to the beginning of the P- and R-waves and the
peak of the T-wave of the ECG signals recorded on the images. The following frame distances were calculated:
1. Beginning of P-wave to measured Dmin
2. Dmin to beginning of R-wave
3. Beginning of R-wave toDmax
4. Dmax to peak of T-wave
2.8. Statistical analyses
For each IMT, diameter, and arterial stiffness mea-sure, analysis of variance (ANOVA) procedures were used to compute the within-subject intraclass correla-tion and coefficient of variacorrela-tion (CV). Mean absolute difference (MAD) between the measures obtained at each visit was computed as another measure of repro-ducibility. A comparison of the variability in IMT measured over a single frame versus five frames was accomplished by computing the MAD for each measure from two consecutive cardiac cycles. The MAD was then tested for differences in the two methods by re-peated measures analysis of variance. The mean IMT values measured at maximum versus minimum arterial diameters were also statistically compared using re-peated measures analysis of variance.
3. Results
3.1. Sample characteristics
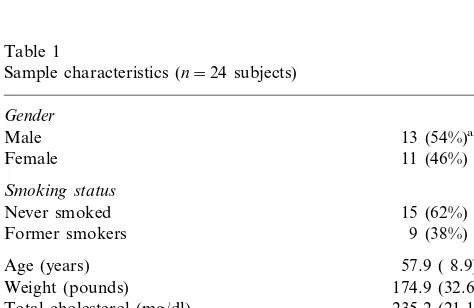
Characteristics of the 24 study participants are shown in Table 1. The average age of the cohort was 57.9 years and was comprised of 13 men and 11 women. Because of the recruitment criteria for VEAPS, all of the subjects were healthy without clinical symptoms or prior history of cardiovascular disease. All of the sub-jects were non-smokers at the time of study.
3.2. Multiframe image processing results
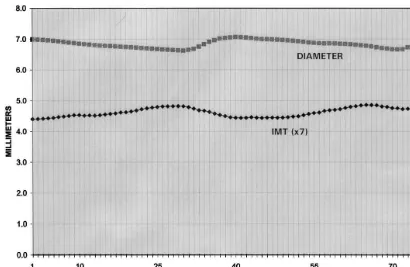
Application of the computerized edge detection-se-quential multiframe image processing method to all of the frames capable of being processed generated a continuous measurement of arterial diameter and IMT over two cardiac cycles. A typical plot of the carotid arterial diameter and IMT is shown in Fig. 1.
3.3. Replication study results
Mean values of carotid artery diameter and IMT for visits 1 and 2 are shown in Table 2. For the 24 subjects (48 examinations), Dmin, Dmax, IMTDmin, IMTDmax of two successive cardiac cycles were averaged. The intra-class correlations for the arterial diameter and IMT measurements between visit 1 and visit 2 for the 24 subjects ranged from 0.97 to 0.99. The MAD ranged from 0.03 to 0.11 mm and the CV from 1.18 to 4.03%. Blood pressure and pulse pressure had a greater mea-surement variability (CV=6.17 – 9.66%) than did the carotid arterial diameters (CV=1.18 – 1.28%) and IMT (CV=3.46 – 4.03%).
The arterial stiffness indices are shown in Table 3. The intraclass correlations for the arterial stiffness in-dices between visit 1 and visit 2 for the 24 subjects ranged from 0.84 to 0.89 and the CV from 11.05 to 14.54%.
3.4. Comparison of single 6ersus multiple frame IMT
measurements
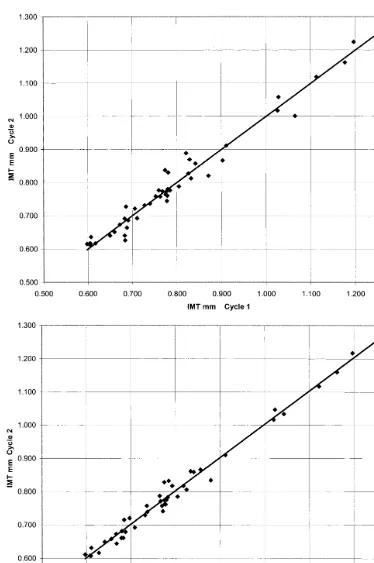
For each subject, IMT was measured from a single frame corresponding to minimum arterial diameter and as the average IMT of five frames centered at the minimum diameter (Fig. 2). For each method, the MAD was computed for the IMT values from two consecutive cardiac cycles at each of the visits 1 and 2 (48 measurements). The MAD for the single frame selection was 0.0201 mm compared to 0.0147 mm for the average of five IMT values centered at the frame of minimum diameter, a significant 27% reduction in the MAD (P=0.005).
3.5. IMT measurements at the point of minimum and
maximum arterial diameter
Determined from the 48 ultrasound examinations, IMT during maximum arterial excursion was on aver-age 5.3% (range 1.2 – 11.8%) less than IMT during minimum arterial excursion (IMT from 0.76690.179 to 0.80590.183 mm, P=0.0001), roughly equivalent to peak systole and end-diastole, respectively.
Table 1
Sample characteristics (n=24 subjects) Gender Total cholesterol (mg/dl)
LDL-cholesterol (mg/dl) 149.3 (18.2) HDL-cholesterol (mg/dl) 57.1 (14.0) 142.2 (54.6) Total triglycerides (mg/dl)
63.9 ( 6.9) Pulse rate (bpm)
Fig. 1. A typical plot from a subject of the continuous measurement of carotid arterial diameter and intima-media thickness (IMT) over 2 cardiac cycles with computerized edge detection-sequential multiframe image processing. IMT is scaled×7 for ease of comparison with arterial diameter.
Table 2
Carotid artery diameters and intima-media thickness (IMT) (n=24 subjects)
Visit 2 Ra MAD
Visit 1 CV (%)
Parameter
Maximum diameter (mm),Dmax 7.58 (0.76)b 7.55 (0.72) 0.98 0.11 1.28
Minimum diameter (mm),Dmin 7.17 (0.72) 7.15 (0.70) 0.99 0.09 1.18
0.768 (0.165) 0.97
0.775 (0.169) 0.03
IMT at maximum diameter (mm), IMTDmax 4.03
0.804 (0.177)
IMT at minimum diameter (mm), IMTDmin 0.800 (0.164) 0.97 0.03 3.46
129.2 (16.2)
Systolic blood pressure (mmHg) 128.7 (20.8) 0.82 9.19 6.17
73.2 (11.3) 0.77
72.7 ( 9.8) 5.89
Diastolic blood pressure (mmHg) 6.96
Pulse pressure (mmHg) 56.5 (11.1) 55.4 (14.6) 0.83 6.49 9.66
aIntraclass correlation. bMean (S.D.).
Table 3
Arterial stiffness indices (n=24 subjects)
Visit 1
Parameter Visit 2 Ra MAD CV
Peterson’s elastic modulus,Ep(kPa
b) 140.9 (56.1)c 142.2 (55.4) 0.86 20.2 14.54
10.99 (3.69) 0.84
10.91 (4.01) 1.68
Beta stiffness index,b 13.85
Young’s modulus,Ym(kPa) 629.8 (210.3) 636.4 (218.0) 0.84 86.4 13.09
1.64 (0.57) 0.89
1.65 (0.54) 0.21
Arterial distensibility, DIS (%/kPa) 11.05
0.842 (0.319) 0.89 0.116 12.49 Compliance, COMPL (mm2/kPa) 0.856 (0.310)
3.6. Relationship of Dmax and Dmin with the
electrocardiogram signal
The minimum carotid artery diameter occurs during the low-pressure end-diastolic cardiac phase and the
maximum carotid artery diameter during the peak sys-tolic phase. However, the exact frame correspondence of these events to the ECG signal has not been deter-mined. The following frame distances were observed in the 48 ultrasound examinations described in this study:
Fig. 2. (a) Plot of single frame intima-media thickness (IMT) measured at minimum diameter (Dmin) during cardiac cycle 1 vs. cardiac cycle 2.
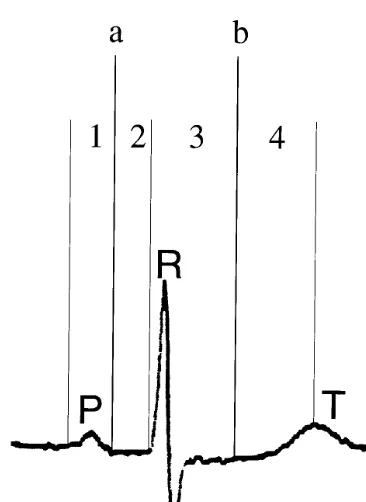
Fig. 3. Maximum (Dmax) and minimum (Dmin) a=Dmin; b=Dmax;
P=P-wave; R=R-wave, T=T-wave; carotid arterial diameters rela-tive to the electrocardiogram waves. 1=interval from beginning of the P-wave toDmin; 2=interval fromDminto beginning of R-wave;
3=interval from beginning of R-wave to Dmax; 4=interval from
Dmaxto peak of T-wave. See text for actual interval distances.
cycles has been limited by the ability to make multiple sequential frame measurements easily and rapidly and has mainly been done by frame-by-frame analysis [14]. Carotid arterial diameter and IMT dimensions mea-sured in B-mode ultrasonograms by computerized edge tracking-multiframe processing are highly reproducible (Table 2). The intraclass correlations between 2 visits for the commonly used arterial stiffness indices were also high (Table 3). The greater variability of the arterial stiffness indices relative to the arterial diameter and IMT measurements was mainly due to the greater variability of the pulse pressure relative to the arterial diameter between the two visits. The importance of the contribution of the pulse pressure variability to the variability of the arterial stiffness indices has been noted by other investigators who have reported pulse pressure variabilities ranging from 12 to 30% [15].
The short-term variability of repeated measurements has seldom been addressed for arterial stiffness indices derived from ultrasound measurements of arterial di-mensions in general, or from B-mode measurements in particular [16]. Using arterial diameter waveforms from sequences of images, Armentano et al. reported a CV of 3.9% for systolic and diastolic diameters of the carotid artery with repeated scanning in 14 subjects from the same clinic visit [17]. Because of its high resolution for continuous measurements, real-time electronic echo-tracking using radiofrequency ultrasound signals has been the most commonly employed method for measur-ing arterial diameter throughout the cardiac cycle [18]. The CV of the carotid artery diameter from repeated measurements in ten subjects over an interval of 4 days for this method has been reported to be 4.5% [19]. The CV of the carotid artery diameter from repeated mea-surements in 10 – 18 subjects within the same clinic visit for this method has been reported to be 3.1 – 4.0% [20,21]. Stadler et al. has shown that real-time echo-tracking and B-mode imaging have similar reproduci-bility for carotid artery diameter measurements [18]. The CV for systolic (Dmax) and diastolic (Dmin)
diame-ters of the carotid artery were found to be 1.28 and 1.18%, respectively over an interval of 1 – 2 weeks, indicating that computerized edge detection-sequential multiframe image processing of B-mode images results in highly reproducible carotid artery diameter measure-ments. Real-time echo-tracking using radiofrequency ultrasound signals requires an ultrasound imaging sys-tem with special equipment not readily available while computerized multiframe image processing is applied to images derived from standard clinical B-mode ultra-sound imaging systems without the need of special equipment for ultrasound image acquisition. The com-puterized system requires a PC computer with an image frame digitizer.
Determination of the prognostic significance of arte-rial wall stiffening as well as the effects of intervention on arterial stiffening in large-scale epidemiological stud-Average (range) number of video 2.08 (0–4)
frames from beginning of the P-wave to Dmin
2.27 (1–5) Average (range) number of video
frames from Dmin to beginning of
R-wave
Average (range) number of video 6.62 (4–10) frames from beginning of R-wave
to Dmax
Average (range) number of video 2.37 (–1–4) frames from Dmax to peak of
T-wave
As demonstrated in Fig. 3, Dmin on the average
occurred mid-way in the P – R interval, whereas Dmax
occurred on the average mid-way in the Q – T interval.
4. Discussion
ies and clinical trials have been hindered by the lack of simple and reliable methods of measurement. Previous studies have used several methods for measuring arte-rial wall stiffness requiring special equipment, tech-niques, training, or a combination of these factors which are often cumbersome. These methods have in-cluded applanation tonometry, intravascular ultra-sound, phase-locked echo tracking, magnetic resonance imaging, pulsed Doppler velocitometry, and multigated pulsed Doppler. Data from the Baltimore Longitudinal Study of Aging suggest that aortic pulse wave velocity is an important measure of age-associated changes in vascular stiffening [22]. Although arterial pulse wave velocity methodology is reproducible, easy to use, and non-invasive, it has several limitations. Pulse wave ve-locity is influenced by a variety of anatomical and physiological factors unrelated to vascular stiffening such as vessel lumen irregularities [10]. Additionally, the greater the distance from the heart, the greater the pulse wave velocity [10]. Therefore, the measurement site also contributes to the variation in pulse wave velocity. Recently, Nagai et al. have shown that pulse wave velocity is linearly related to common carotid arterial stiffness [23].
A simpler, readily available, and more easily de-ployed method to assess arterial wall stiffness is B-mode carotid artery ultrasonography. B-B-mode images can be used to determine arterial wall stiffening as well as carotid arterial wall thickness, which has been vali-dated as a measure of subclinical atherosclerosis [24]. A major advantage in measuring arterial wall stiffness from B-mode images is that the computerized edge tracking-multiframe processing method can be readily applied without extra views or changes in ultrasound parameters to existing studies or to the image analysis of previously acquired B-mode images, including those recorded on video tape without simultaneous ECG recording. There are many B-mode carotid artery ultra-sound epidemiological studies and clinical trials cur-rently underway or previously conducted from which data concerning arterial wall stiffening could be ob-tained with this technology at small additional cost.
In the evaluation of the computerized edge tracking-multiframe processing method, it was found that 5-frame averaging of IMT reduced the variability of the IMT measurement between sequential heart cycles by a significant 27% relative to a single frame IMT measure-ment. As expected IMT varied according to the arterial dimension. When the arterial diameter was at its mini-mum, IMT was at its thickest point and when the arterial diameter was at its maximum, IMT was at its thinnest point. In this study of 48 examinations (24 pairs), IMT significantly decreased on average 5.3% from the point of minimum arterial diameter (end-dias-tole) to maximum arterial diameter (peak sys(end-dias-tole). This observation with simultaneous B-mode imaging of
arte-rial diameter and IMT confirms previous reports of the reciprocal change in IMT and arterial diameter deter-mined with M-mode [25] and echo-tracking [26]. De-vereux et al. also reported a mean decrease of 5.3% in carotid IMT from end-diastole to peak systole [25]. Finally, it was observed that the frame containing the minimum arterial diameter was consistently located be-tween the P-wave and R-wave of the ECG whereas the maximum arterial diameter was located between the R-wave and T-wave.
These findings are important since in arterial imaging clinical trials, reproducibility of the end point deter-mines the smallest change that can be measured. Re-producibility influences the length of a trial and the number of subjects that must be studied in order to achieve a specified significance level and power to detect change. As such, several important steps can signifi-cantly reduce the variability of IMT measurements: (1) IMT measurements should be performed at the same point in the cardiac cycle since the extrema of IMT can be as great as 11.8%. IMT measurement would be preferable at end-diastole when IMT is the thickest; (2) the point of maximum and minimum IMT should be chosen based on arterial diameter rather than reliance upon the ECG since there is a phasic discordance between maximum and minimum arterial diameters and the ECG signals typically used to standardize IMT measurements; and (3) IMT measurements should be determined with frame averaging. In this study, 5-frame averaging significantly reduced short-term variability relative to single frame IMT measurements by 27%.
In conclusion, the method of computerized edge tracking-multiframe processing of B-mode ultrasound images represents a technological advance for determin-ing arterial lumen and wall dimensions with direct applicability to noninvasive imaging of atherosclerosis. This method is not only highly reproducible, but easily applicable to B-mode ultrasound images, including those images previously acquired even if they were acquired without simultaneous ECG recordings. This technology is readily deployed and requires no modifi-cation of existing ultrasound imaging equipment for arterial diameter and IMT measurements. Computer-ized edge tracking-multiframe processing of B-mode ultrasound images is a highly reproducible, readily available improved method for evaluating arterial di-ameter, IMT, and vessel wall properties.
Acknowledgements
References
[1] Ross R. The pathogenesis of atherosclerosis: a perspective for the 1990s. Nature 1993;362:801 – 9.
[2] Blankenhorn DH, Kramsch DM. Reversal of atherosis and sclerosis: the two components of atherosclerosis. Circulation 1989;79:1 – 7.
[3] Megnien JL, Simon A, Valensi P, Flaud P, Merli I, Levenson J. Comparative effects of diabetes mellitus and hypertension on physical properties of human large arteries. J Am Coll Cardiol 1992;20:1562 – 8.
[4] Alva F, Samaniego V, Gonzales V, Moguel R, Meaney E. Structural and dynamic changes in the elastic arteries due to arterial hypertension and hypercholesterolemia. Clin Cardiol 1993;16:614 – 8.
[5] Gronholdt MLM. Ultrasound and lipoproteins as predictors of lipid-rich, rupture-prone plaques in the carotid artery. Arte-rioscler Thromb Vasc Biol 1999;19:2 – 13.
[6] Hirai T, Sasayama S, Kawasaki T, Yagi S. Stiffness of system-atic arteries in patients with myocardial infarction: a noninvasive method to predict severity of coronary atherosclerosis. Circula-tion 1989;80:78 – 86.
[7] Riley WA, Freedman DS, Higgs NA, Barnes RW, Zinkgraf SA, Berenson GS. Decreased arterial elasticity associated with car-diovascular disease risk factors in the young. Arteriosclerosis 1986;6:378 – 86.
[8] Blankenhorn DH, Chin HP, Conover DJ, Nessim SA. Ultra-sound observation on pulsation in human carotid artery lesions. Ultrasound Med Biol 1988;14:583 – 7.
[9] Buntin CM, Silver FH. Noninvasive assessment of mechanical properties of peripheral arteries. Ann Biomed Eng 1990;18:549 – 66.
[10] Arnett DK, Evans GW, Riley WA. Arterial stiffness: a new cardiovascular risk factor? Am J Epidemiol 1994;140:669 – 82. [11] Sonka M, Zhang X, Siebes M, Bissing MS, DeJong SC, Collins
SM, McKay CR. Segmentation of intravascular ultrasound im-ages: a knowledge-based approach. IEEE Trans Med Imaging 1995;14:719 – 32.
[12] Selzer RH, Hodis HN, Kwong-Fu H, Mack WJ, Lee PL, Liu CR, Liu CH. Evaluation of computerized edge tracking for quantifying intima-media thickness of the common carotid artery from B-mode ultrasound images. Atherosclerosis 1994;111:1 – 11.
[13] Beach KW, Issac CA, Phillips DJ, Strandness DE. An ultrasonic measurement of superficial femoral artery wall thickness. Ultra-sound Med Biol 1989;15:723 – 8.
[14] Dart AM, Lacombe F, Yeoh JK, Cameron JD, Jennings GL, Laufer E, Esmore DS. Aortic distensibility in patients with isolated hypercholesterolaemia, coronary artery disease, or car-diac transplant. Lancet 1991;338:270 – 3.
[15] Riley WA, Barnes RW, Schey HM. An approach to the nonin-vasive periodic assessment of arterial elasticity in the young. Prev Med 1984;13:169 – 84.
[16] Arnett DK, Chambless LE, Kim H, Evans GW, Riley W. Variability in ultrasonic measurements of arterial stiffness in the Atherosclerosis Risk in Communities Study. Ultrasound Med Biol 1999;25:175 – 80.
[17] Armentano RL, Graf S, Barra JG, Velikovsky G, Baglivo H, Sanchez R, Simon A, Pichel RH, Levenson J. Carotid wall viscosity increase is related to intima-media thickening in hyper-tensive patients. Hypertension 1998;31:534 – 9.
[18] Stadler RW, Taylor JA, Lees RS. Comparison of B-mode, M-mode and echo-tracking methods for measurement of the arterial distension waveform. Ultrasound Med Biol 1997;23:879 – 87.
[19] Kool MJF, van Merode T, Reneman RS, Hoeks APG, Struyker Boudier HAJ, Van Bortel LMAB. Evaluation of reproducibility of a vessel wall movement detector system for assessment of large artery properties. Cardiovasc Res 1994;28:610 – 4. [20] Hansen F, Bergqvist D, Mangell P, Ryden A, Sonesson B,
Lanne T. Non-invasive measurement of pulsatile vessel diameter change and elastic properties in human arteries: a methodologi-cal study. Clin Physiol 1993;13:631 – 43.
[21] Hofstra L, Willigers JM, Huvers FC, Schaper NC, Kester ADM, Kitslaar PJEHM, Hoeks APG. Short-term variation in the elas-tic properties of a muscular artery in humans. Clin Sci 1994;86:567 – 74.
[22] Vaitkevicius PV, Fleg JL, Engel JW, O’Connor FC, Wright JG, Lakatta LE, Yin FC, Lakatta EG. Effects of age and aerobic capacity on arterial stiffness in healthy adults. Circulation 1993;88:1456 – 62.
[23] Nagai Y, Fleg JL, Kemper MK, Rywik TM, Earley CJ, Metter EJ. Carotid arterial stiffness as a surrogate for aortic stiffness: relationship between carotid artery pressure-strain elastic mod-ulus and aortic pulse wave velocity. Ultrasound Med Biol 1999;25:181 – 8.
[24] Pignoli P, Tremoli E, Poli A, Oreste P, Paoletti R. Intimal plus medial thickness of the arterial wall: a direct measurement with ultrasound imaging. Circulation 1986;74:1399 – 406.
[25] Devereux RB, Waeber B, Roman MJ. Conclusions on the mea-surement of arterial wall thickness: anatomic, physiologic and methodologic considerations. J Hypertens 1992;10:S119 – 21. [26] Tardy Y, Hayoz D, Mignot JP, Richard P, Brunner HR, Meister
JJ. Dynamic non-invasive measurements of arterial diameter and wall thickness. J Hypertens 1992;10:S105 – 9.