Adaptation and use of a fuzzy expert system to assess the environmental
effect of pesticides applied to field crops
Olivier Roussel
a, Alain Cavelier
b, Hayo M.G. van der Werf
c,∗aENSAR, Rennes, France bINRA-URIGC, Le Rheu, France
cINRA, Unité Sol et Agronomie de Rennes-Quimper, ENSAR-65, rue de Saint Brieuc, 35042 Rennes, France
Received 22 June 1999; received in revised form 14 January 2000; accepted 3 February 2000
Abstract
Centre d’Etude pour un Développement Agricole Plus Autonome (CEDAPA) is a group of farmers in Brittany (western France) which proposes a mainly pasture-based milk and meat production system defined by a set of prohibitions and obligations. CEDAPA farmers claim that their production system causes less environmental damage than the current systems used by most other farmers. With respect to pesticide effects this claim was examined by using an expert system (Ipest), which reflects the authors’ perception of the potential environmental effect of the application of a pesticide to a field crop. Ipest requires three types of input variables: pesticide properties, site-specific conditions and characteristics of the pesticide application. It yields four output variables: one reflecting the rate of application of the pesticide, the other three reflecting the risk for three major environmental compartments (groundwater, surface water and air). In order to fit the hydrogeological conditions of Brittany and to decrease dependence on expert judgement, the Ipest system was modified and enhanced. An existing method for the estimation of runoff risk from the field was included. This new version of the expert system, Ipest-B, was used to compare the environmental effect of pesticide use on winter wheat, silage maize and fodder beet, which overall was largely similar. However, within each of the three crops, large differences occurred from pesticide characteristics, number of treatments and environmental conditions. This type of analysis helps to identify and recommend the least harmful treatment programmes for each crop. The Ipest system was shown to be flexible, and adaptable to the particularities of Brittany. An adaptation of the system to other regional conditions should be possible. © 2000 Elsevier Science B.V. All rights reserved.
Keywords: CEDAPA; Decision support; Environmental effect assessment; Expert system; Fuzzy logic; Pesticides; France
1. Introduction
Agriculture in Brittany (western France) has seen several decades of continuous intensification. As a re-sult of this farmers in Brittany are among the most
pro-∗Corresponding author. Tel.:+33-2-23-48-5709; fax:+33-2-23-48-5630.
E-mail address: [email protected]
(H.M.G. van der Werf)
ductive in Europe, but their activities cause major en-vironmental deterioration. In particular, the pollution of water by nitrates and pesticides is a severe problem which has not gone unnoticed by water consumers: in Brittany per-capita consumption of bottled mineral water is well above the average for France (Clément et al., 1997).
To reduce environmental pollution farmers in Brit-tany try to adapt their production systems. In 1982,
the Study Centre for a More Autonomous Agricultural Development (Centre d’Etude pour un Développement Agricole Plus Autonome (CEDAPA)) was founded in central Brittany. This group, consisting currently of about 100 farmers, proposes a pasture-based milk and meat production system (Pochon, 1993). The system should allow a good income and, as the result of a re-duced work load, a better quality of life for the farmer. CEDAPA further claims that, because of a reduction of external inputs, farms are more autonomous, have lower costs and cause less environmental damage. CEDAPA farmers follow guidelines concerning pas-ture and crop management practices, animal feeding and landscape maintenance (Pochon, 1998). The pro-duction system aims at a maximum amount of forage in the diet of the cows, mainly provided by a ryegrass — white clover sward. This allows a reduction of the amount of concentrated feed needed to complement the diet.
Within this context, annual crops are grown to provide additional forage during winter. According to CEDAPA guidelines, the area dedicated to silage maize should not exceed 15% of the total area ded-icated to pasture and annual forage crops. Silage maize is considered to be a potentially polluting crop mainly because it does not cover the soil during win-ter and spring, and thus, may favour erosion, runoff and leaching. More generally, the guidelines limit ni-trogen fertilisation and use of pesticides for all crops, in order to reduce production costs and pollution risks (Pochon, 1998).
In 1993 a research programme (Système Terre et Eau) was set up to evaluate the CEDAPA production system. Within this research programme, a study was carried out in 1996 to characterise pesticide use by CEDAPA farmers. The objectives of this survey were to:
1. Evaluate the way farmers plan their crop pest man-agement;
2. Evaluate the environmental effect of pesticide use by CEDAPA farmers.
The results of the survey and an evaluation of crop protection strategies have been reported by Cavelier et al. (1997). The evaluation of the environmental effect of pesticides used by CEDAPA farmers is the subject of this paper.
This evaluation can be achieved in a variety of ways. For example, it could be based on measurement of
relevant variables or on their estimation by means of a mathematical simulation model (Stockle et al., 1994). Neither of these approaches was used here on the grounds of cost and non-availability of an adequate simulation model. Bockstaller et al. (1997) proposed a set of ‘agro-ecological indicators’ as an alternative to measurements and the use of simulation models to evaluate the environmental effects of farming systems. The term ‘indicator’ has been defined as a variable which supplies information on other variables which are difficult to access (Gras et al., 1989). Indicators synthesise information and can thus help understand-ing of a complex system (Girardin et al., 1999). Sev-eral indicator-type approaches have been proposed to assess pesticide effects (Shahane and Inman, 1987; Levitan et al., 1995; Van der Werf, 1996). Here the indicator Ipest (Van der Werf and Zimmer, 1998) was used, because it takes into account pesticide proper-ties, site-specific conditions and characteristics of the pesticide application. Ipest is suitable because the in-put variables it requires are available for the farms and the hydrogeologic conditions of Brittany.
2. Materials and methods
2.1. Data used
A pesticide application is defined as the application of a single pesticide active ingredient. A commercial product for the control of pests may contain more than one active ingredient, and a pesticide spray treatment carried out by a farmer may contain one or more com-mercial products. Thus, with this definition, a single treatment often corresponds to several pesticide appli-cations. Data on pesticide applications were collected during the 1994–1995 and the 1995–1996 cropping seasons on the farms of 23 CEDAPA members (Cave-lier et al., 1997). On a total of 31 crops of winter wheat, 16 maize crops and 14 fodder beet crops 163 treatments were made, corresponding to 329 pesticide applications and involving 54 active ingredients. Pes-ticides applied as seed treatments were ignored.
Table 1
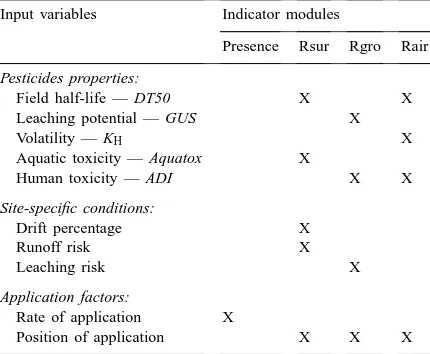
Input variables and indicator modules Presence, Rsur, Rgro and
Rair for the Ipest fuzzy expert systema
Input variables Indicator modules
Presence Rsur Rgro Rair
Pesticides properties:
Field half-life — DT50 X X
Leaching potential — GUS X
Volatility — KH X
Aquatic toxicity — Aquatox X
Human toxicity — ADI X X
Site-specific conditions:
Position of application X X X
aSources for pesticide properties are in Van der Werf and Zimmer, 1998.
active ingredients (corresponding to 34 pesticide ap-plications), Henry’s law constant was not available. In this case the value 2.65×10⁻⁵was used, which cor-responds to the median value of the transition interval (see next section).
2.2. The structure of the pesticide indicator
This study used Ipest-B (B for Brittany), a modi-fied and enhanced version of the indicator Ipest (Van der Werf and Zimmer, 1998), to estimate the potential environmental effect of pesticide applications, accord-ing to the authors’ expert perception. Ipest-B has been adapted to the hydrogeologic conditions of Brittany: shallow aquifers dominated by surface or subsurface waterflows. The Ipest fuzzy expert system will be out-lined here, full details being given by Van der Werf and Zimmer (1998).
Ipest consists of four modules. The module
Pres-ence reflects the rate of application of the pesticide, the
modules Risk of surface water contamination (Rsur),
Risk of groundwater contamination (Rgro) and Risk of air contamination (Rair) reflect the risk for three
major environmental compartments. The values of the modules depend on a total of 10 input variables (Table 1). Three types of input variables are distinguished: (a) pesticide properties; (b) site-specific conditions; (c)
characteristics of the pesticide application. The four indicator modules can be considered individually or can be aggregated into an overall indicator reflecting the total potential environmental influence of a pesti-cide application. This modular structure is flexible: the mode of aggregation of the modules can be changed and new modules (e.g. terrestrial biota, soil) can be added as availability of data and understanding of pes-ticide effects evolve. This flexibility allowed adapta-tion of the system to the hydrogeologic condiadapta-tions of Brittany.
For each module, a value on a dimensionless scale between 0 (no risk of environmental effect) and 1 (maximum risk of environmental effect) is calculated. These values are calculated according to decision rules and to the degree of membership of the input variables to ‘fuzzy’ subsets. The mechanism will be explained briefly below.
For all input variables given in Table 1 two fuzzy subsets F (Favourable, i.e. the set of values which are considered to give rise to acceptable environmen-tal effect) and U (Unfavourable, i.e. the set of val-ues which are considered to give rise to unacceptable environmental effect) were defined. The membership of values of input variables to the fuzzy subsets F and U is defined by a membership function, which can take any value from the interval [0, 1]. The value 0 represents complete non-membership, the value 1 represents complete membership; values in between are used to represent partial membership. Membership functions have been defined such that the value of an input variable either belongs fully to one of the two fuzzy subsets or partially to both, in the latter case the value is within a ‘transition interval’.
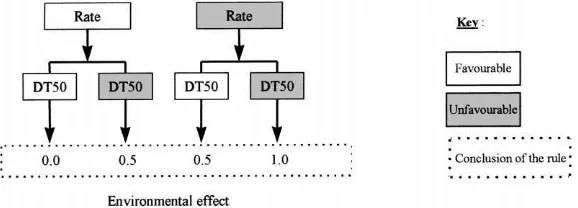
Calculations are carried out according to a set of rules of the type: IF (premise) THEN (conclusion). This may be illustrated by an example. Assuming that the output variable Environmental effect of the appli-cation of a pesticide depends on two input variables only: Rate of application and pesticide Field half-life. A first decision rule of the expert system might be: “If
Rate of application is favourable (i.e. low) and if Field half-life is favourable (i.e. short) then Environmental effect is 0 (no effect)”. This rule is summarised in the
Table 2
Summary of decision rules describing the effect of the input variables Rate of application and DT50 on the hypothetical module
Environmental effecta
Rate of application DT50 Environmental effect
F F 0.0
F U 0.5
U F 0.5
U U 1.0
aF: Favourable; U: Unfavourable.
conclusions of the decision rules to obtain a value for the module. Fig. 1 shows the decision rules from Table 2. This mode of presentation is followed in this paper.
3. Results
3.1. Modification of Ipest
The modifications made had as their objective the transformation of the expert system Ipest into Ipest-B, adapted to the hydrogeological conditions of Brittany. No change was made to the modules Presence and
Rair, which remain as described by Van der Werf and
Zimmer (1998). Presence depends on the rate of ap-plication of active ingredient only. Rair reflects the po-tential of a pesticide to volatilise and contaminate air. Its value depends on four input variables: (1) pesticide volatility; (2) the position of application of the pesti-cide (on the crop, on the soil, in the soil); (3) the field half-life of the pesticide (average values) and (4) the toxicity of the pesticide to humans (based on Accept-able Daily Intake). Fig. 2 shows the decision rules for
Fig. 1. Summary of decision rules. The effects of the input variables Rate of application and Field half-life (DT50) on the value of the conclusions of the decision rules for the hypothetical indicator module Environmental effect according to their membership to the fuzzy sets Favourable and Unfavourable.
Fig. 2. The effect of the input variables Volatility, Position of
application, Field half-life (DT50) and Human toxicity on the value
of the conclusions of the decision rules for the indicator module
Rair according to their membership to the fuzzy sets Favourable
(non-shaded boxes) and Unfavourable (shaded boxes). For details, see Van der Werf and Zimmer (1998).
the calculation of Rair. The modules Rgro and Rsur have been modified.
3.1.1. The module Rgro
the soil); (3) soil leaching risk and (4) the toxicity of the pesticide to humans (based on Acceptable Daily Intake). In Ipest, the estimation of soil leaching risk is up to ‘user-expertise’; for Ipest-B this was replaced by two new input variables.
Leaching risk depends on characteristics of the soil, the unsaturated zone above the water table and the sat-urated aquifer. Van der Werf and Zimmer (1998) cite several methods which can be used to assess this risk as a function of soil characteristics only (e.g. Goss and Wauchope, 1990), or of overall hydrogeologic settings including soil characteristics (e.g. Aller et al., 1985; Hollis, 1991). However, because of a lack of soil data for the fields in the present study neither of these meth-ods was appropriate. Instead, estimates were made of the risk of pesticide loss to groundwater from two vari-ables: Soil organic matter content and Geologic
sub-stratum. Soil organic matter content is considered the
single most important soil characteristic affecting pes-ticide leaching (Van der Zee and Boesten, 1991). Geo-logic substratum affects movement of pesticides once they have left the soil. In the hydrogeologic context of Brittany geologic substratum is considered to be more important than soil organic matter content with respect to pesticide loss from a field to groundwater (Carré, 1997, personal communication).
The choices of the values of input variables lim-iting the transition interval define the fuzzy subsets. Reus (1993) defines five classes for soil leaching potential based on organic matter content: <1.5, 1.5–3, 3–6, 6–12 and >12%. Hollis (1991) identifies three classes for organic matter content: low=1.1%, intermediate=2.5% and high=4.7–7%. Considering the range of soil organic matter contents found in Brittany (Walter et al., 1995), the present authors de-fine the limits of the transition interval by assigning complete membership to U if Soil organic matter
content <2% and complete membership to F if Soil
organic matter content >5%.
Carré et al. (1994) have shown that contamination risk of groundwater depends on geologic substratum. The character of the mechanism involved may be phys-ical (protection of the groundwater, clay content) or chemical (pH). This study considered particularly the physical mechanisms in estimating the effect of geo-logic substratum on groundwater contamination risk. On a 0 (no contamination risk) to 1 (major contamina-tion risk) scale Carré (1997, personal communicacontamina-tion)
attributes the following scores to the input variable
Geologic substratum:
• 0.3 for a schist substratum where aquifers are
pro-tected because they are generally confined, • 0.5 for granite where aquifers generally are free and,
therefore, less protected, the breakdown of pesti-cides being favoured because of their slow transit in these substratums,
• 1.0 for a calcareous substratum or an alluvium
which allow rapid hydrologic infiltrations.
The transition interval is defined by assigning com-plete membership to F if Geologic substratum=0 and complete membership to U if Geologic substratum=1. These modifications lead to a new module Rgro which depends on the input variables GUS, Position of
ap-plication, Geologic substratum, Soil organic matter content and Human toxicity according to a set of
32 decision rules (not shown). These decision rules (summarised in Fig. 3) reflect the authors’ ‘expert’ perception of the Rgro as a result of a pesticide application.
3.1.2. The module Rsur
The indicator module Rsur reflects the potential of a pesticide to reach surface water through runoff or drift and to harm aquatic organisms. Rsur as proposed by Van der Werf and Zimmer (1998) depends on five input variables: (1) the runoff risk of the field site; (2) the drift percentage (depends on application tech-nique and distance to surface water); (3) the position of application of the pesticide (on the crop, on the soil, in the soil); (4) the field half-life of the pesti-cide (average values) and (5) the toxicity of the pes-ticide to three aquatic organisms (algae, crustaceans and fish). For Ipest-B, the present authors implemented the input variable 1 (in Ipest, its estimation was up to ‘user-expertise’) and added a sixth input variable:
Human toxicity.
Fig. 3. The effect of the input variables GUS, Position of application, Geologic Substratum, Soil organic Matter content (OM), and Human
toxicity (H.T.) on the value of the conclusions of the decision rules for the indicator module Rgro according to their membership to the
fuzzy sets Favourable (non-shaded boxes) and Unfavourable (shaded boxes). Boxes with a dotted outline indicate modifications relative to the proposal by Van der Werf and Zimmer (1998).
more recent version of this method was published by Aurousseau et al. (1998).
Aurousseau et al. use a scoring method called SIRIS (System of Integration of Risk with Interac-tion of Scores, Vaillant et al., 1995) to implement their method for the evaluation of the risk of pesti-cide runoff. The SIRIS method can be used for any problem which requires taking into account a number of criteria or input variables in order to rank options (in the present case field sites are ranked with re-spect to runoff risk). The method involves defining two to four classes for each criterion and attribut-ing modalities to the classes. Quantitative as well as qualitative data can be used, the modalities are: f (favourable), m (median), u (unfavourable) and U (very unfavourable).
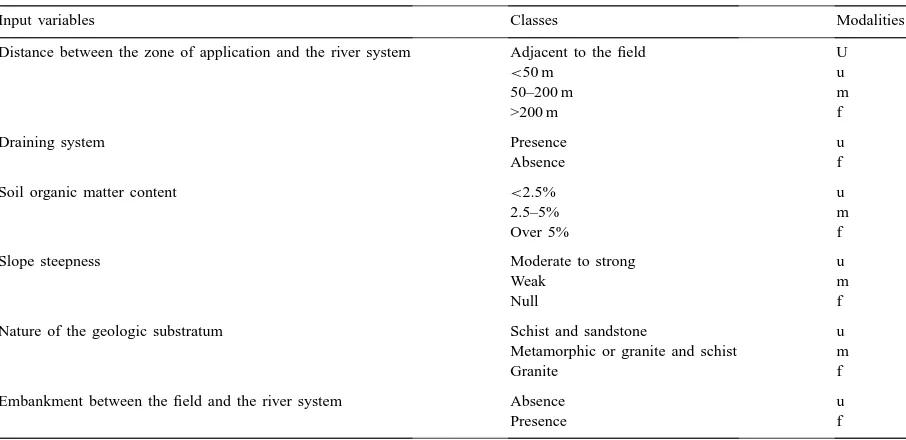
Aurousseau et al. propose eleven criteria which af-fect the runoff risk of a field. In this study data were available for six of these criteria (Table 3):
1. Distance between the zone of application and the river system: This criterion was defined as the dis-tance between the lowest part of the field and the river system. Its value was obtained by interview-ing the farmer.
2. Presence of a man-made draining system: On
shallow soils or in winter the presence of a draining system will facilitate infiltration and thus decrease runoff risk. However, a drainage system favours transfers by preferential flow, in particular of par-ticles, and therefore, its presence is considered unfavourable. Obviously this criterion does not concern runoff risk in the strict sense but rather the risk of transfer to surface water in general. 3. Soil organic matter content: This was obtained by
interviewing the farmer.
4. Slope steepness: This criterion is estimated quali-tatively by the farmer.
5. Geologic substratum: This criterion is estimated from a soil map. Granite is considered favourable and schist or sandstone unfavourable because drainage is better on granite than on schist and sandstone.
6. Existence of an embankment downhill from the field between the field and the river system is con-sidered to be favourable.
The five criteria not taken into account (data were not available) are:
• the length of the slope,
• the presence of permanent vegetation (wood,
Table 3
List of the input variables, classes and modalities incorporated in this version of the Aurousseau indicator assessing the runoff risk of a fielda
Input variables Classes Modalities
Distance between the zone of application and the river system Adjacent to the field U
<50 m u
50–200 m m
>200 m f
Draining system Presence u
Absence f
Soil organic matter content <2.5% u
2.5–5% m
Over 5% f
Slope steepness Moderate to strong u
Weak m
Null f
Nature of the geologic substratum Schist and sandstone u
Metamorphic or granite and schist m
Granite f
Embankment between the field and the river system Absence u
Presence f
af: Favourable; m: median; u: unfavourable and U: very unfavourable.
• the shape of the slope (presence of a concave zone),
• the risk of surface crusting, an index of
susceptibil-ity to crusting calculated from granulometric data and organic matter content,
• the risk of an intense rainstorm shortly after appli-cation (calculated from historic meteorological data and sowing date).
The method proposed by Aurousseau et al. allows the calculation of a rank with respect to runoff risk for each field. The rank is transformed into a value between 0 and 1 by dividing it by the highest rank number. The transition interval is defined by assign-ing complete membership to F if Runoff risk=0 and complete membership to U if Runoff risk=1.
The indicator Ipest was constructed assuming that groundwater rather than surface water is the raw ma-terial for drinking water, so Human toxicity was an input variable for Rgro and not for Rsur. In Brittany, 80% of drinking water is made from surface water, so for Ipest-B Human toxicity was added as an input variable for Rsur, with the same weight as Aquatic
toxicity (Fig. 4).
3.1.3. Aggregation of the modules: Ipest-B
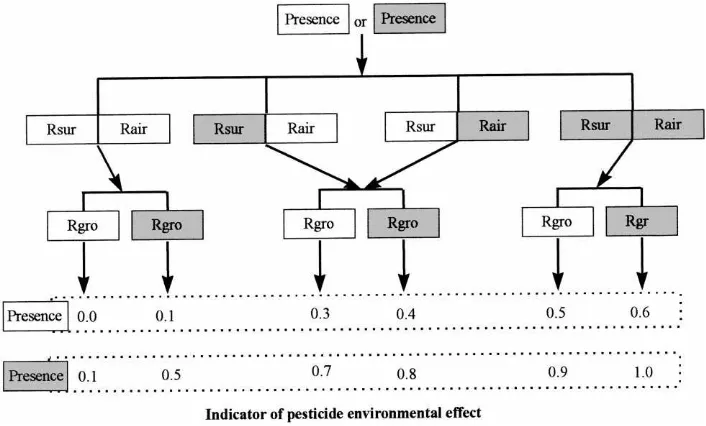
The indicator Ipest-B results from the aggregation of the four modules. For Ipest Van der Werf and
Zim-mer (1998) gave a similar weight to the modules Rsur,
Rgro and Rair. For Ipest-B, it was decided to give
less weight to the module Rgro (Fig. 5), as in Brit-tany groundwater is much less important than surface water.
3.2. Application of Ipest-B, a comparison of pesticide environmental effect of beet, wheat and maize
In the survey, pesticides were applied 31 crops of winter wheat, 16 crops of silage maize and 14 fodder beet crops, and each crop was grown on a different field. These crops were compared with respect to pes-ticide environmental effect. As the value of Ipest-B depends, amongst others, on site-specific conditions, it should be known to what extent the crops in this study differed for input variables reflecting these con-ditions. Soil organic matter content and Runoff risk are rather similar for the three crops (Fig. 6 ). For
Ge-ologic substratum and Drift percentage the fields on
Fig. 4. The effect of the input variables Runoff risk, Drift percentage, Position of application, Field half-life (DT50), Human toxicity (H.T.), and Aquatic toxicity (A.T.) on the value of the conclusions of the decision rules for the indicator module Rsur according to their membership to the fuzzy sets Favourable (non-shaded boxes) and Unfavourable (shaded boxes). Boxes with a dotted outline indicate modifications relative to the proposal by Van der Werf and Zimmer (1998).
3.2.1. Average and cumulative values of the four modules and of Ipest-B
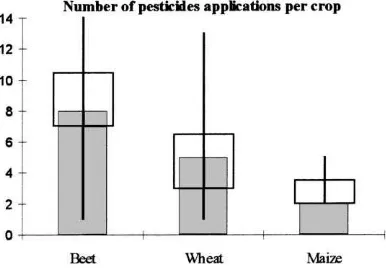
The number of pesticide applications varied from 1 to 14 for beet, from 1 to 13 for wheat and from 2 to 5 for maize (Fig. 7). The median and average
Fig. 5. The effect of the modules Presence, Rsur, Rgro and Rair on the value of the conclusions of Ipest-B (indicator of environmental effect) according to their membership to the fuzzy sets Favourable (non-shaded boxes) and Unfavourable (shaded boxes).
Fig. 6. Distribution of Soil organic matter content, Runoff risk, Geologic substratum and Drift percentage for each crop. Diagrams for
Soil organic matter content and Runoff risk present the distribution of values: vertical line shows the range of values from minimum to
maximum, box contains 50% of values, excluding the lowest and highest 25%, histogram bar shows median value.
Fig. 7. Distributions of the number of pesticide applications per crop for a growing season. The vertical line shows the range from minimum to maximum value, the box contains 50% of values, excluding the lowest and highest 25%, the histogram bar shows the median value.
For each field the values for the individual appli-cations applied during the growing season were used to calculate averages for the four modules and Ipest (Fig. 8). The average values of Presence and Rgro are higher for maize than for beet and wheat (Fig. 8a and b); with respect to Rair wheat and maize are similar and values are smaller for beet (Fig. 8c). The average values of Rsur show a wide range within each of the three crops, the median values being similar (Fig. 8d). The average values of Ipest-B are smallest for beet and largest for maize (Fig. 8e), despite more unfavourable site-specific conditions (substratum and drift percent-age) for beet.
Fig. 8. (a–e) Distribution of the average values of the four modules and of Ipest-B for each crop. The vertical line shows the range from minimum to maximum value, the box contains 50% of values, excluding the lowest and highest 25%, the histogram bar shows the median value.
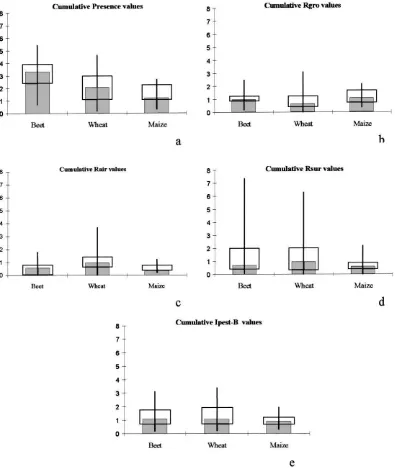
modules and Ipest-B (Fig. 9). These values give an indication of the potential environmental effect of overall pesticide use in a crop. Cumulative Presence values are largest for beet and smallest for maize (Fig. 9a). For Rgro, the crops do not differ much
Fig. 9. (a–e) Distribution of the cumulative values of the four modules and of Ipest-B for each crop. The vertical line shows the range from minimum to maximum value, the box contains 50% of values, excluding the lowest and highest 25%, the histogram bar shows the median value.
beet and wheat are quite similar; maize has a similar median value but its maximum value for Ipest-B is less than 2; whereas for beet and wheat it exceeds 3 (Fig. 9e).
3.2.2. Some selected pesticide treatment sequences
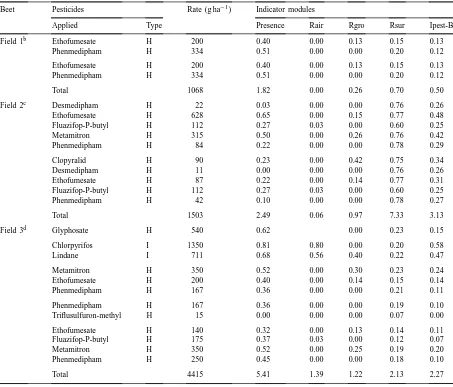
partic-ular for beet and wheat (Fig. 9e). To examine this variability, some fields were selected for each crop having particularly low or high cumulative Ipest-B scores.
Table 4
Cumulative Ipest-B scores for selected pesticide sequences on beet crops, data from survey of CEDAPA membersa
Beet Pesticides Rate (g ha−1) Indicator modules
Applied Type Presence Rair Rgro Rsur Ipest-B
Field 1b Ethofumesate H 200 0.40 0.00 0.13 0.15 0.13
Phenmedipham H 334 0.51 0.00 0.00 0.20 0.12
Ethofumesate H 200 0.40 0.00 0.13 0.15 0.13
Phenmedipham H 334 0.51 0.00 0.00 0.20 0.12
Total 1068 1.82 0.00 0.26 0.70 0.50
Field 2c Desmedipham H 22 0.03 0.00 0.00 0.76 0.26
Ethofumesate H 628 0.65 0.00 0.15 0.77 0.48
Fluazifop-P-butyl H 112 0.27 0.03 0.00 0.60 0.25
Metamitron H 315 0.50 0.00 0.26 0.76 0.42
Phenmedipham H 84 0.22 0.00 0.00 0.78 0.29
Clopyralid H 90 0.23 0.00 0.42 0.75 0.34
Desmedipham H 11 0.00 0.00 0.00 0.76 0.26
Ethofumesate H 87 0.22 0.00 0.14 0.77 0.31
Fluazifop-P-butyl H 112 0.27 0.03 0.00 0.60 0.25
Phenmedipham H 42 0.10 0.00 0.00 0.78 0.27
Total 1503 2.49 0.06 0.97 7.33 3.13
Field 3d Glyphosate H 540 0.62 0.00 0.23 0.15
Chlorpyrifos I 1350 0.81 0.80 0.00 0.20 0.58
Lindane I 711 0.68 0.56 0.40 0.22 0.47
Metamitron H 350 0.52 0.00 0.30 0.23 0.24
Ethofumesate H 200 0.40 0.00 0.14 0.15 0.14
Phenmedipham H 167 0.36 0.00 0.00 0.21 0.11
Phenmedipham H 167 0.36 0.00 0.00 0.19 0.10
Triflusulfuron-methyl H 15 0.00 0.00 0.00 0.07 0.00
Ethofumesate H 140 0.32 0.00 0.13 0.14 0.11
Fluazifop-P-butyl H 175 0.37 0.03 0.00 0.12 0.07
Metamitron H 350 0.52 0.00 0.25 0.19 0.20
Phenmedipham H 250 0.45 0.00 0.00 0.18 0.10
Total 4415 5.41 1.39 1.22 2.13 2.27
aCumulative (Total) scores are preceded by the scores for each application (H: Herbicide, I: Insecticide); pesticides not separated by space were applied as one treatment; treatments are in chronological order; site-specific conditions and characteristics of the application: Geol. Subst.: Geologic substratum and OM: Soil organic matter content; a blank for Rair corresponds to a lack of KH data; it was considered as a 0.00 score for the Ipest-B calculation.
bRunoff risk=0.25, drift=0%; Geol. Subst.=0.5, OM=5%; low number of applications, moderate runoff risk, no drift, application rates are 30–50% of recommended rates.
cRunoff risk=0.62, drift=1%; Geol. Subst.=0.3, OM=4.8%; many applications, high runoff risk, very high drift percentage resulting in very high risk for surface water.
dRunoff risk=0.25, drift=0%; Geol. Subst.=0.5, OM=5.5%; many applications, moderate runoff risk, no drift, both insecticides yield high scores.
The beet crop on Field 1 has a low cumulative
Ipest-B score (Table 4). This is the result of a
Table 5
Cumulative Ipest-B scores for selected pesticide sequences on wheat crops, data from survey of CEDAPA membersa
Wheat Pesticides Rate (g ha−1) Indicator modules
Applied Type Presence Rair Rgro Rsur Ipest-B
Field 4b MCPA H 800 0.70 0.00 0.40 0.00 0.18
Metconazole F 90 0.23 0.00 0.00 0.01
Total 890 0.93 0.00 0.40 0.00 0.19
Field 5c Isoproturon H 750 0.69 0.00 0.24 0.06 0.14
Metsulfuron methyl H 6 0.00 0.17 0.37 0.06 0.08
Thifensulfuron-methyl H 6 0.00 0.00 0.38 0.05 0.04
Fenoxaprop-P-ethyl H 55 0.14 0.00 0.00 0.08 0.02
Fenpropidin F 375 0.54 0.13 0.00 0.07 0.11
Hexaconazole F 250 0.45 0.00 0.13 0.07 0.08
Total 1442 1.82 0.30 1.12 0.39 0.47
Field 6d Diflufenican H 125 0.29 0.53 0.00 0.69 0.43
Ioxynil H 90 0.23 0.40 0.00 0.57 0.34
Isoproturon H 1625 0.84 0.00 0.23 0.71 0.53
Mecoprop H 270 0.46 0.00 0.44 0.66 0.40
Tebuconazole F 250 0.45 0.00 0.34 0.82 0.45
Total 2360 2.27 0.93 1.01 3.45 2.15
aCumulative (Total) scores are preceded by the scores for each application (H: Herbicide, F: Fungicide); pesticides not separated by space were applied as one treatment; treatments are in chronological order; site-specific conditions and characteristics of the application: Geol. Subst.: Geologic substratum, OM: Soil organic matter content; a blank for Rair corresponds to a lack of KHdata; it was considered as a 0.00 score for the Ipest-B calculation.
bRunoff risk=0.01, drift=0%; Geol. Subst.=0.5, OM=6%; low number of applications, very low runoff risk, no drift; a spring-tined weeder harrow was used for additional weed control.
cRunoff risk=0.14, drift=0%; Geol. Subst.=0.5, OM=4.9%; low runoff risk, no drift, pesticides applied at low doses. dRunoff risk=0.68, drift=1%; Geol. Subst.=0.3, OM=3.5%; high runoff risk and very high drift percentage.
score, the total amount applied and cumulative score for Presence being somewhat higher than for Field 1. However, the real problem for this field is its high
Runoff risk and Drift percentage causing high Rsur
values. Field 3 also has a high cumulative Ipest-B score, despite a low Runoff risk and a Drift
percent-age of 0. The large number of applications and, in
particular, the two insecticide treatments explain the score.
The wheat crop on Field 4 has a very low cumu-lative Ipest-B score (Table 5). Only one herbicide application and one fungicide application were car-ried out, mechanical weed control was used. The low score results from a limited number of applica-tions, at low rates in a low risk environment. In the wheat crop of Field 5, four herbicide applications and two applications of fungicides were made. The
cumulative Ipest-B score is low, because low doses are used in a low risk environment. On Field 6, four herbicide applications and one fungicide application were made, giving a much higher cumulative Ipest-B score than Field 5, which had a similar number of applications. The total amount applied is somewhat higher, but the problem is the high Runoff risk and
Drift percentage causing high Rsur values; in addition
two of the herbicide applications yield a high Rair score.
The maize crops on Fields 7 and 8 received a sim-ilar amount of herbicide (Table 6). Runoff risk and
Drift percentage are low in both cases. On Field 7
cumulative Ipest-B score is 0.28 and on Field 8 it is 0.60. This difference results from the characteristics of the pesticides used, producing higher values for
Table 6
Cumulative Ipest-B scores for selected pesticide sequences on maize crops, data from survey of CEDAPA membersa
Maize Pesticides Rate (g ha−1) Indicator modules
Applied Type Presence Rair Rgro Rsur Ipest-B
Field 7b Bromoxynil octanoate H 300 0.49 0.00 0.10 0.07
Dicamba H 480 0.59 0.00 0.50 0.09 0.21
Total 780 1.08 0.00 0.50 0.19 0.28
Field 8c Atrazine H 750 0.69 0.00 0.65 0.00 0.29
Dinoterb H 250 0.45 0.37 0.36 0.00 0.31
Total 1000 1.14 0.37 1.01 0.00 0.60
Field 9d Lindane I 1500 0.82 0.56 0.37 0.46 0.62
Atrazine H 750 0.69 0.00 0.65 0.46 0.42
Dinoterb H 200 0.40 0.37 0.36 0.40 0.47
Nicosulfuron H 40 0.10 0.29 0.23 0.12
Pyridate H 675 0.67 0.00 0.00 0.30 0.20
Total 3165 2.68 0.93 1.67 1.85 1.83
aCumulative (Total) scores are preceded by the scores for each application (H: Herbicide, I: Insecticide); pesticides not separated by space were applied as one treatment; treatments are in chronological order; site-specific conditions and characteristics of the application: Geol. Subst.: Geologic substratum, OM: Soil organic matter content; a blank for Rair corresponds to a lack of KHdata; it was considered as a 0.00 score for the Ipest-B calculation.
bRunoff risk=0.14, drift=0%; Geol. Subst.=0.5, OM=4.9%; low number of applications, low runoff risk, no drift.
cRunoff risk=0.02, drift=0%; Geol. Subst.=0.5, OM=6%; low number of applications, very low runoff risk, no drift but risk for groundwater.
dRunoff risk=0.25, drift=0.3%; Geol. Subst.=0.5, OM=5.6%; some high rates of application, moderate runoff risk and drift percentage.
and four herbicides were applied. Cumulative Ipest-B score is high, from several causes: Runoff risk and Drift
percentage are higher than on Fields 7 and 8, total
amount applied is high, several pesticides pose a risk for air and groundwater and all pose a risk to surface water.
3.3. Feedback of Ipest-B to the farmers of the CEDAPA network
The results of this study have been presented to the CEDAPA farmers on whose fields they were obtained. The farmers were greatly interested in these results, as they are looking for ways to reduce the environ-mental effects of their farming practices. Its use as a tool for a retrospective diagnostic of pesticide en-vironmental effect was well understood and appreci-ated. The farmers said that they would like to use the Ipest-B decision aid tool to simulate the potential en-vironmental effect of different sequences of pesticide applications.
4. Discussion and conclusions
This paper presents the adaptation and use of the Ipest expert system to assess the potential environ-mental effect of pesticide use on three annual crops in Brittany. The system has been shown to be suffi-ciently flexible. Its adaptation to the hydrogeological conditions of Brittany was carried out in collaboration with local experts and has proven to be feasible. The incorporation of an existing method for the estimation of runoff risk of the field was relatively simple.
are largest for maize and smallest for beet. However, when the values for the individual applications ap-plied during the growing season are summed in order to obtain an indication of the potential environmental effect of overall pesticide use in each crop, the three crops were found to have similar median values for
Ipest-B. So, the prejudice against maize seems at least
to be an oversimplification of reality where pesticide environmental effect is concerned.
This study has revealed very large differences with respect to overall pesticide effect within each of the three crops, because of pesticide characteristics, num-ber of treatments and environmental conditions. For each crop, the least harmful treatment programmes can be identified and recommended to the farmers. An adaptation of the system to other regional conditions should be possible.
Acknowledgements
The authors thank C. Bockstaller, K. Lewis, N. Munier-Jolain and P. Aurrousseau for providing valu-able comments on a draft of this paper. They also thank F. Bouneb (INRA-Phytopharmacie), R.L. Glenn (USDA) and J.B.H.J. Linders (RIVM) for supplying pesticide data and anonymous reviewers for improve-ments to an earlier version of this paper.
References
Aller, L., Bennett, T., Lehr, J.H., Petty R.L., 1985. DRASTIC: a standardised system for evaluating groundwater pollution potential using hydrogeologic settings. U.S.EPA, Environmental Research laboratory, Ada, OK, USA. U.S.EPA Report 600/2-85/018.
Aurousseau, P., Squividant, H., Baque, M.C., Simon, F., 1996. Analyse des facteurs de risque de transferts de pesticides dans les paysages. Etablissement d’une hiérarchie de ces risques: application au calcul d’un indice de risque par bassin versant et par parcelle. Ecole Nationale Supérieure Agronomique de Rennes, Rennes, France, 22 pp.
Aurousseau, P., Gascuel-Odoux, C., Squividant, H., 1998. Eléments pour une méthode d’évaluation d’un risque parcellaire de contamination des eaux superficielles par les pesticides. Application au cas de la contamination par les herbicides utilisés sur culture de ma¨ıs sur des bassins versants armoricains. Etude et Gestion des Sols 5 (3), 143–156.
Bockstaller, C., Girardin, P., van der Werf, H.M.G., 1997. Use of agro-ecological indicators for the evaluation of farming systems. Eur. J. Agron. 7, 261–270.
Carré, J., Bouteiller, S., Dufils, J., Freslon, M., 1994. Approche des facteurs de contamination des eaux souterraines par l’atrazine et la simazine. Cas des aquifères de la Manche. J. Européen d’Hydrologie, tome 25, fasc. 2, 169–184.
Cavelier, A., Communier, S., Alard, V., Heurtel, G., 1997. Variabilité des pratiques phytosanitaires dans un réseau de polyculture-élevage en centre-Bretagne. Les cahiers du BIOGER, Vol. 1. Centre Régional d’Etudes Biologiques et Sociales, Rennes, France, 38 pp.
Clément, L., Destandau, S., Eneau, D., 1997. Le budget des ménages en 1995. INSEE Résultats No. 550. Institut National de la Statistique et des Etudes Economiques, Paris, France.
Girardin, P., Bockstaller, C., van der Werf, H.M.G., 1999. Indicators: tools to evaluate the environmental impact of farming systems. J. Sustain. Agric. 13 (4), 5–21.
Goss, D., Wauchope, R.D., 1990. The SCS/ARS/CES pesticide properties database II using it with soils data in a screening procedure. In: Weigman, D.L. (Ed.), Pesticides in the Next Decade: The Challenges Ahead. Virginia Water Resources Research Center, Blacksburg, VA, USA, pp. 471–493. Gras, R., Benoit, M., Deffontaines, J.P., Duru, M., Lafarge,
M., Langlet, A., Osty, P.L., 1989. Le fait technique en agronomie. Activité agricole, concepts et méthodes d’étude. INRA, L’Harmattan, Paris, France.
Hollis, J.M., 1991. Mapping the vulnerability of aquifers and surface waters to pesticide contamination at the national/regional scale. In: A. Walker (Ed.), Pesticides in Soil and Water: Current Perspectives, BCPC Monograph No. 47. The Lavenham Press Limited, Lavenham, Surrey, 1992, pp. 165–174.
Leonard, R.A., 1990. Movement of pesticides into surface waters. In: Pesticides in the Soil Environment. Soil Sci. Soc. of America Book Series, No. 2, Madison, WI, USA, pp. 303–349. Levitan, L., Merwin, I., Kovach, J., 1995. Assessing the relative
environmental impacts of agricultural pesticides: the quest for a holistic method. Agric., Ecosyst. Environ. 55, 153– 168.
Pochon, A., 1993. La prairie temporaire à base de trèfle blanc. Trente cinq années de pratique d’un éleveur breton, 3rd updated Edition, CEDAPA, Plérin, France.
Pochon, A., 1998. Les champs du possible. Plaidoyer pour une agriculture durable. La Découverte et Syros, Paris, France. Reus, J., 1993. An environmental yardstick for pesticides: An
instrument to measure the environmental impact of pesticides. Acta Horticulturae 347, 215–224.
Shahane, A.N., Inman, R.C., 1987. Review of available pesticide rating systems. Hazard Assess. Chem. 5, 103–132.
Simon, F., 1995. Analyse des facteurs de risques de transferts de pesticides dans les paysages. Etablissement d’une hiérarchie de ces risques: application à des bassins versants. Mémoire de fin d’études. Ecole Nationale Supérieure Agronomique, Rennes, France.
Stockle, C.O., Papendick, R.I., Saxton, K.E., Campbell, G.S., van Evert, F.K., 1994. A framework for evaluating the sustainability of agricultural production systems. Am. J. Alt. Agric. 9, 45–50. Sugeno, M., 1985. An introductory survey of fuzzy control.
Vaillant, M., Jouany, J.M., Devillers, J., 1995. A multicriteria estimation of the environmental risk of chemicals with the SIRIS method. Toxicol. Model. 1, 57–72.
Van der Werf, H.M.G., 1996. Evaluating the impact of pesticides on the environment. Agric., Ecosyst. Environ. 60, 81– 96.
Van der Werf, H.M.G., Zimmer, C., 1998. An indicator of pesticide environmental impact based on a fuzzy expert system. Chemosphere 36 (10), 2225–2249.
Van der Zee, S.E.A.T.M., Boesten, J.J.T.I., 1991. Effects of soil heterogeneity on pesticide leaching to groundwater. Water Resources Res. 27, 3051–3063.
