Dew formation on rice under varying durations
of nocturnal radiative loss
Weihong Luo
a,b, Jan Goudriaan
a,∗aDepartment of Theoretical Production Ecology, Wageningen Agricultural University, P. O. Box 430, 6700 AK Wageningen, Netherlands bDepartment of Agronomy, Nanjing Agricultural University, Nanjing, Jiangsu 210095, China
Received 9 September 1999; received in revised form 13 June 2000; accepted 14 June 2000
Abstract
In order to understand how nocturnal net radiative loss affects dew formation, a shielding experiment was carried out in a rice field at the International Rice Research Institute during 16 nights in February, March, and April 1994. Four plots (with an area of 4×5 m for each) in the field were used to measure the dew amount and duration in the rice crops. During each night, two of the four plots were covered using black plastic sheets from sunset (about 18:00) till 03:00 or 04:00 or 05:00 of the next day. The other two plots were used as a control (without cover). The results showed that in the dry season in the tropics, daily total dew duration on top leaves mainly depended on night time dew duration and the latent heat released by dew formation on the top leaves was about 20% of the nocturnal net radiative loss. The measurement error in nocturnal net radiative loss caused by dew formation on the dome of the net radiometer was typically about 7 W m−2, with 18 W m−2as an
extreme value in the dry season in the tropics during heavy dew nights. Both dew amount and dew duration on the top leaves could be reasonably predicted (r2=0.8) by a physically based simulation model, although a standard error remained of about 0.03 mm for dew amount and 2.3 h for dew duration, respectively. Measurement errors in weather variables, especially in net radiative loss and in water vapour pressure deficit, are probably the main causes of these deviations. Dew amount was more strongly affected by the nightly minimum value of water vapour pressure deficit than by its mean value. Guttation by the rice plants themselves supplied as much water to the leaf surface of the paddy rice crops as dewfall did. Unexpectedly, shielding from nocturnal net radiative loss provided a feasible method to measure guttation water intercepted by different layers inside the paddy rice crops. © 2000 Elsevier Science B.V. All rights reserved.
Keywords:Shielding experiment; Nocturnal net radiative loss; Dew duration; Dew amount; Guttation
1. Introduction
Leaf wetness is an important factor in plant disease epidemics and also in the deposition of acidic air pol-lutants on plant surfaces. It provides the free water that is essential to the development of many foliar
bac-∗Corresponding author. Tel.:+31-317-4839-87; fax:+31-317-4848-92.
E-mail address:[email protected] (J. Goudriaan).
terial and fungal plant pathogens (Wallin, 1963) and may enhance the deposition of the pollutants (Janssen and Romer, 1991; Hughes and Brimblecombe, 1994). For instance, leaf wetness is required by all models and systems that forecast rice blast epidemics (one of the most severe diseases of rice crops) (Uehara et al., 1988; Manibhushanrao and Krishan, 1991; Kim and Kim, 1991; Horino, 1992).
Dew, as a main contributor to leaf wetness, normally occurs during nighttime as a result of radiative loss
of heat from the leaf surface, followed by condensa-tion of water vapour. Thus, nocturnal net radiative loss plays an important role in the dew formation process. Nocturnal net radiative loss is a direct or indirect in-put of many dew formation simulation models that use the energy balance approach (e.g. Pedro and Gillespie, 1982a, b; Jacobs et al., 1990; Wittich, 1995; Wilson et al., 1999). Its effect on dew formation was theoreti-cally studied by comparing it with model outputs or by sensitivity analyses (Scherm and van Bruggen, 1993). The amount of dew formed on a surface depends on how much nocturnal net radiation is balanced by latent heat. Simulated dew formation practically al-ways deviates from measured results. This deviation can be attributed to measurement errors, both of dew formation and of relevant weather data, but also to deviations in the model structure from reality. The objective of this study was to experimentally inves-tigate how the dew formation depends on nocturnal net radiative loss. The understanding of these factors is essential for accurate estimation of dew formation.
2. Materials and methods
2.1. Site, treatment and crop
The experiment was carried out at the Interna-tional Rice Research Institute (IRRI), Los Baños (14◦11′N, 121◦15′E, 20.0 m amsl), Philippines
dur-ing 16 rain-free nights (22–24, 28 February, 1, 3–4, 28, 30–31 March, and 1–2, 6–9 April) in 1994 (the dry season in the wet tropics). Over rice canopies in four 4×5 m plots, global radiation (at 2.5 m above the paddy water surface), net (at 2.0 m above the paddy water surface) and paddy water temperatures (at 0.05 m below the water surface) were automati-cally monitored. All aerial sensors were mounted on tripods, each of which was set up at the centre of one of the four plots. To avoid disturbance of the rice
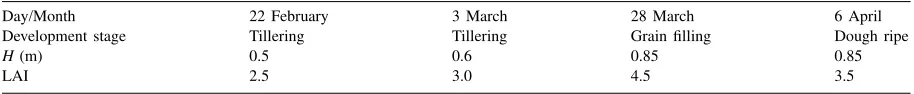
Table 1
Crop height (H) and LAI at different development stage (variety: IR72)
Day/Month 22 February 3 March 28 March 6 April
Development stage Tillering Tillering Grain filling Dough ripe
H(m) 0.5 0.6 0.85 0.85
LAI 2.5 3.0 4.5 3.5
canopies, a walk board was installed between the tri-pod and the edge of the field. The four plots were near the centre of a 25×50 m paddy rice field. To mea-sure the total amount of dew during the whole night, two plots were kept continuously open without cover (control treatment). The other two plots were cov-ered with a sheet of 4×5 m black plastic from sunset (18:00) till 03:00 or 04:00 or 05:00 of the next day to create different levels of nocturnal net radiative loss. The plastic cover was supported at a height of 2.5 m above the ground by a wooden frame. The removal of the cover was achieved by rolling up the plastic. In this way, two exposure durations to nocturnal net radiative loss were observed each night.
The rice variety used in the experiment was IR72. The experiment was done in the period of crop devel-opment from tillering to dough ripe stage. Crop height, H, and leaf area index, LAI, during the experimental periods are given in Table 1.
2.2. Instrumentation
An ES230 LI-Cor pyranometer, REBS net radio-meter (model Q-6), and RM Young Wind Sentry anemometer were used to measure global radia-tion, net radiaradia-tion, and wind speed, respectively. The manufacturer’s calibrations were used. Air and paddy water temperature and air humidity were measured with copper–constantan thermocouples and copper–constantan thermocouple psychrometers which were made and calibrated in the Meteorology Department of Wageningen Agricultural University. All sensors were connected to a CR10T data logger and an AM416 multiplexer (Campbell Scientific). The sampling interval was 2 s for all the elements mentioned above except wind speed for which the sampling interval was 10 s. All outputs were averaged hourly.
to unity , similar to that of a real leaf, and also its heat capacity is small, so that thermal equilibration occurs rapidly. The amounts of dew atH, 2/3H, and 1/2Hwere measured by weighing the blotting paper installed be-fore sunset. In February, a circular blotting paper with diameter of 90 mm was used as a substitute leaf for dew formation, with two replicas at each height. In March and April, the same kind of paper was used to collect the dew with five replicas at each height. To avoid the blotting paper being saturated by water, each replica had five pieces of paper pinned together by two paper clips and was installed horizontally, at-tached to an erect bamboo stick. At crop height, care was taken to prevent the blotting paper from touch-ing the rice leaves. However, at 2/3Hand 1/2Hinside the canopy, this could not be prevented. The blotting paper was kept in the field until the next morning and weighed three times during each observation day, i.e. before sunset, before removing the cover, and around sunrise (06:00). The dew amount at each height was calculated from the increase in weight of the blotting paper (installed at that height) divided by the area of the blotting paper. Thus, the unit of the dew amount was kg m−2or millimetre, referring to leaf (or blotting
paper) area. The onset and disappearance of dew was observed visually. After sunset, it was sensed man-ually whether dew had appeared on leaf surfaces or not. In this way, the rice leaves were checked every 15 min until dew was detected. After sunrise, to de-tect drying, the rice leaves were visually checked with the same frequency. The dew duration was calculated as the period between the onset and disappearance of dew, expressed in hours.
2.3. Model
The MICROWEATHER model (Goudriaan, 1977) was used to simulate dew amount and duration. This model is a multilayer model. In this model, the energy and mass balances of a canopy, the partitioning of the absorbed radiation (Rn) into sensible heat (H) and
latent heat (λE) is calculated based on the combination of the following energy balance equations:
Rn−H−λE=0
where Tl and Ta are leaf and air temperatures,
re-spectively, ρcp the volumetric heat capacity of the
air,eS(Tl) andeS(Ta) the saturated vapour pressure at
leaf temperature and air temperature, respectively,ea
the actual vapour pressure,γ the psychrometric con-stant, s the slope of the saturation vapour pressure curve at air temperature, rb,h and, rb,v the boundary
layer resistances to heat and water vapour, respec-tively, and rl,v the leaf resistance to water vapour.
Resistances for these fluxes were computed from the wind profile and microclimatic conditions, following the stomatal-photosynthesis model of Leuning (1995). The profiles of temperature and vapour pressure were found by integration of the net fluxes over time for different canopy and soil layers. The partitioning of the available net radiation at soil surface into sensible heat, latent heat and soil (water in paddy field) heat fluxes was also computed. At night, the leaf resistance is very large, but when the latent heat flux becomes negative, or when dew is present, it is reduced to zero. Dew formation on different layers was then simulated using the following equation (Monteith and Unsworth, 1990):
During the 16 experimental nights, dew never oc-curred in the covered plots before the cover was removed. But the blotting papers installed inside the canopy (at 1/2Hand 2/3H) which were meant to just collect dew also gained weight due to leaf guttation. Inside the canopy, the blotting paper could not be prevented from interception of guttation water. There-fore, the ‘dew’ amount measured inside the canopy was contaminated by guttation, and only the dew data (amount and duration) measured on top leaves of the rice crop were used in the quantitative data analysis.
night was estimated by dividing the weight increment of the blotting paper at the moment of cover removal by the time elapsed since sunset. The total amount of guttation water intercepted by the blotting paper in-side the canopy was calculated as this mean guttation rate multiplied by night length (12 h).
Interception of guttation drops is subject to stochas-tic variability which can be estimated from the obser-vation data themselves. Intercepted water is not the same as the true quantity of guttation, and rather it tends to be an underestimate for the following rea-sons. In the first place, only drops beyond a certain size will get detached and fall. Secondly, the vertically projected area of the blotting paper is what counts, and thirdly only water from the leaf area above the blotting paper will be collected. Only if a leaf physi-cally touches the blotting paper, may it directly deliver water, thereby raising the collected amount.
3. Results and discussion
3.1. Effects of cover removal on formation
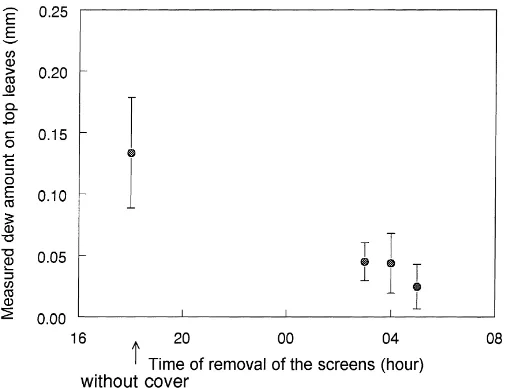
Cutting off nocturnal net radiation loss by shield-ing resulted in a large reduction in dew amount in the rice canopy (Fig. 1) because no dew occurred in the
Fig. 1. Relation between dew amount (mm) at sunrise and the time of removal of the screens. The points are mean values of data measured on top leaves during five, five and six nights, for removal at 03:00, 04:00 and 05:00 h, respectively, and for the control without cover.
canopy during the covered period. The accumulated dew amount on the top leaves at sunrise after 1–3 h exposure to nocturnal radiative loss was less than half that in the control canopy, which had been exposed to 12 h of nocturnal radiative loss. As expected, dew du-ration on the top leaves with cover was much shorter than that without cover (Fig. 2). In Figs. 1 and 2 the error bars refer to the standard error in 150 and 50 data points for uncovered and covered canopies, respectively.
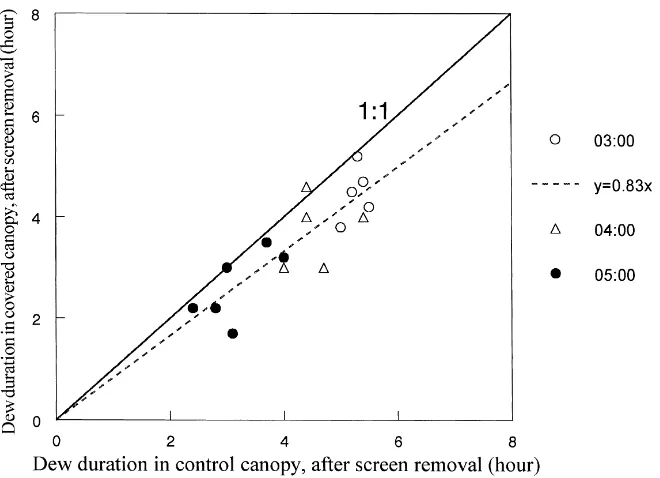
On average, the dew duration on top leaves when temporarily covered was 83% of that without cover, measured from the time the cover was removed (Fig. 3). On top leaves, dew duration after sunrise ranged between 1.4 and 3.4 h, which was reduced by between 0 and 2 h by shielding. Because of the rapid increase of solar radiation after sunrise, the moment of drying was only slightly delayed for leaves that had been exposed all night.
3.2. Simulation of the dew formation
stan-Fig. 2. Relation between daily dew duration (h) and the time of removal of the screens. The points are mean values of data observed on top leaves during five, five and six nights for removal at 03:00, 04:00 and 05:00 h, respectively, and for the control without cover.
Fig. 4. Relation between measured and simulated (a) dew amount and (b) duration on top leaves (control:d, covered:s).
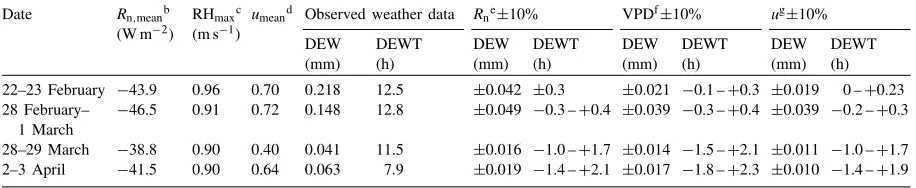
dard errors were 0.033 mm and 2.33 h for dew amount and dew duration, respectively. To investigate the rea-son of these deviations of the simulation results from the observed ones, a sensitivity analysis was made for the effects of net radiative loss, water vapour pressure deficit (VPD) and wind speed as the most relevant weather variables for dew formation. The sensitivity analysis results showed that the model results were sensitive first to the nocturnal net radiative loss, sec-ond to water vapour pressure deficit, and third to wind
Table 2
Sensitivity analysis of the simulation of dew amount (DEW) and duration (DEWT) on top leavesa Date Rn,meanb
(W m−2)
RHmaxc (m s−1)
umeand Observed weather data Rne±10% VPDf±10% ug±10% DEW
(mm)
DEWT (h)
DEW (mm)
DEWT (h)
DEW (mm)
DEWT (h)
DEW (mm)
DEWT (h) 22–23 February −43.9 0.96 0.70 0.218 12.5 ±0.042 ±0.3 ±0.021 −0.1 –+0.3 ±0.019 0 –+0.23 28 February–
1 March
−46.5 0.91 0.72 0.148 12.8 ±0.049 −0.3 –+0.4 ±0.039 −0.3 –+0.4 ±0.039 −0.2 –+0.3 28–29 March −38.8 0.90 0.40 0.041 11.5 ±0.016 −1.0 –+1.7 ±0.014 −1.5 –+2.1 ±0.011 −1.0 –+1.7 2–3 April −41.5 0.90 0.64 0.063 7.9 ±0.019 −1.4 –+2.1 ±0.017 −1.8 –+2.3 ±0.010 −1.4 –+1.9
aThe amounts are on leaf area basis. bR
n,mean is the nightly mean net radiative loss. cRHmax is the daily maximum relative humidity. du
mean is the wind speed. eR
n is the net radiative loss. fVPD is water vapour pressure deficit. guis the wind speed.
to the three weather variables under clear and wet conditions whereas its sensitivity to the three weather variables greatly increased under dry and very quiet (28–29 March and 2–3 April) conditions. The dew duration estimation error caused by 10% of measure-ment error in net radiative loss and VPD could be over 2 h under clear, dry and very quiet conditions.
There was a slight tendency for the simulation to underestimate dew amount and duration (Fig. 4), prob-ably because of a measurement error in nocturnal net radiative loss. When dew forms on the dome of the net radiometer, some of the radiation seen by the sensor will come from the dew rather than from the sky above. Since dew is always at a higher temperature than the sky under clear conditions, the measured nocturnal net radiative loss is always less negative than the real value. According to a study of Halldin and Lindroth (1992), the radiometer type used in our experiment un-derestimated the nocturnal net radiative loss by about 30 W m−2in Ostby, Sweden. In the course of the night,
the measured net radiative loss tended to become less strong. Part of this reduction may have been caused by dew formed on the radiometer dome. This portion should not exceed the difference (1Rn) between the maximum nocturnal net radiative loss (usually before dew occurred) and that at the time of the nightly mini-mum temperature. According to our observations, this
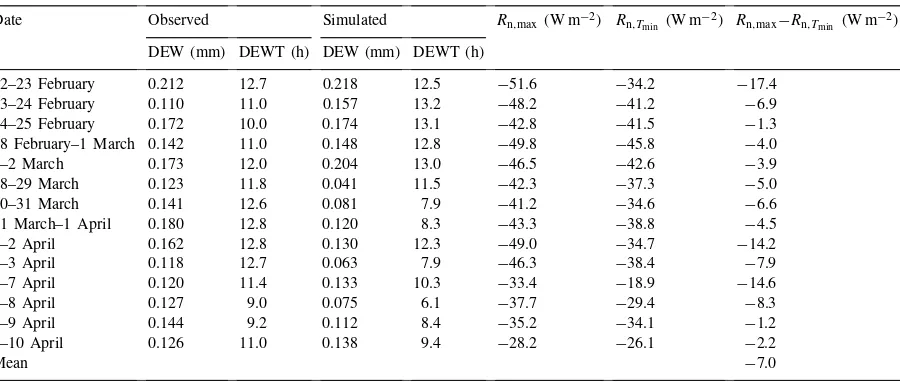
Table 3
Dew amount and duration,Rn,max just before dew occurred,Rn,Tmin at the moment of minimum temperature and their difference a
aAll values refer to heavy dew nights.
latter value ranged between 0 and 18 W m−2 with a
mean value of 7 W m−2during the heavy dew nights
as is shown in Table 3. According to the model sen-sitivity analysis, a measurement error of 7 W m−2 in
net radiative loss can cause a dew amount estimation error of about 0.07 mm per night under clear and dry conditions. Therefore, the measurement error of noc-turnal net radiative loss caused by dew formation on the radiometer dome, although it was not as large as that in Sweden, could well have been a reason for the deviation of the simulated results from the observa-tions, together with errors in other relevant weather variables, such as VPD and wind speed.
3.3. Effects of nocturnal net radiative loss, water vapour pressure deficit and wind speed on dew formation
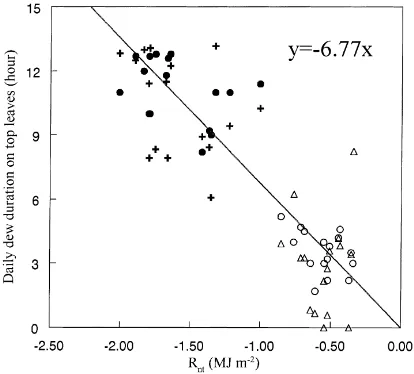
To see the direct effect of nocturnal net radiative loss on both dew amount and duration, the total noc-turnal net radiation loss (Rnt) was calculated based on
Fig. 5. (a) Relation between daily dew amount, both observed (control:d, covered:s) and simulated (control:+, covered:△), for top leaves and total nocturnal net radiative loss (Rnt, MJ m−2) (observed:r2=0.66, S.E.=0.033 mm; simulated:r2=0.54, S.E.=0.046 mm). (b) Similar, but for the effective total nocturnal net radiative lossRnt,effective(observed:r2=0.84, S.E.=0.022 mm; simulated:r2=0.64, S.E.=0.040 mm).
shows that at crop height, the condensation energy (2.5×10⁶J m−2mm−1) in dew formation had, on
average, balanced about 20% of the nocturnal net ra-diative loss. The additional negative effect of vapour pressure deficit in this relation will be investigated below. Compared to the relations between Rnt and the observed results for the top leaves, the relations
Fig. 6. Relation between daily dew duration both observed (con-trol:d, covered:s) and simulated (control:+, covered:△) on top leaves and the total nocturnal net radiative loss (Rnt, MJ m−2) (ob-served:r2=0.86, S.E.=1.55 h; simulated:r2=0.72, S.E.=2.48 h).
betweenRnt and simulated results show more scatter
(Fig. 5a and Fig. 6).
To assess the direct effect of vapour pressure deficit and wind speed on dew formation, total night VPD (R
Ddt), mean night VPD (Dmean), nightly minimum VPD (Dmin) and nightly mean wind speed (unight) were calculated based on the hourly observed data. The ex-posed fraction of the nightf, calculated as the ratio of the exposed period to night length (from 1800 to 600 equals 12 h), was taken into account when calculating the VPDs because no dew occurred under the covered canopy during the screened period. The value offwas 0.25, 0.167 and 0.083 for the time of removal at 03:00, 04:00 and 05:00, respectively. According to both the experimental data and the simulation results however, there was only a weak direct relation betweenfRDdt
orf Dmeanor f Dmin or unight and dew amount or
du-ration. But when VPD and unight were added to the
regression with the nocturnal net radiative loss, a con-siderable improvement was found for the relation of observed and simulated dew amount (Y) on top leaves toRntandfDminandunight (Fig. 5b). The multi-linear
regression expression for dew amount was:
Y =aRnt+bf Dmin+cunight (2)
Rnt,corr =Rnt+ b
a
fDmin+ c
a
unight (3)
Therefore,
Y =aRnt,corr
Based on the observed and simulated results, the val-ues ofb/aandc/awere determined as 2.0 kJ m−2Pa−1
and 0.2 MJ m−3s when R
nt is in MJ m−2, VPD in
kPa and unight in m s−1 as shown in Fig. 5b. Com-pared to Eq. (1), the value ofb/a in Eq. (3) must be (ρcp/(sra))1tfor dew amount whenRntinstead ofRn
is used. In this study, 1t is exposed period in hour. Takingsas 0.2 kPa K−1andr
a as 50 s m−1, the
aver-age value of (ρcp/(sra))1tis about 2.2, which is the
same order of magnitude as observed (2.0).
The relation between simulated dew amount and Rnt,corr (r2=0.64, S.E.=0.040 mm) shows more
scat-ter than that between the observed dew amount and Rnt,corr (r2=0.84, S.E.=0.023 mm) (Fig. 5b). The
latter relation appears to be even better than the one between the simulated and the observed dew amount (Fig. 4) (r2=0.80, S.E.=0.033 mm). The above re-sults further confirmed that measurement errors in net radiative loss, VPD and wind speed may be the main causes of the scatter of the simulation results from the observed results.
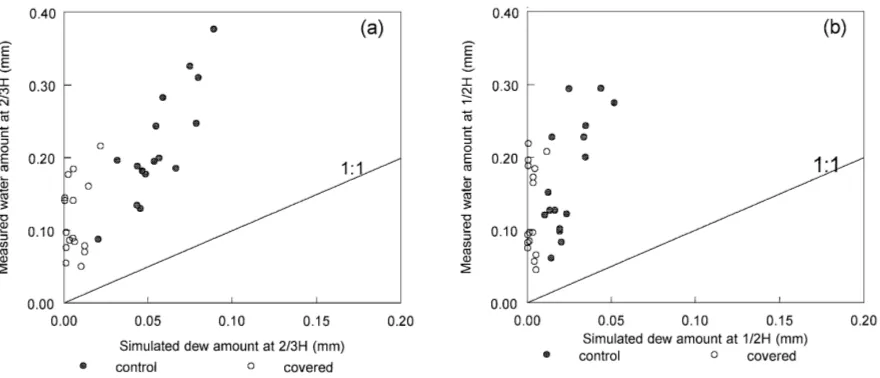
Fig. 8. Relation between measured and simulated dew amount at (a) 2/3H(crop height) and (b) 1/2H. The closed dots refer to the control canopy and the open dots to the covered canopy.
Fig. 7. Seasonal course of nightly total guttation amount (mm per night per leaf area).
3.4. Guttation
measured on top leaves (0.212 mm) during the experi-mental period. These results indicate that guttation, as one of the crop surface wetness contributors, can sup-ply as much water to the rice crop surface as dew. For short grass, Hughes and Brimblecombe (1994) also found that guttation was of the same importance as dewfall.
In the paddy rice canopy, the difference between guttation and dewdrops was easily visible because gut-tation drops were much bigger than dew drops. They were suspended along the leaf edge whereas dewdrops were distributed homogeneously on both sides of the leaf surface. Guttation does not contribute to the leaf wetness at the top of the canopy. Inside the canopy however, it might contribute to the leaf wetness in the same way as precipitation does, i.e. the lower layer of the canopy could intercept the guttation drops. This was proved by the fact that the water amount col-lected by the blotting paper at both 1/2H and 2/3H was much more than the dew amount simulated at these two heights (Fig. 8). Therefore, the contribution of guttation to leaf wetness in paddy rice crops cannot be ignored. Unfortunately, only sophisticated methods such as measuring the isotopic oxygen ratio in water can distinguish guttation water from dew. Our shield-ing experiment was not designed in this way. Yet, it provided a feasible method for allowing an estima-tion of guttaestima-tion water amount intercepted by different layers inside the rice canopy.
4. Conclusions
In the dry season in the tropics, dew duration after sunrise gives only a small contribution to total dew duration on the top leaves of the rice crops.
The scatter of the simulated dew formation from the observed results was mainly caused by the measure-ment errors in relevant weather variables, especially net radiative loss and water vapour pressure deficit.
The measurement error in net radiative loss caused by dew formation on the dome of the radiometer was typically about 7 W m−2with 18 W m−2as an extreme value during a heavy dew night.
At the top of the rice canopy, the energy used for condensation was about 20% of the net radiative loss at that level.
Dew amount was more dependent on the nightly minimum value of vapour pressure deficit than on its mean value.
The contribution of guttation to leaf wetness in paddy rice crops was similar in magnitude to dew.
As an experimental spin-off, the method of shield-ing nocturnal net radiative loss was not only helpful for understanding its immediate effect on dew for-mation, but also provided a feasible method to mea-sure the guttation water intercepted by different layers inside the rice canopy.
Acknowledgements
This study was funded by the ‘Simulation and Sys-tem Analysis for Rice Production’ (SARP) project which is financed by the Netherlands’ Ministry for Development Cooperation. We thank Drs. H.F.M. ten Berge, M.J. Kropff and M.C.S. Wopereis for their support in establishing the field experiment and stimulating discussion, Mr. B.G. Heusinkveld, Mr. D. Welgraven and Mr. R.T. Dierkx for their help in preparing experimental instruments, Dr. A.F.G. Jacobs and the two anonymous reviewers and Dr. J.B. Stewart, regional editor of Agr. For. Meteorol. for their critical reading the manuscript, and Mr. M. Calibo, Mr. L. Tatad and Mr. T. Delgado for their assistance in doing the field experiment.
References
Goudriaan, J., 1977. Crop micrometeorology: a simulation study. Simulation Monographs, Pudoc, Wageningen.
Halldin, S., Lindroth, A., 1992. Errors in net radiometry: comparison and evaluation of six radiometer designs. J. Atm. Oceanic Tech. 9 (6), 762–783.
Horino, O., 1992. Climatic factors affecting rice blast outbreak and its chemical control in Nile Delta, Egypt. Japan Pesticide Information, No. 60, pp. 32–37.
Hughes, R.N., Brimblecombe, P., 1994. Dew and guttation: formation and environmental significance. Agric. For. Meteorol. 67, 173–190.
Jacobs, A.F.G., van Pul, W.A.J., van Dijken, A., 1990. Similarity moisture dew profiles within a corn canopy. J. Appl. Meteorol. 29, 1300–1306.
Janssen, L.H.J.M., Romer, F.G., 1991. The frequency and duration of dew occurrence over a year. Tellus 43B, 408–419. Kim, C.K., Kim, C.H., 1991. Predicting rice blast outbreaks in
Leuning, R., 1995. A critical appraisal of a combined stomatal-photosynthesis model for C3 plants. Plant Cell Environ. 18, 339–356.
Manibhushanrao, K., Krishan, P., 1991. Epidemiology of blast (EPIBLA): a simulation model and forecasting system for tropical rice in India. Rice blast modelling and forecasting. IRRI, Manila, Philippines, pp. 31–38.
Monteith, J.L., Unsworth, M.H., 1990. Principles of environmental physics, 2nd Edition. Edward Arnold, London, 291 pp. Pedro, M.J., Gillespie, T.J., 1982a. Estimating dew duration. I.
Utilizing micrometeorological data. Agric. Meteorol. 25, 283– 296.
Pedro, M.J., Gillespie, T.J., 1982b. Estimating dew duration. II. Utilizing standard weather station data. Agric. Meteorol. 25, 297–310.
Scherm, H., van Bruggen, A.H.C., 1993. Sensitivity of simulated dew duration to meteorological variations in different cli-matic regions of California. Agric. For. Meteorol. 66, 229– 245.
Uehara, Y., Imoto, M., Sakai, Y., 1988. Study on the forecasting of the rice blast development using the weather data from AMeDAS. Bulletin of the Hiroshima Prefectural Agricultural Experiment Station, No. 51, pp. 1–15.
Wallin, J.R., 1963. Dew, its significance and measurement in phytopathology. Phytopathology 53, 1210–1216.
Wilson, T.B., Bland, W.L., Norman, J.M., 1999. Measurement and simulation of dew accumulation and drying in a potato canopy. Agric. For. Meteorol. 93, 111–119.