AN OBJECT-BASED METHOD FOR CHINESE LANDFORM TYPES CLASSIFICATION
DING Hua, c, TAO Feib, ZHAO Wufana, c, NA Jiaminga, c, TANG Guo’ana, c
a Key Laboratory of Virtual Geographic Environment of Ministry of Education, Nanjing Normal University, No.1 Wenyuan Road, Nanjing, 210023, China - [email protected]; [email protected]; [email protected]; [email protected]
b School of Geography Science, Nantong University, Nantong, 226019, China - [email protected];
c Jiangsu Center for Collaborative Innovation in Geographical Information Resource Development and Application, No.1 Wenyuan Road, Nanjing, 210023, China
Commission Ⅶ, WG Ⅶ/4
KEY WORDS: Landform Classification, DEM, Object-based, Random Forest, Gray-level Co-occurrence Matrix
ABSTRACT:
Landform classification is a necessary task for various fields of landscape and regional planning, for example for landscape evaluation, erosion studies, hazard prediction, et al. This study proposes an improved object-based classification for Chinese landform types using the factor importance analysis of random forest and the gray-level co-occurrence matrix (GLCM). In this research, based on 1km DEM of China, the combination of the terrain factors extracted from DEM are selected by correlation analysis and Sheffield's entropy method. Random forest classification tree is applied to evaluate the importance of the terrain factors, which are used as multi-scale segmentation thresholds. Then the GLCM is conducted for the knowledge base of classification. The classification result was checked by using the 1:4,000,000 Chinese Geomorphological Map as reference. And the overall classification accuracy of the proposed method is 5.7% higher than ISODATA unsupervised classification, and 15.7% higher than the traditional object-based classification method.
1. INTRODUCTION
Landform is one of the most important elements in physical environment (Shen et al., 1982). Landforms classification is the basis of digital terrain analysis which provides evidences for researches of geomorphology mapping and landform distribution, and thus has a great value in production practices and scientific researches (Li et al., 2013; Gao, 2004; Zhou and Liu, 2008; Gerçek et al., 2011).
Object-based image analysis (OBIA) has become a widely spread concept for many landforms classification studies based on DEM recent years (Drăguţ and Eisank, 2012; Whiteside and Ahmad, 2005; Manakos et al., 2000; Blaschke, 2010; Van Niekerk, 2010). Objects obtained by image segmentation are considered to be analysis units. Also, compared to pixel-based classification, this approach can avoid the salt and pepper noise and improve the execution efficiency by utilizing feature geometry and structural information (Manakos et al., 2000; Blaschke, 2010). In addition, Object-oriented multi-scale segmentation is sensitive to the discontinuity of DEM forms, hence the image can be segmented by maximizing ground features’ internal homogeneities and minimizing heterogeneities between the entities.
Lucian Drăguţ (Drăguţ and Blaschke, 2006) presents an automated object-based classification method for landform elements which is reproducible and transferable. Test area has been classified into nine classes by using flexible fuzzy membership functions constructed by elevation, profile curvature, plan curvature and slope gradient. By comparison experiment on high resolution remote sensing images of test areas, Soe W. Myint (Myint et al., 2011) suggests that the accuracy of object-based classification method is 22.8% higher than that of pixel-based maximum likelihood classification method. Lucian Drăguţ and Clemens Eisank (Drăguţ and Eisank, 2012) classified 1km global SRTM DEM into eight topographic classes automatically using an OBIA approach by setting the
threshold with average elevation and elevation standard deviation. Results resemble reasonably patterns of existing global and regional classifications. Based on the object-based strategy, Ciaran Robb (Robb et al., 2015) classified the glacial landforms by using LIDAR data which achieves an overall accuracy of 77% and Rajesh B.V.Shruthi (Benz et al., 2004)
proved the object-based analysis method has advantages in studies of gully erosion comparing to traditional approaches. However, previous studies have shown that the accuracy of current object-based landforms classification is still relatively low. Moreover, subjectivity exists in determining the threshold of multi-scale segmentation algorithm. In sum, based on the 1:10 00000 DEM of China, this paper aims to explore an improved method for automatic object-based landforms classification which will help deepen the comprehension of geomorphology characters and spatial heterogeneity rules of China from a macroscopic and quantitative view.
2. TEST DATA
1:1000000 DEM data used in this study was produced by National Geographic Information Centre which is a 1×1
kilometre grid resolution ground elevation digital matrix constructed by reading the elevation of square rid’s intersections precisely according to a grid interval of 28.125″
(Longitude difference)×18.750″(Latitude difference) based
on the Chinese 1:50000 and 1:100000 topographic map (Song, 2006).
This data has a high sampling accuracy and can reflect the terrain relief of China primely (Liu and Tang, 2012).
Figure 1. 1:1,000,000 DEM of China
Figure 2. The landform type map of China (1:4,000,000)
3. METHODOLOGY
3.1 Overview of the method
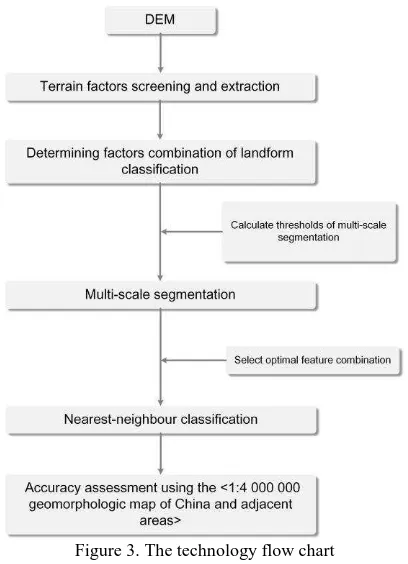
Firstly, relief amplitude, surface roughness, elevation, elevation variation coefficient, slope of slope, hillshade and composite curvature were filtered and extracted as the factor combination of landform classification. Then multi-scale segmentation was proceeded on the combined image based on the threshold of factor importance calculated by random forest classifier. Next, the experiment selected Gray-level co-occurrence matrix (GLCM) to construct classificatory knowledge base and automatic landform classification was implemented by using nearest-neighbour classification method. Finally, accuracy assessment was completed referring to the 1:4 000 000 geomorphologic map of China and adjacent areas. The technology flow chart was as followed:
Figure 3. The technology flow chart
3.2 Determination of landform classification factors
Terrain factors extracted from DEM are the most effective tools to describe landform quantitatively and the combination of a variety of terrain factors can reflect the morphological characteristics of landscape entities comprehensively (Tang, 2014; Wang et al., 2012). To depict the regional landform features of China, elevation, relief amplitude, surface roughness, surface incision and elevation variation coefficient as macro topographic factors, and slope, slope of slope and composite curvature as micro topographic factors are selected firstly. In addition, hillshade image which produces terrain surface shading effect thus provides a visual enhancement of the terrain undulation was also selected to classify the landform.
Different terrain factors describe morphological features and spatial features of the landforms from different angles. However, due to the high correlation between factors, information redundancy caused by high-dimensional characteristic factors will emerge. So it is necessary to filter terrain factor combination with weak correlation to classify landforms. In order to avoid the influence of different dimensions, all of the terrain factors should be normalized to make their values fall between the ranges of 0-255. Correlation of nine terrain factors are shown in Table 1.
Terrain
Factors S SI RA SR E EVC SOS H CC
S 1.00 SI 0.94 1.00 RA 0.96 0.97 1.00 SR 0.40 0.49 0.49 1.00
E 0.37 0.40 0.39 0.23 1.00 EVC 0.11 0.07 0.11 0.05
-0.33 1.00 SOS 0.72 0.72 0.75 0.44 0.34 0.10 1.00
H -0.16 -0.15 -0.16 -0.06 -0.05 -0.02
-0.10 1.00 CC 0.05 0.08 0.03 -0.04 0.02 -0.02 0.02 -0.01 1.00
Table 1. Correlation coefficients matrix
SR=surface roughness, E=elevation, EVC=elevation variation coefficient, SOS=slope of slope, H=hillshade, CC=composite curvature)
From Table 1, high correlation exists among slope, relief amplitude and surface incision. Gauche entropy method was used to filter these three factors which are processed as formula (1).
1 ln(2 ) ln
2 2 2 S
n n
S n M
(1)
Where S is entropy of the n-dimensional data subset, n is the
dimension, MS is the covariance matrix’s row value of
n-dimensional data subset. The higher the value is, the larger entropy of the image is and thus are more beneficial for image classification. The entropy values are 26.89, 26.86, 27.20, respectively which means the combination with relief amplitude has the maximum entropy value. Therefore, relief amplitude, surface roughness, elevation, elevation variation coefficient, slope of slope, hillshade and composite curvature were determined as the best factor combination.
3.3 Calculation of factors importance
Seven terrain factors were selected to classify the landform types and each factor was considered as single layer to composite a 7-band image. However, each factor has different ability to characterize and classify different landforms, accordingly, important factors should be given a higher weight. This study proposes a method which thresholds of multiscale segmentation layer were determined based on variable importance measurement provided by random forest classifier. The Random Forest is a general tern for ensemble methods using tree-type classifiers {h(x, Θk), k=1, …} where the {Θk}
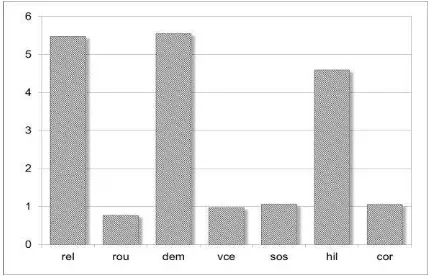
are independent identically distributed random vectors. For classification, each tree and x is an input pattern. The output of the classifier is determined by a majority vote of multiple CART-like trees (Breiman, 2001). The trees are created by drawing a subset of training samples through replacement (a bagging approach). And the variable importance estimate was carried out based on the error estimate which is known as the out-of-bag (OOB) error. In sum, variable importance is estimated by measuring the growth of RF classification error before and after replacing the factor to a random noise (Lei, 2012; Song, 2012). The importance of every terrain factor is shown in Figure 4.
Figure 4. Each terrain factor importance measure
Those values are rounded and then set to be the multiscale segmentation threshold for each layer. Segmentation threshold was set as 90 after repeated experiments.
3.4 Object-based classification base on GLCM
In this paper, we use the nearest neighbour classifier to make classification of landform types. Seven landforms- plain, hill, low mountain, low-mid mountain, high-mid mountain, high mountain and extreme high mountain were inserted into class hierarchy respectively. Each landform select GLCM texture to build the classification feature space, samples were selected as well.
DEM, as an analogue digital terrain surface, is naturally a space field model. Due to the interpolation technique, high spatial autocorrelation exists among the elevation of DEM raster. Based on the probability density function which estimates second order combination conditions, GLCM model describes the occurrence probability of a pair of pixel with gray value of i and j which locates on the θ direction and with the distance of d. Spatial relationship between pixels described by spatial distance, angle and other parameters were introduced into the texture analysis model to reveal image texture features. Spatial autocorrelation between pixels can be taken into considerations by this model thus it is a feasible approach to use this model to make the texture analysis of the DEM (Liu et al., 2013; Liu and Kuang, 2009). To take full advantage of the directivity of GLCM, eight factors- Homogeneity, Contrast, Dissimilarity, Entropy, Ang. 2nd moment, Mean, Std Deviation and Correlation in four directions for seven terrain factors layers were selected to build the feature space and then the samples were extracted. During the first classification processing, it is suitable to choose fewer samples. As it is shown in Figure 5, the number of three plain area’s sample objects is relatively small due to their large area and complete patches. On the contrast, the number is larger in high mountain and extreme high mountain which locates near the Hengduan Mountains and Himalaya mountains because of their broken patches.
Based on the strategy of feature space optimization (FSO), Euclidean distance between samples used for classification in feature space was calculated and the feature combination which has the optimal inter-distance was selected as the optimal classification feature combination (Laliberte et al., 2012). The inter-distance of different feature space in different dimension is shown in Figure 5. As it is shown in Figure 7, the maximum inter-distance, with the value of 0.176, occurs when the dimension is 9. In this case, nine features- Entropy, Homogeneity and Contrast of hillshade, slope of slope Correlation, Correlation and Entropy of surface roughness, Entropy and Homogeneity of relief amplitude and Correlation of elevation variation coefficient were filtered as the optimal feature space combination.
Figure 5. The separation distance map of the feature combination dimension
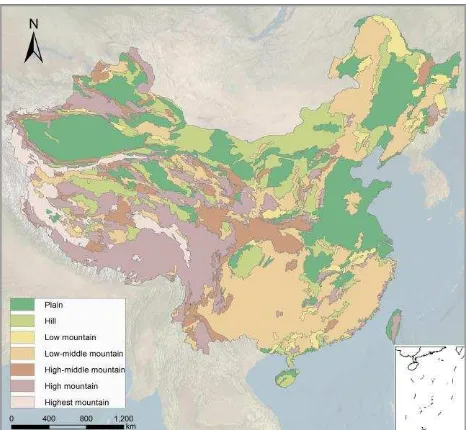
four times’ iteration. The result is shown in Figure 6.
Figure 6. Result of China landform classification
4. RESULT
4.1 Classification accuracy assessment
Accuracy assessment was carried out by comparing the confusion matrix conducted by all the 8569210 pixels of classification results with the corresponding portions of basic landforms region in 1:4 000 000 geomorphologic map of China (apart from the Loess Plateau region and the desert area). Test results are shown in Table 2.
Types
Table 2. Accuracy evaluation of classification result
Table 2 shows that low-mid mountain has the highest user accuracy (84.1%) while low mountain has the lowest user accuracy (47.7%). That means the classification result of low-mid mountain is most reliable, though low mountain result is least reliable. For cartography accuracy, plain presents best accuracy (83.7%) while low mountain has the worst accuracy (50.2%), which suggests landform feature of plain is clear. However low mountain landforms are not obvious, and actually it is easy to be confused with middle mountain such as low-mid mountain and hill. The overall classification accuracy reaching to 71.4% and Kappa coefficient is 0.67 which suggests the classification completes well with a high accuracy.
4.2 Overall accuracy assessment
In addition, the classification accuracies of method in this study were compared to results obtained by ISODATA unsupervised classification method (Shruthi et al., 2015) and common object-based classification mentioned in article (Wang et al., 2012). The results are presented in Table 3.
Methods Overall accuracy (%) Kappa coefficient Method of this article 71.4 0.67
ISODATA 65.7 0.57
Common object-based
classification 55.7 0.50
Table 3. Comparison of Classification accuracy
As results shown in Table 3, accuracy of the method put forward in this study is 5.7% higher than that of ISODATA unsupervised classification, and 15.7% higher than the common one, which means that this approach has obvious advantages in classification.
Further, this study selected an area locates in Chinese southwest region with complex landform features (Test area is shown in Figure 9) to test the applicability of this approach to different DEM resources. SRTM (Shuttle Radar Topography Mission) with the resolution of 90m was selected as data resource, and it was resampled into 500m and 1000m resolution DEM. Landforms of the test area was classified and accuracy was shown in Table 4.
Data source Overall accuracy (%) Kappa coefficient 90m SRTM DEM 95.7% 0.93
Table 4. Classification accuracy comparison of different DEM formation and resolution
The table shows that, classification based on 90m resolution STRM has the highest accuracy and Kappa coefficient, and the accuracy declines as the resolution reduces.
Moreover, classification accuracy based on the 1000m resolution SRTM is higher than that based on the same resolution DEM produced by China National Geographic Information Centre. However, due to its large data quantity, 90m resolution SRTM has a considerable time-consuming in accomplishing the multi-scale segmentation and texture-based landform classification, thus future research will focus on optimizing the classification method to fix this difficulty.
5. CONCLUSION AND FUTURE DEVELOPMENT
compared to the common object-based classification method, method in this study has obvious advantages in classification accuracy.
However, the process of determining the segmentation scale requires multiple tests which leads to low efficiency. Thus, further research should be emphasize on how to determine the segmentation scale adaptively according to different terrain factors combinations and whether this approach is suitable for micro-landform extraction and classification.
ACKNOWLEDGEMENT
We are grateful for the financial support from the National Natural Science Foundation of China (Grant No. 41471316). A Project Funded by the Priority Academic Program Development of Jiangsu Higher Education Institutions (No.164320H116).
REFERENCES
Benz, U.C., Hofmann, P., Willhauck, G., Lingenfelder, I., and Heynen, M., 2004: Multi-resolution, object-oriented fuzzy analysis of remote sensing data for GIS-ready information. ISPRS Journal of Photogrammetry and Remote Sensing, 58, 239-258.
Blaschke, T., 2010: Object based image analysis for remote sensing. ISPRS Journal of Photogrammetry and Remote Sensing, 65, 2-16.
Breiman, L., 2001: Random forests. Machine learning, 45, 5-32.
Drăguţ, L., and Blaschke, T., 2006: Automated classification of landform elements using object-based image analysis. Geomorphology, 81, 330-344.
Drăguţ, L., and Eisank, C., 2012: Automated object-based classification of topography from SRTM data. Geomorphology, 141, 21-33.
Gao, X., 2004: The Subjective and Objective Classification of Geomorphologic Forms. Journal of Mountain Science, 22, 261-266.
Gerçek, D., Toprak, V., and Strobl, J., 2011: Object-based classification of landforms based on their local geometry and geomorphometric context. International Journal of Geographical Information Science, 25, 1011-1023.
Laliberte, A.S., Browning, D., andRango, A., 2012: A comparison of three feature selection methods for object-based classification of sub-decimeter resolution UltraCam-L imagery. International Journal of Applied Earth Observation and Geoinformation, 15, 70-78.
Lei, Z., 2012: Random Forest and its Applicantion in Remote Sensing. Shanghai Jiao Tong University.
Li, B., Pan, B., Cheng, W., Han, J., Qi, D., and Zhu, C., 2013: Research on Geomorphological Regionalization of China. Acta Geographica Sinica, 68, 291-306.
Liu, A., and Tang, G., 2012: DEM Based Auto-classification of Chinese Landform. Geo-information Science, 8, 8-14, 15.
Liu, K., Tang, G.A., Tao, Y., and Jiang, S., 2013: GLCM Based Quantitative Analysis of Terrain Texture from DEMs. Journal of Geo-information science, 14, 751-760.
Liu, L., and Kuang, G.Y., 2009: Overview of image textural feature extraction methods. Journal of Image and Graphics, 14, 622-635.
Manakos, I., Schneider, T., and Ammer, U., 2000: A comparison between the ISODATA and the eCognition classification methods on basis of field data. IAPRS, 33, 133-139.
Myint, S.W., Gober, P., Brazel, A., Grossman-Clarke, S., and Weng, Q., 2011: Per-pixel vs. object-based classification of urban land cover extraction using high spatial resolution imagery. Remote sensing of environment, 115, 1145-1161.
Robb, C., Willis, I., Arnold, N., and Guðmundsson, S., 2015: A semi-automated method for mapping glacial geomorphology tested at Breiðamerkurjökull, Iceland. Remote sensing of environment, 163, 80-90.
Shen, Y., Su, S., and Yin, Z., 1982: Retrospect and Prospect of the Research Work on the Classification, Regionalization and Mapping of the Geomorphology of China. Scientia Geographica Sinica, 2, 97-105.
Shruthi, R.B., Kerle, N., Jetten, V., Abdellah, L., and Machmach, I., 2015: Quantifying temporal changes in gully erosion areas with object oriented analysis. Catena, 128, 262-277.
Song, J., 2006: Research on Automated Relief Form Types Classification of China Based on DEM. Northwest University.
Song, L., 2012: Research on classifier ensemble based on decision tree. Xidian University.
Tang, G., 2014: Progress of DEM and Digital Terrain Analysis in China. Acta Geographica Sinica, 69, 1305-1325.
Van Niekerk, A., 2010: A comparison of land unit delineation techniques for land evaluation in the Western Cape, South Africa. Land Use Policy, 27, 937-945.
Wang, Y.Q., Li, Y., and Liu, A.L., 2012: Object-oriented Method based Research on Classification of Relief Form in China. Remote Sensing Information, 1, 13-18.
Whiteside, T., and Ahmad, W., 2005: A comparison of object-oriented and pixel-based classification methods for mapping land cover in northern Australia. Proceedings of SSC2005 Spatial intelligence, innovation and praxis: The national biennial Conference of the Spatial Sciences Institute. 1225-1231.