AUTOMATION OF MORPHOMETRIC MEASUREMENTS FOR PLANETARY
SURFACE ANALYSIS AND CARTOGRAPHY
A.A. Kokhanova, A.Y. Bystrova, M.A. Kreslavskya,b, E.V. Matveeva, I.P. Karachevtsevaa
a
Moscow state university of geodesy and cartography, MIIGAiK Extraterrestrial laboratory (MExLab) 105064. Gorokhovsky per., Moscow, Russia - [email protected]
b
University of California - Santa Cruz, 1156 High Street, Santa Cruz, CA, 95064, USA
Commission IV, WG IV/8
KEY WORDS: Planetary cartography, GIS tools, spatial analysis, roughness, craters morphometry.
ABSTRACT:
For automation of measurements of morphometric parameters of surface relief various tools were developed and integrated into GIS. We have created a tool, which calculates statistical characteristics of the surface: interquartile range of heights, and slopes, as well as second derivatives of height fields as measures of topographic roughness. Other tools were created for morphological studies of craters. One of them allows automatic placing of topographic profiles through the geometric center of a crater. Another tool was developed for calculation of small crater depths and shape estimation, using C++ programming language. Additionally, we have prepared tool for calculating volumes of relief features from DTM rasters. The created software modules and models will be available in a new developed web-GIS system, operating in distributed cloud environment.
1. INTRODUCTION
A large volume of heterogeneous data of the planetary surface as a whole and its individual forms of relief in particular leads to the need to automate both routine processes and new developed methods of calculating the different characteristics of the studied objects. Here we present GIS tools which we developed for morphometric analysis of the surfaces of terrestrial planets and their satellites.
2. DEVELOPED TOOLS
2.1. Roughness estimation
Digital Elevation Models (DEMs) contain more information than could be visualised by hypsometric maps. The statistical analysis of surface relief allows unbiased identification and characterizing of different geological provinces, a key to the understanding of their origins. Roughness is one important statistical surface characteristic, which shows the relative height variation within an area of interest.
There are at least 13 ways of roughness calculation (Terrain Roughness – 13 Ways, 2016), but no one is universal. Use of these methods depends on analysis purposes and original data. For estimation of topographic roughness using DEMs, obtained with photogrammetric way, we have developed methods, which we realised in a special tool. We calculate roughness as interquartile range of the second derivative of heights field. In general terms, the second derivative of the field of heights – is Hessian matrix, a symmetric matrix of dimension 2×2, composed of the second partial derivatives. This matrix has two invariants: determinant and its trace. The trace of Hessian matrix - a Laplacian of heights field. The Laplacian filter is a linear, whereas the Hessian determinant of the matrix is non-linear.
The tool is written in Python (Python 3.5.1. Documentation, 2016) integrated into ArcGIS Desktop 10.2 (ArcGIS for Desktop, 2015). Users can define the radius and amount of shift
of the filtering mask. Such type of statistical relief analysis shows stable results for typical surfaces, and excludes not typical local objects. Results of such surface characterisation could be used for estimation of safety of potential landing sites (Kokhanov et al., 2014). For example, created map roughness could be used in overlay analysis for elaboration of plain areas within selected potential landing site in the aggregate with data about factors of scientific interest and factors of safety spreading.
2.2. Small crater analysis
Quantitative estimates of the parameters of small impact craters and their statistical analysis is a high-potential method for investigating various processes on the Moon that became of interest with availability of new topographic data from the LRO spacecraft.
Studies of groups of small craters in GIS are conducted by supplementing electronic catalogues of craters by morphological characteristics, obtained from the DEM. A special software module, that can be used independently or as an ArcGIS tool was developed with C programming language (C – Approved standards, 2016). For each of the craters, it calculates the ratio of the crater’s depth d to its diameter D and a parameter characterizing the shape of the inner part of the crater. The module is adapted for catalogs, compiled with the CraterTools (Kneissl et al., 2011).
This software module performs the following calculations:
- A general slope of the surface in the crater’s vicinity is removed. Within the ring of 2.2D and 1.9D (D: diameter of the crater) the altitudes are approximated by an inclined plane which is fitted using least-squares methods. This plane is considered as the surface where the crater is formed, and all the altitudes are subsequently calculated relative to this plane.
- The position of the crater’s center is refined with an accuracy of 1 pixel.
The International Archives of the Photogrammetry, Remote Sensing and Spatial Information Sciences, Volume XLI-B4, 2016 XXIII ISPRS Congress, 12–19 July 2016, Prague, Czech Republic
This contribution has been peer-reviewed.
- The crater’s depth d is estimated by the mean altitude of the four pixels nearest to the corrected center. Here the crater’s depth is calculated relative to the surface surrounding the crater. This differs from the traditionally used estimate of the depth relative to the crater’s rim. Such definition of the steepness is correct for small craters that are often lacking a pronounced rim.
- The shape of the inner part of the crater is defined as a function of the crater’s depth, distance to its center, and the radius of the bowl-shaped part. The numerical parameter, that defines shape, is computed by least-squares techniques from the values of altitudes from the DEM inside a small circle (radius = 0.25 of the crater’s diameter) around the corrected crater centres.
The calculated values are used for analysis of crater degradation and properties of the upper surface layer. Implementations of this tool in research (Kokhanov et al., 2015) shows, that small relatively fresh craters in the lunar polar areas have a significantly lower depth-to-diameter ratio than their counterparts in typical non-polar highlands. Also this tool could be used for the other solid celestial bodies. Measuring depth of several flat-floored craters on Mercury in (Zharkova et al., 2015) indicates a thick regolith layer on this planet.
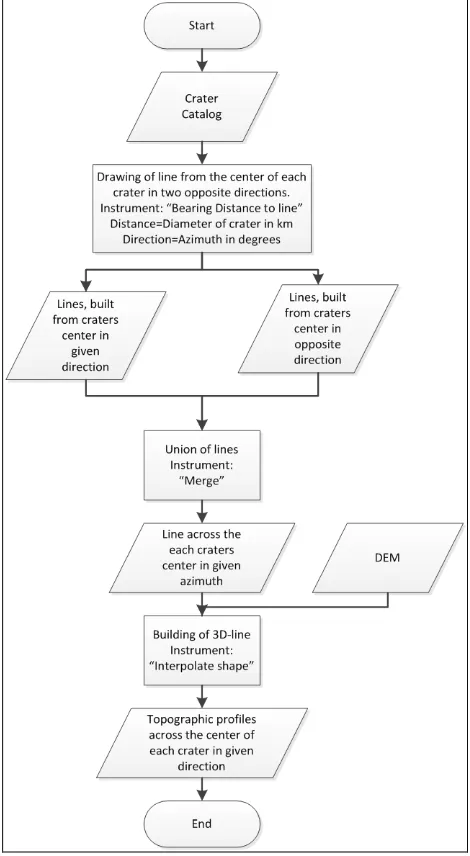
Another tool for crater studies is written in Python
programming language for consistent use of ArcGIS tools (fig. 1). This tool allows users to build topographic profiles across the geometric centres of craters in any directions; here, the length of profile depends on the radius of the crater. Building of profiles through the geometric center of the object was not realized in used GIS previously. Results of implementation of this tool are roses of profiles for selected impact craters and are used for inner crater slopes measurements (Kozlova et al., 2015). Profiles, created with this tool were corrected for the general slope of the surface and then the maximum steepness for two opposite slopes was measured.
2.3. Volume measurement
The visible volume is an important parameter for studying volcanic objects on the Moon typically characterized by a noticeable relief. Such objects as Rilles and Domes are clearly distinguishable on digital elevation model LDEM1024 (Smith et al., 2010). Volume in conjunction with the other parameters from the developed volcanic objects classification model gives a complete overview of the studied objects.
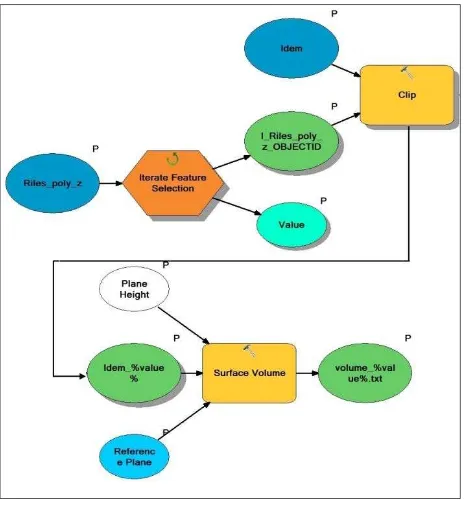
ArcGIS software allows calculating polygon volume using only terrain dataset or TIN surface, but not a raster formats, popular for planetary DEMs. A terrain dataset is a multiresolution, TIN-based surface built from measurements stored as features in a geodatabase. Also it is difficult to calculate volumes for large numbers of features, especially distributed over wide areas.
We have developed a model for calculating volumes from DEMs stored in raster formats. Our surface volume tool (fig. 2) is based on iteration operator for polygon selection and raster clipping instrument. The tool has allowed automatic calculating of more than 500 different volcanic objects on the Moon. The tool requires input parameters, such as input and output file names and reference plane information.
It allows using this model in different volume calculation tasks, connected not only with the Moon volcanic objects. To avoid extra actions when features are located on different scenes it is useful to prepare mosaics (e.g. using the standard ArcGIS tool) that cover all areas of interest. Implementation of these tools
allows processing of large volumes of data for morphometric and geologic analysis of planetary surface (Ivanov et al., 2016).
Figure 1. The algorithm for building of profile roses across centres of crater
3. CONCLUSION
New possibilities in graphics and networking available in computer browsers, together with increased browser performance allow to significantly extend the functionality of web applications and to implement processing tools within the web environment, which previously were available only in specialized software packages, such as GIS. The cross-platform web environment for GIS-functionality realisationand peer-to-peer architecture, which is being developed now (Garov et al., 2016) as 3D online laboratory for geo-collaboration of scientific community (Garov et al., 2015), allows heterogenic distributed on-line processing of spatial data, using both local and cloud computing resources. It will provide immediate and direct reuse of research materials, including data, algorithms, methodology, components, etc.
The software platform will enable processing based on algorithms specified by the researcher within a distributed cloud
The International Archives of the Photogrammetry, Remote Sensing and Spatial Information Sciences, Volume XLI-B4, 2016 XXIII ISPRS Congress, 12–19 July 2016, Prague, Czech Republic
This contribution has been peer-reviewed.
environment, which is not feasible within other existing web GIS. The tools, described above, are now integrated into the ArcGIS as toolboxes and used in a stand-alone version of the software.
In future it is planned to provide these special tools for thematic tasks via the described cross-platform cloud GIS environment.
Figure 2. The algorithm of the calculation of volumes of planetary volcanic landforms
The developed software and GIS tools were used for surface analyses at different levels of detail as well as for studies of landing sites for future missions.
ACKNOWLEDGEMENTS
This work was carried out in MIIGAiK and supported by Russian Science Foundation, project No14-22-00197
REFERENCES
ArcGIS for desktop, 2015. Available at: http://www.esri.com/software/arcgis/arcgis-for-desktop. (15 Apr. 2016)
C – Approved standards. 2016 Available at:
http://www.open-std.org/JTC1/SC22/WG14/www/standards. (15. Apr. 2016)
Garov A.S., Karachevtseva I.P., Matveev E.V., Zubarev A.E., Florinsky I.V., 2016. Development of a heterogenic distributed environment for spatial data processing using cloud technologies. The International Archives of the Photogrammetry, Remote Sensing and Spatial Information Sciences (this issue).
Garov A.S., Karachevtseva I.P., Matveev E.V., Zubarev A.E., Patratiy V.D., 2015. 3D planetary geoportal as online laboratory for geo-collaboration of scientific community. ISPRS Working Group IV/8 “Planetary Mapping and Spatial Databases” meeting, Berlin, Germany, September, 24-25.
http://www.dlr.de/pf/Portaldata/6/Resources/dokumente/abt_pd/ isprs/berlin_2015/Garov_ISPRS_IV8_2015.pdf.
Ivanov M.A., Head J.W., Bystrov A., 2016. The lunar Gruithuisen silicic extrusive domes: Topographic configuration, morphology, ages, and internal structure. Icarus (in press), available online 17 December 2015. doi:10.1016/j.icarus.2015.12.015
Kneissl T., van Gasselt S., Neukum G., 2011. Map projection independent crater size frequency determination in GIS environments – New software tool for ArcGIS. Planetary and Space Science, V. 59(11–12). P. 1243–1254.
Kokhanov A., Karachevtseva I.P., Zubarev A.E., Kozlova N.A., Kreslavsky M.A., 2014. GIS-based analysis in support of future Russian lunar missions. 45th Lunar and Planetary Science
Conference, Abstract # 1235.
http://www.hou.usra.edu/meetings/lpsc2014/pdf/1235.pdf.
Kozlova N., Rybakin Yu., Kokhanov A., Basilevsky A., Karachevtseva I., 2015. Revision of estimates of absolute age of small lunar craters (quantitative analysis of crater morphology for determination of their degree of degradation). 6th Solar System Symposium, Moscow, October, Space Research Institute of Russian Academy of Science (6MS3-MN-04). http://ms2015.cosmos.ru/sites/ms2015.cosmos.ru/files/6m-s3_abstract_book.pdf
Kokhanov A.A., Kreslavsky M.A., Karachevtseva I.P., 2015. Small impact craters in the polar regions of the Moon: peculiarities of morphometric characteristics. Solar System Research, V.49, No.5, pp. 295-302. DOI: 10.1134/S0038094615050068.
Python 3.5.1. Documentation. 2016. Available at:
https://docs.python.org/3/ (15. Apr. 2016)
Smith D.E., Zuber M.T., Neumann G.A., Lemoine F.G., Mazarico E., Torrence M.H., McGarry J.F., Rowlands D.D., Head J.W. III, Duxbury T.H., Aharonson O., Lucey P.G., Robinson M.S., Barnouin O.S., Cavanaugh J.F., Sun X., Liiva P., Mao D.-d., Smith J.C. and Bartels A.E., 2010. Initial observations from the Lunar Orbiter Laser Altimeter.
Geophysical Research Letters, 37: L18204, doi: 10.1029/2010GL043751.
Terrain Roughness – 13 Ways
http://gis4geomorphology.com/roughness-topographic-position.
Accessed 15.04.2016.
Zharkova A. Yu., Kreslavsky M.A., Brusnikin E.S., Zubarev A. E., Karachevtseva I.P., Head III J. W., 2015. Morphometry of Small Flat Floored Craters on Mercury: Implications for Regolith Thickness. American Geophysical Union, San Francisco, December 14-18, 2015. https://agu.confex.com/agu/fm15/webprogram/Paper62434.html
The International Archives of the Photogrammetry, Remote Sensing and Spatial Information Sciences, Volume XLI-B4, 2016 XXIII ISPRS Congress, 12–19 July 2016, Prague, Czech Republic
This contribution has been peer-reviewed.