MONITORING OF GLACIER VOLUME VARIATION FROM MULTI-SOURCE DATA
OVER GELADANDONG AREA
Y. Zhang a, *, H Wu a, S. Jin b, H Wang a
a Chinese Academy of Surveying and Mapping, Beijing, China - (yhzhang, wuha)@casm.ac.cn,
b Zhejiang Provincial Center of Geo-information, Hangzhou, China - [email protected]
KEY WORDS: Glacier volume, SRTM DEM, ICESat, Geladandong
ABSTRACT:
This paper presents a research on monitoring of glacier volume variation over the Geladandong area in Qinghai-Tibet plateau between 2000 and 2007 by integrating Landsat5 TM images, multi-source Digital Elevation Models (DEM) and the Geoscience Laser Altimeter System (GLAS) data from NASA Ice, Cloud, and land Elevation Satellite (ICESat). Landsat TM images acquired in 2000 and 2007 respectively are used to extract glacial area of the two dates. SRTM DEM and the national 1:50,000 DEM are used to extract the thickness variation of glaciers between the year of 2000 and 2007. Since SRTM DEM is generated from interferometric Synthetic Aperture Radar (SAR) images acquired in Feb. 2000, the elevation of glacial region could be underestimated due to the penetration of radar pulse to the ice and snow. Therefore, the IceSat GLAS data is employed to correct the penetration and refine the glacier’s elevation of SRTM DEM. Finally, the glacier volume variation of Geladandong region between 2000 and 2007 is estimated by integrating the area and elevation changes.
* Corresponding author.
1. INTRODUCTION 1.1 General Instructions
The glaciers in the Earth have been increasingly melting for the recent decades in the scenario of global warming. China owns the most mountainous glaciers, and is the 4th largest country according to the abundance of glacial resources. Melted glacier is the main water resource for the vast and dry western China (Shi and Xie, 1964). Also glaciers represent the most important fresh water storage for the whole nation. Therefore, to monitor the variation of glacier volume in the western China is a very important and meaningful topic.
Remote Sensing has been an important tool for glacier researches since 1970s. Most of the researches focus on glacier boundary extraction or glacier area mapping. The algorithms of glacier area mapping include supervised/ unsupervised classification (Aniya et al., 1996; Sidjak and Wheate, 1999), principle component analysis (Zhang, 2005), band ration (Narama et al., 2006), and snow/ice index (Hall et al., 2003) etc. To precisely calculate the volume, glacier thickness is another parameter besides the area. But, unfortunately, ground based method is the only way to measure the glacier thickness, such as ground penetration radar.
Currently, there are two kinds of methods to estimate glacier volume. The first kind calculates the glacier volume by integrating glacier thickness and area (Fischer, 2009). The second kind is to estimate the glacier volume through assumed relationship between the volume and glacier length or area (Liu et al., 2002. Obviously, the second kind of method could bring in significant errors as the thickness of glaciers is not taken into consideration.
This paper introduces a method to estimate the glacier volume variation by integrating multi-source data. Multi-temporal Landsat TM images are used to map the changes of glacier area, especially the area of glacier retreatment and advancement. The Shuttle Radar Topography Mission (SRTM) (February 11–22, 2000) DEM and the DEM extracted from national topography database at 1:50,000 scale are compared to retrieve the changes of glacier thickness. To compensate the penetration of radar pulse to ice, which could leads to underestimation of glacier height in SRTM DEM data, the GLAS data is analyzed. This consideration could improve the estimation of glacier volume variation.
2. STUDY AREA
The Geladandong Mountains are located in the center of the Qinghai-Tibet Plateau. The peak is 6621 meters high above the sea level. There are over 100 glaciers lying on the Geladandong Mountains, covering an area of around 790 square kilometers. One of these glaciers, the Jianggendiru Glacier is the head of the Yangtze River, the longest river in China. The retreatment and advancement of Geladandong glaciers is a sensitive indicator of the climate change of the Qinghai-Tibet plateau. The geographic location of the Geladandong glaciers is shown in Figure. 1.
3. DATA AND PREPROCESSING
The study period is from 2000 to 2007. Two Landsat5 TM images acquired on 21 Aug. 2000 and 5 May 2007 respectively with the same path/row number of 138/037 are collected. Both
images are not in winter, which is helpful to minimize the effect of snowing on glacial area extraction and thickness estimation.
Figure.1 Location of the Geladandong Mountains. Glaciers are in white color in the right image. Please note, there are some clouds in the west of the glaciers, as masked by the red dash line ellipses.
SRTM DEM of 3 arcsecond data is downloaded. The nominal vertical accuracy is 6 m relative and 16 m absolute (Rabus et al., 2003). Consistent methodology, coverage, and accuracy of the SRTM data provide a global “snapshot” of the land surface, and therefore, it has been applied on local and regional glacier volume change studies such as (Muskett et al., 2003; Rignot et al., 2003; Surazakov and Aizen, 2006).
Another kind of elevation data is from the national 1:50,000 scale topographic database. The 1:50,000 scale DEM of the Geladandong region is generated from SPOT High-Resolution Stereo (HRS) images acquired in April 2007 using photogrammetric processing, and thereafter called DEM 2007. DEM 2007 has the pixel size of 25m by 25m. Its vertical accuracy is better than 11 m when the terrain slope is less than 25 degrees and better than 19 m when the slope is over 25 degrees. The two TM images are ortho-rectified to the Universal Transverse Mercator (UTM) projection and WGS 84 datum with the output pixel size of 30 m. DEM 2007 is degraded to match the pixel size of TM images. At the same time, the SRTM DEM is also transformed into the UTM projection from its original geographic latitude-longitude projection and oversampled to the pixel size of 30m. The two DEMs and TM images are then coregistered to subpixel accuracy.
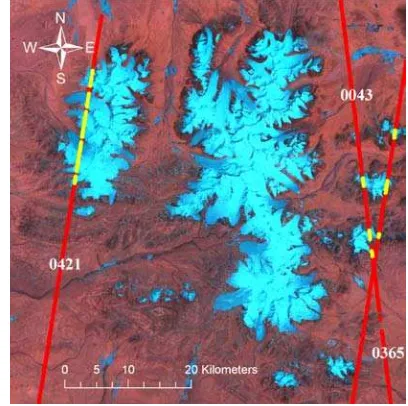
The GLAS14 (level 2 global land surface altimetry) data is used. Three tracks of GLAS14 product with the track number of 0043, 0421 and 0365 acquired in Feb. 2003 located within coverage of TM image are chosen. The data were transformed from TOPEX ellipsoid to the WGS84 reference system for comparison with the SRTM data. The GLAS 14 product has the vertical accuracy of decimeter level (Zwally et al., 2011), therefore stands for an excellent elevation reference for the other two DEMs. The GLAS data and TM image in 2007 is shown in Figure 2.
4. GLACIER AREA EXTRACTION AND CHANGE DETECTION
Glacier area is extracted based on the Normalized Difference Snow Index (NDSI) proposed by (Hall et al., 1995). Snow and ice cover have very high spectral reflectance values in the
visible bands, but low reflectance values in the mid-infrared band.
Figure. 2 False-color representation of the Lansat 5 TM image in 2007 with band 5-4-3 as R-G-B channels. Glaciers are shown
in light blue. Ground tracks of the ICESAT GLAS data are overlaid. Laser spots on non-glacial areas are shown in red
colour, and on glacier in yellow.
For TM data, NDSI is calculated using the reflectance of band 2 and band 5:
(
(2) (5) /) (
(2) (5))
TMNDSI =−CH CH +CH CH
(1)
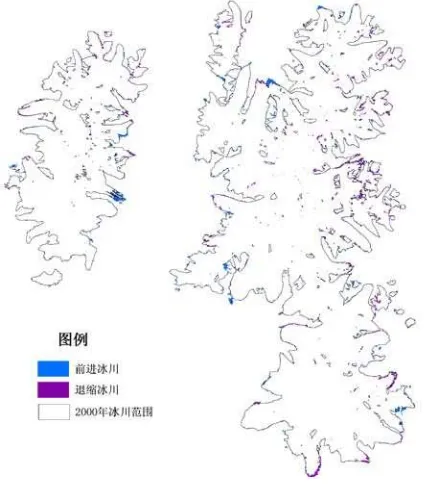
Glacier area is then extracted by setting a proper threshold to NDSI. Once the glacier area in 2000 and 2007 are extracted respectively, the glacier area changes, which are caused by glacier retreatment and advancement, could be deduced by spatially differencing the two glacier maps. Figure 3 shows the glacier area in the year of 2000 the changes between 2000 and 2007.
5. ESTIMATION OF GLACIER THICKNESS VARIATION
The basic idea is to subtract SRTM DEM from DEM 2007 so as to deduce the variation of glacier thickness between the year of 2000 and 2007. Two issues have to be considered in to achieve reasonable estimate on glacier thickness variation. The first is inconsistence between the two DEMs, that is, the elevation extracted from the two DEMs may not be identical for non-glacier area. The second is that the altitude of glacial areas is underestimated in SRTM DEM because of penetration of microwave to snow/ice. From the researches on Greenland and Alaska glaciers, Rigot et al. have reported that the penetration depth of C-band radar is 2-4 m on exposed ice and up to 10 m on cold, dry firn (Rigot et al., 2001).
Figure. 3 Extracted Glacier area boundary in Geladandong region in the year 2000. Blue patches represent advanced glaciers, while purple denotes glacier retreatment between 2000
and 2007. 5.1 Radar penetration estimation
In this research, the penetration depth of SRTM SAR into the ice/snow in Geladandong is estimated by means of ICESAT GLAS data. The GLAS operates at the wavelength 1064 nm for surface altimetry, thus has no penetration on ice and snow. The diameter of GLAS laser footprint is 70 m, comparable with the pixel size of SRTM DEM. Three tracks of GLAS data has 904 laser points located in the coverage of SRTM DEM. For each laser point of GLAS, the corresponding elevation in SRTM DEM is extracted. Out of the 904 points, 682 points are located in non-glacial area, and 222 points in glacial area. We assume that the elevation difference of non-glacial points represent the systematic error of SRTM DEM. And the elevation difference of glacier points is the combination of the systematic error of SRTM DEM and the penetration of SAR to ice and snow. Therefore, the penetration of microwave to ice and snow can be estimated by subtracting the elevation difference of non-glacial points from that of glacier points. Furthermore, since the vertical accuracy of SRTM DEM degrades with increasing
slope, the elevation difference and thus the microwave penetration is analyzed by taking into consideration the slope. For each of the 904 GLAS point, the slope is calculated from SRTM DEM. These points are then classified into 6 groups according to the slope, 0-5 degree, 5-10 degree, 10-15 degree, 15-20 degree, 20-25 degree, and above 25 degrees. Within each group, the mean of elevation difference between GLAS measurement and SRTM DEM over non-glacial points and glacier points are calculated separately. The mean of glacial points minus the mean of non-glacial points is then regarded as the estimate of radar penetration. The result is shown in Table 1. Except the group with slope from 0 to 5 degrees, the estimate of radar penetration increases with the slope. Currently, we have no other source to test whether this finding is true or not. Maybe this is only due to the worse vertical accuracy of SRTM DEM with increasing slope.
Slope
Table 1. Mean of GLAS minus SRTM elevation difference over glacier and non-glacier laser points. Radar penetration into
snow and ice is then deduced by subtracting of the mean over non-glacial points from that over glacier points. 5.2 Estimation of glacial thickness variation
We first analyze the elevation difference derived by DEM 2007 minus SRTM DEM over non-glacial areas. The result is listed in Table 2.
Table 2. Statistics of DEM 2007 minus SRTM DEM difference over non-glacial areas
The standard deviation of the elevation differences reveals that vertical accuracy of both of the DEMs degrades over rugged terrain. Relative small standard deviation (< 6m) over areas with slope less than 10 degrees suggests that there exists systematic elevation difference between the two DEMs and the mean could be regarded as an estimate of the difference. The large standard deviation over areas with slope larger than 20 degrees demonstrates that the elevation difference between the two DEMs does not show clear systematic tendency. And the mean of elevation difference over rugged terrain is smaller than that in flat area indicates that the vertical accuracy of the two DEMs in
rugged terrain is similar. Therefore, for completeness, the mean of elevation difference over non-glacial area is added to SRTM DEM to compensate for the systematic bias between the two DEMs.
Finally, Glacier thickness variation is calculated as the following:
2007
g g SRTM
h D− D− M P
∆ = − − − (2)
Where h∆ is glacier thickness variation between the years 2000 and 2007. Dg−2007, Dg SRTM− denotes glacier elevation extracted from DEM 2007 and SRTM DEM respectively. Mis the mean of elevation difference over non-glacial area listed in Table 2.
P is estimated radar penetration appeared in Table 1.
5.3 Estimation of glacial volume change
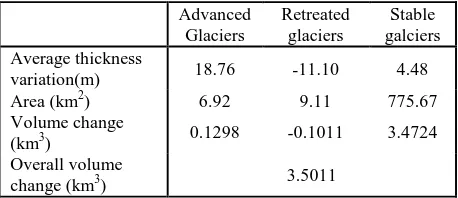
The overall glacial volume change is decomposed into three components: positive volume change caused by glacier advancement, negative volume change caused by glacier retreatment, and volume change over stable glacier areas.
p - p ++ p u
retreated, advanced and stable glaciers respectively. The result is listed in Table 3.
Table 3. Glacier volume change between the year 2000 and 2007
The result suggests that the net glacial area in the Geladandong mountains decreases in the period of 2000-2007, as retreated glacial area (9.11 Km2) is larger than advanced glacial area (6.92 with Km2). But the overall glacier volume change is positive, as generally the glaciers thicken by 4.48 m from 2000 to 2007. Finally, our research reveals that the glacier volume in the Geladandong Mountains increases by 3.5011 Km3 from the year 2000 to 2007.
6. CONCLUSION
In this paper we present a methodology to estimate glacier volume change using SRTM DEM, topographic DEM, ICESAT GLAS measurements and Landsat TM images. Landsat TM images are used to extract glacier area changes. Glacier thickness variation variation is estimated by comparing SRTM DEM and topographic DEM. Radar penetration into snow and ice inherent in SRTM elevation is estimated by menas of GLAS data. Furthermore, the systematic difference between SRTM DEM and topographic DEM is considered. As the vertical accuracy of DEM degrades in rugged terrain, glacier thickness variation is analyzed according to different slope range. Finally, glacial volume change is calculated by taking into consideration of volume change related to glacier advancement and
retreatment. These detailed considerations could make the estimate more accurate. Unfortunately, there is no any reference about glacier volume changes in the Geladandong Mountains, hence quantitative evaluation of the result is impossible at this moment.
We believe under wide scenario of global climate change, the changes of Geladandong glaciers present both the long term tendency, but also annual variation. To understand the long-term tendency is of more importance to environment protection and resource management. Therefore, in the future, we plan to expand the research to much longer time span, for example from 1970s to 2010.
ACKNOWLEDGMENTS
This research was supported by the Open Research Fund of Key Laboratory of Digital Earth Science, Center for Earth Observation and Digital Earth, Chinese Academy of Sciences (No.2012LDE001). ICESat data is NASA copyright and distributed by NSIDC. We also thank USGS for supporting SRTM DEM and Landsat TM images and CASM for providing DEM 2007.
References:
Aniya, M., Sato, H., Naruse, R., et al, 1996. The Use of Satellite and Airborne Imagery to Inventory Outlet Glaciers of the Southern PatagonianI cefield, South America. Photogrammetric Engineering & Remote Sensing, 62(12), pp. 41361-1369.
Fischer, A.. 2009. Calculation of glacier volume from sparse ice-thickness data applied to Schaufelferner,Austria. Journal
of Glaciology, 55(191), pp. 453-460.
Liu S., Sun W., Shen Y., et al., 2002. Glacier Variation since the maximum of the Little Ice Age in the Western Qilian Mountains, Northwest China. Journal of Glaciology and Geocryology, 24 (3), pp. 227- 233.
Rabus, B., Eineder, M., Roth, A., and et al, 2003. The Shuttle Radar Topography Mission—A new class of digital elevation models acquired by spaceborne radar. ISPRS J. Photogramm. Remote Sens, 57(4), pp. 241-262.
Rignot, E., Echelmeyer, K., Krabill, W., 2001. Penetration depth of interferometric synthetic‐aperture radar signals in
snow and ice. Geophysical Research Letters, 28(18), pp. 3501-3504.
Rignot, E., Rivera, A., and Casassa, G., 2003. Contribution of the Patagonia icefields of South America to sea level rise. Science, 302(5644), pp. 434-437.
Narama, C., Shimamura, Y., Nakayama, D., et al, 2006. Recent Changesof Glacier Coverage in the Western Terskey-Alatoo Range,Kyrgyz Republic,Using Corona and Landsat. Annals of Glaciology, 43, pp. 223-229.
Hall, K., Bayr, J., Schner, W., et al, 2003. Consideration of the errors inherent in mapping historical glacier positions in Austria from the ground and space (1893-2001). Remote Sensing of Environment, 86(4), pp. 566-577.
Hall, K., Riggs, A., Salomonson, V., 1995. Development of methods for mapping global snow cover using moderate resolution imaging spectroradiometer data. Remote Sensing of Environment, 54, pp. 27-140.
Muskett, R., Lingle, S., Tangborn, V., and et al, 2003. Multidecadal elevation changes on Bagley Ice Valley and Malaspina Glacier, Alaska. Geophysical Research Letters, 30(16), pp. 1857.
Surazakov, B., Aizen, B., 2006. Estimating volume change of mountain glaciers using SRTM and map-based topographic data. IEEE Transactions on Geoscience and Remote Sensing, 44(10), pp. 2991-2995.
Shi, Y., Xie, Z., 1964. Fundamental characteristics of the modern glaciers in China. Acta Geographica Sinica, 30(3), pp. 183-213.
Sidjak, W., Wheate, R., 1999. Glacier Mapping of the IllecillewaetIcefield, British Columbia, Canada, Using Landsat TM and Digital Elevation Data. International Journal of Remote Sensing, 20(2), pp. 273-284.
Zwally, H., Schutz, R., Bentley, C., and et al, 2011. GLAS/ICESat L2 Global Land Surface Altimetry Data. Version 33. Boulder, Colorado USA: National Snow and Ice Data Center.
Zhang, M., 2005. Extracting the Temperate Glacier Information in the Mount Namjagbarwa, Tibet Autonomous Region, Based on ETM+ Image. Journal of Glaciology And Geocryology, 27(2), pp. 226-232.