THE USE OF UAS FOR ASSESSING AGRICULTURAL SYSTEMS IN AN WETLAND IN
TANZANIA IN THE DRY- AND WET-SEASON FOR SUSTAINABLE AGRICULTURE
AND PROVIDING GROUND TRUTH FOR TERRA-SAR X DATA
Thamm, H.-P.(a)
; Menz, G (b)
; Becker, M(c)
; Kuria D.N.(d)
; Misana, S.(e)
; Kohn, D. (b)
a
H.-P. Thamm Geo-Technic, Neustr. 40, 53545 Linz am Rhein, Germany
[email protected]b
Remote Sensing Research Group, Rheinische Friedrich-Willhelms-University, Meckenheimer Str. 166, D-53115
Bonn, Germany,
[email protected]c
INRES - Institut für Nutzpflanzenwissenschaften und Ressourcenschutz, Bereich Pflanzenernährung, Rheinische
Friedrich-Willhelms-Universität, Karlrobert-Kreiten-Strasse 13, D-53115 Bonn, Germany,
[email protected]d
Geomatic Engineering and Geospatial Information Science Department, Institute of Geomatics, GIS & Remote
Sensing (IGGReS), Kimathi University College of Technology, Kenya,
[email protected]e
Salome Misana, Department of Geography, University of Dar es Salaam, Tanzania,
[email protected]KEY WORDS: UAS, Land use / land cover assessment, Monitoring farming Systems, ,Ground Truth, DEM derivation, Land-management
ABSTRACT:
The paper describes the assessment of the vegetation and the land use systems of the Malinda Wetland in the Usambara Mountains in Tanzania with the parachute UAS (unmanned aerial system) SUSI 62. The area of investigation was around 8 km². In two campaigns, one in the wet season and one in the dry season, approximately 2600 aerial photos of the wetland were taken using the parachute UAS SUSI 62; of these images, ortho-photos with a spatial resolution of 20 cm x 20 cm, were computed with an advanced block bundle approach. The block bundles were geo-referenced using control points taken with differential GPS. As well a digital surface model (DSM) of the wetland was created out of the UAS photos. Using the ortho-photos it is possible to assess the different land use systems; the differences in the phenology of the vegetation between wet and dry season can be investigated. In addition, the regionalisation of bio mass samples on smaller test plots was possible. The ortho-photos and the DSM derived from the UAS proved to be a valuable ground truth for the interpretation of Terra-SAR X images. The campaigns demonstrated that SUSI 62 was a suitable, robust tool to obtain the valuable information under harsh conditions.
1. INTRODUCTION
1.1 General introduction
The wetlands in the Sub-Saharan Africa which cover around 228 Mio hectares, fulfil numerous social and agricultural functions (Chapman et al., 2011). They are islan ds of biodiversity, provide clean water and are possibly important sinks for carbon. Their recent use as agricultural production sites results in user conflicts for land and water and the loss of their ability to fulfil the diverse functions (Rebelo et al., 2009). It is necessary to reconcile demands for increasing production while taking into account environmental protection. In spite of their manifold functions so far they have received only little research attention (Sakané et al., 2013). In response, the interdisciplinary project "Agricultural use and vulnerability of small wetlands in East Africa (SWEA)" a joint project of Universities in Germany, Tanzania and Kenya, financed by the Volkswagen Foundation, was started (SWEA, 2008). It aims to provide a quantitative basis for assessing the current and future potential of wetlands in East Africa and to develop tools to guide decision makers and planners with regards to wetland use (Becker et al., 2006, Alvarez et al., 2012).
This demands a sound mapping of vegetation and land use systems. Remote sensing proved to be suitable for that purpose
(Rundquist et al., 2001). But to assess the heterogeneity and the small fields, remote sensing images in a very high spatial resolution are necessary (Mwita et al., 2013). However, due to frequent cloud cover in the wet season it is difficult to get cloud free high resolution optical satellite images. Aerial photos can be a solution (Franke et al., 2009) but there are some challenges, such as availability of a reliable airplane, geometry of the images, and high costs. As well, very fast changing weather conditions in the wet season can be hazardous for aeroplanes.
So the idea arose, to test and utilise UAS (Unmanned Aerial Systems) for gaining the needed ortho-photos in a high spatial resolution for one SWEA test site, the Malinda Wetland in the Korogwe District in Tanzania.
1.2 Aim
comparing the phenology shown on the ortho-photos the vegetation dynamics between dry and wet seasons can be investigated. As well, the photos can be used to extrapolate the results of bio mass investigation performed on test plots to larger areas. Finally, the ortho-photos and the DSM should be used as ground truth helping to interpret Terra SAR-X images of the test site.
1.3 Area of investigation
The area of investigation is the Malinda Wetland in the Usambara Mountains in Tanzania (5° 06' 20" S, 38° 20' 29" E, 357 m asl), where manifold research activities (e.g. bio mass test sites, comparison of land manure techniques, socio-economic studies) are located. It has a length of ca. 6 km and a width on the widest side of approximately 2 km. The entire area covers approximately 8 km². In the centre there are black, fertile humus soils, whereas, at the edges, in the areas that are not regularly flooded, red laterite soils are present. Small-scale farming is dominant. A small band of gallery forest is situated along the river. Settlements are only on the hills at the edges of the wetland. In the wet season the centre of the wetland is flooded for several weeks. A detailed description of the ecology can be found in Alvarez et al. (2012).
For the use of UAS the meteorological conditions are important. During the rainy season, clouds can build up very fast and within 10 minutes strong winds and heavy rain can occur. The nearby Usambara Mountains can cause gusty winds and turbulence. During the dry season stronger winds of more than 5 m/s are also possible.
2. METHODS
2.1 Choice of the UAS
There are many types of UAS available. Eisenbeiss (2009) and Everaerts (2008) give a good overview of the different UAS and their properties. It is essential to take into account the challenging conditions of the Malinda Wetland or similar terrain when selecting a suitable UAS. The device must be robust because conditions in the test site are quite harsh (dust, mud, moisture) and there are no ideal landing strips. A key consideration is the ability to land the UAS outside of special airstrips due to changing and/or poor weather conditions. As well, in order to minimise damage on the ground due to malfunction, the UAS should possess high safety features. The UAS should also be easy to repair on site, thus, mitigating risk of aborting the overall investigation. Furthermore, the UAS should be able to carry good SLR (single lens reflex) cameras with decent lenses in order to provide good images even during the rainy season when there is weak lighting due to complete cloud cover. Selecting a UAS with low ground speed is preferable to ensure sharp images even with longer exposure time. Due to the fact that access to electrical power is limited in the test site, a two stroke engine has advantages because no big batteries have to be recharged. And the dismantled system should be compact to transport as checked-in baggage.
Considering the aforementioned requirements, the UAS SUSI 62 is an appropriate device with a proven track record when utilized in similar conditions in other parts of Africa (Thamm, 2011).
2.2 Description of the UAS SUSI 62
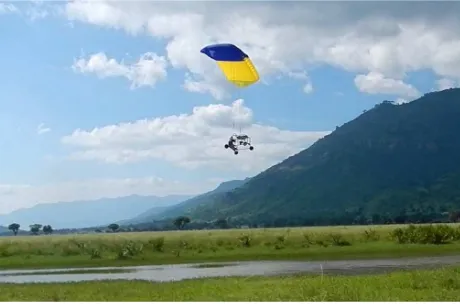
The SUSI 62 is a parachute UAS which consists of a lightweight steel frame with a 5.5 hp 2-stroke engine and a parachute wing (Figure 1). It weights approximately 16 kg at take-off and can carry up to a 6 kg payload. Two different parachute sizes can be used for different wind conditions. The maximum speed with the small parachute is around 55 km/h and with the big parachute, which gives maximum lift, around 45 km/h. A detailed description of SUSI 62 is given by Thamm (2011). It has a flight time of more than a hour and can fly up to 3500 m.
Figure 1. SUSI 62 in operation, Malinda Wetland May 2012
When losing contact with the remote control, the engine stops automatically and the servos bring the parachute into a landing position, so the UAS turns in the direction of the wind and comes down, with a sinking speed of around 2,5 m/s. The total system only requires three servos, thus, reducing the risk of malfunction. The electronics on board are supplied by a 6000 mAh FePo rechargeable battery pack which lasts between 4 -6 hours. A spare 1800 mAh battery pack automatically activates if the main battery pack is flat or damaged.
Due to legal issues the strength of the radio transmission (2,4 GHz) is limited with a range of approximately 2 km. Autonomous flights out of sight are currently illegal.
SUSI 62 has a near real time data link to the ground station. The video signal, the GPS position and other flight parameters are transferred and displayed on a computer. It is possible to underlay geo-referenced maps or satellite images to enable the operator can see the position of the UAS.
SUSI 62 can be mounted or dismantled within one hour and fits in an alloy box with the a size of 60cm x 40cm x 41cm which is accepted by the airlines and fits an a standard car (Golf-Type). During a field campaign the system does not need to be dismantled, however, the parachute should be removed for transport. The take-off can be performed approximately 20 min after arriving at the air strip.
2.3 Camera and images
angles, so the distortion caused by the wide angle lenses can be advantageous for processing.
According to the light conditions, shutter times between 1/400 and 1/1000 were used. To save storage space the images are saved in the JEPG format instead of the RAW format. The sizes of images vary from 5 MB to 8.5 MB.
For an efficient archival of the images post UAS flight, a GPS was linked to the camera, so that the latitude and longitude as well as the flight height over sea level at the time of exposure was directly written to the EXIF headers of the images.
2.4 Flight preparation and flight
Firstly, a flight permit was obtained by the authorities in Dar Es Salaam several weeks after application.
To ensure that the investigation area is completely covered with overlapping images, a specially designed software was used. It calculates the needed flight paths for a specified area based on inputs such as camera resolution, sensor size, focal length, desired ground resolution and needed overlap of the images in x and y. These optimal flight paths are displayed as overlay on the used digital maps on the ground station computer so the operator can see the planned flight route, the real position of the UAS and the derivation between the optimal path and the real position.
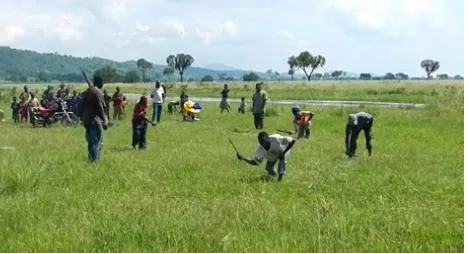
Due to the legal restriction of the range of the remote control to 2 km, it was necessary to find and prepare suitable landing strips in and at the edge of the area of investigation. During the dry season the soil of the centre part of the wetland is dry and the vegetation is mostly burned, therefore, suitable for use as a landing strip. However, in the wet season it is necessary to create suitable landing strips by cutting the vegetation. Figure 2 shows the preparation of a field airstrip. But with skilled workers the preparation of a runway took less than one hour. The main base was a school soccer field located west of the investigation area.
Figure 2. Preparation of an runway for SUSI 62 in the wetland. Like shown on the photo, it is possible to create a suitable
runway quite easily.
Over four days (May 16-19, 2012) during the wet season flights were performed. Sometimes onset of rain or strong winds > 8 m/s grounded the UAS. If it is raining, the camera will not produce usable images and the parachute can fill-up with water, which negatively alters flight properties. To find the optimal set up, test flights at different heights and with different camera settings are performed. As well, flights at a low altitude were undertaken to map the biomass test plots in a very high spatial resolution. The coverage of the whole
catchment was done in two days. Under suitable weather conditions, the work can be completed in one or two days. From the 15th to the 18th August 2012, at the end of the dry season, the second field campaign took place. There the only restriction was strong wind during two afternoons.
2.5 Ground truth
During the first campaign the differential GPS didn't work properly so no precise ground control points could be recorded. However, during the August campaign, white tiles had be placed as ground control points for the geo-referencing in parts of the catchment. Their position was measured with differential GPS and a base station with a precision in x and y of better than 50 cm. To save time, the assessment of additional ground control points were done after the flights by visiting and measuring the position of landmarks, which could be clearly identified on the photos taken by the UAS.
2.6 Image processing
Approximately 2500 images were taken to cover the catchment in both campaigns. For efficient organisation of the images the GPS position and height of every image was extracted from the EXIF-header and written in a file and imported in a GIS. The position of every image was marked by a point and every original image can be accessed with one mouse click.
Redundant photos and photos taken from a lower flight height than a given threshold were removed. The remaining images well, it is possible to use non-calibrated cameras.
The principles of the method are described by Snavely et al. (2008), or in brief by Kersten et al. (2012). The first step is the automatic derivation of the calibration parameter of the camera, the image orientation and the derivation of a thin 3-D point cloud with the bundler software (Snavely et al., 2008). With specialized software, replacing the often used PMVS2 (patch-based multi-view stereo software, Furukawa & Ponce, 2010) a dense image matching is performed. The result is a block bundle for the whole area of investigation for each campaign. Using the GCP of the August campaign, the block bundle showing the situation of the wet season was geo-referenced. The geo-referencing to the GPS had a RMS of 2.3 pixel, which can be accepted given a pixel size of 20 cm x 20 cm and considering precision of the location of the GCP. It turned out that at the edges of the block bundle the location errors increased. That is a principal problem of SIFT algorithm (scale invariant feature transform, Lowe, 2004) as implemented in the bundler software. The accuracy of this method increases with the available number of images showing an object from different angles. At the edges of the catchments there are less overlapping images. Therefore the areas at the edges of the block bundles were cut.
comparison with the results of a simple interpolation of colour values of the dense point cloud. A digital surface model in a spatial resolution of 1 m x 1 m was computed as well. Because during the May campaign no GCPs were available, reference points were extracted from the geo-referenced block bundle from August. So the relative location displacement between the both images could be minimised which is advantageous for the change detection between the images.
3. RESULTS
3.1 Interpretation of the ortho-photos
The ortho-photos of the catchment have a spatial resolution of 20 cm x 20 cm. The interpretation of the area of investigation is possible in a very high precision. So the field sizes, the different farming systems and the spatial location of the fields, can be specifically analysed. As well, it is possible to investigate the spatial context between the settlements, the path network and the fields.
The test plots where bio mass samples were collected regularly can be seen clearly. Even slight heterogeneities in the vegetation are visible. As well it is possible to map the trees and gallery forests.
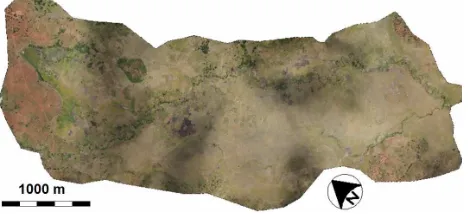
Figure 3. Ortho-photo of the Malinda Wetland, derived out of 2400 images taken with the UAS SUSI 62, August 2012
The boundary of the frequently flooded part of the wetland could be delineated quite well by the different colour of the soils: the humous soils in the centre are black, the soils where not much organic matter is deposed by the flood are reddish, due to the laterite content. The use of a principal component image computed out of the layer-stacked images was helpful in this context, as explained later on.
The analysis of the vegetation dynamics between the wet and the dry season brought interesting results. First a simple band differencing of the channel 2 (green) of the optical camera between the ortho-photo of May and August was performed (Radke et al., 2005). The differences in the vegetation cover in the fields could be detected in detail however, changes of the soil colour is also represented. Due to soil moisture, the red soil was much darker in the wet season.
To improve results, the investigators performed a layer stack of the single channels of the ortho-photos from May and August. Then, six principle components (PC) were computed out of that image (Richards, 2012). Displaying them in a false colour image, the vegetation dynamics turned out very clearly. Figure 6 shows the resulting image when the second PC was put on the red channel, the fifth PC on the green and on the blue channel. The areas with decreased vegetation are represented in the turquoise blue colour. This is a fast and easy way to detect changes only from optical images. When using
unsupervised classification of the layer stacked images, the changes can be assessed.
For future investigations an additional camera, recording the reflectance of the near infrared, will be used on SUSI 62, to compute the NDVI (normalised differential vegetation index). So that the chlorophyll in the vegetation can be assessed quantitatively (Jiang et al., 2006).
Figure 4. Detail of the ortho-photo from the wet season 19.05.2012
Figure 6. Change detection between May and August 2012 principle component analysis of the layer stack of both images.
Areas with less vegetation turn out turquoise (red-PC2, green-PC5, blue-PC5).
3.2 Using the results of the UAS campaign as ground truth for TerraSAR-X images
Radar satellite images promise to be valuable sources of information for monitoring vegetation, especially in the wet season (Hong et al., 2010). When optical satellites can't be used because of cloud cover, radar can penetrate clouds and provide information about the land use / land cover. As well, being sensitive to structure of the vegetation, radar images provide additional information (McNairn et al., 2009). But the interpretation of radar images is not easy. A sound interpretation relies on good ground truth. A TerraSAR-X image for the area of investigation was taken in the spotlight mode with 1.8 m x 1.8 m resolution at the 09.06.2012. Figure 7 shows it in the vv mode for the same subset as the Figure 5.
Figure 7. TerraSAR-X Spotlight image (vv) from 09.06 2012 for the same subset than Figure 5
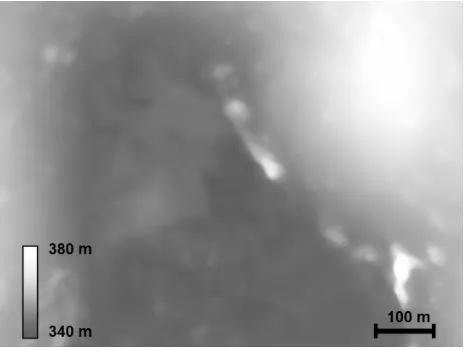
Figure 8. Digital Surface model derived from the UAS images in a resolution of 1 m x 1 m
Comparing the radar image with the optical image (Fig. 5) and the digital surface model (Fig. 8) it is obvious how the
vegetation influences the strength of the backscatter signal. The line of trees (centre north to south east) cause a very strong reflection. As well the shrubs at the side of the path (east) lead to a clearly visible pattern. Now it is necessary to investigate the influence of the vegetation on the backscatter signal in detail. Further it is important to separate the influence of the topography and the vegetation on the backscatter signal. The ortho-photos and the DSM derived form UAS are very useful to understand the complex backscatter characteristics of the images. In this regard time series of simultaneous taken radar and UAS images can lead to a much better understanding about the backscatter characteristics for different phenological states for the different crops an vegetation types.
4. CONCLUSION
The campaign proved the suitability of UAS to gain ortho-photos and digital elevation models in very high spatial resolution and sufficient geometric precision for larger catchments (>900 ha). The use of the UAS even under the harsh conditions in Tanzania was unproblematic. As well it turned out that processing chain for computing ortho-photos and DSM out of the images is mature and can handle large datasets. This opens very interesting research options, because it is now possible to gain time series of optical images in the desired temporal and needed spatial resolution, even if the sky is cloudy and in remote areas. As well, the value of the UAS imagery as reliable ground truth for radar satellite images is proven.
Some future improvements can even enhance the usability of the UAS. An increasing of the flight time and range of the remote control can save time, because the number of intermediate landings can be reduced. The combined use of optical and NIR cameras, which is possible in regard to the carrying capacity of SUSI 62 enables the computing of the NDVI and therefore, the quantification of vegetation.
An integration of a differential GPS on the UAS and implementing an automatic geo-referencing of the block bundle could save the time-consuming, awkward measuring of ground control points.
5. REFERENCES
Austin, R., 2010. Unmanned Aircraft Systems. UAVS Design, Development and Deployment. John Wiley & Son, Hoboken, Chichester.
Alvarez, M., Becker, M., Böhme, B., Handa, C., Josko, M., Kamiri, H. W. & N. Sakané, 2012. Floristic classification of the vegetation in small wetlands of Kenya and Tanzania. Vegetation databases for the 21st century. Biodiversity & Ecology, 4, 63-76.
Becker, M., Misana, S., Oyieke, H. &. M. Langensiepen, 2006. Agricultural use and vulnerability of small wetlands in
East
Africa.http://www.wetlands.uni-bonn.de/pdf/Wetlands_Background.pdf (17.06.2012)
Eisenbeiss, H., 2009. UAV Photogrammetry. Dissertation, ETH NO. 18515, Zürich.
Everaerts, J., 2008. The Use of Unmanned Aerial Vehicles (UAVS) for Remote Sensing and Mapping, The International Archives of the Photogrammetry, Remote Sensing and Spatial Information Sciences, ISPRS Congress, Beijing, China, XXXVII. Part B1, 1187-1192.
Franke, J., Becker, M., Menz, G., Misana, S., Mwita, E. & Nienkemper, P., 2009. Aerial imagery for monitoring land use in East African wetland ecosystems. In: Geoscienc and Remote Sensing Symposium, 2009 IEEE International, IGARSS 2009, vol. 5, pp. V-288–V-291
Furukawa, Y. & J. Ponce, 2009. Accurate camera calibration from multi-view stereo and bundle adjustment. International Journal of Computer Vision, 84(3), 257-268.
Hong, S. H., Wdowinski, S., & Kim, S. W., 2010. Evaluation of TerraSAR-X observations for wetland InSAR application.
Geoscience and Remote Sensing, IEEE Transactions on, 48(2), 864-873.
Jiang, Z., Huete, A. R., Chen, J., Chen, Y., Li, J., Yan, G., & Zhang, X., 2006. Analysis of NDVI and scaled difference vegetation index retrievals of vegetation fraction. Remote Sensing of Environment, 101(3), 366-378.
Kersten, P.T., Lindstaedt, M., Mechelke, K. & K. Zobel, 2012. Automatische 3-D Objektrekonstruktion aus unstrukturierten digitalen Bilddaten für Anwendungen in Architektur, Denkmalpflege und Archäologie. Publikationen der Deutschen Gesellschaft für Photogrammetrie, Fernerkundung und Geoinformation e.V., Band 21, Hrsg. Seyfert, E., 32. Wissenschaftlich-Technische Jahrestagung der DGPF, 14.-17.03.2012 in Potsdam, Proceedings on CD-ROM, 137-148.
Lowe, D. G., 2004. Distinctive image features from scale-invariant keypoints. International Journal of Computer Vision, 60(2), 91-110.
McNairn, H., Shang, J., Champagne, C. & X, Jiao, 2009. TerraSAR-X and RADARSAT-2 for crop classification and acreage estimation. In: Geoscience and Remote Sensing Symposium, 2009 IEEE International, IGARSS 2009 (Vol. 2, pp. II-898).
Mwita, E., Menz, G., Misana, S., Becker, M., Kisanga, D., & B. Boehme, 2013. Mapping small wetlands of Kenya and Tanzania using remote sensing techniques. International Journal of Applied Earth Observation and Geoinformation,
21, 173-183.
Radke, R. J., Andra, S., Al-Kofahi, O. & B. Roysam, 2005. Image change detection algorithms: a systematic survey. Image Processing, IEEE Transactions on, 14(3), 294-307.
Richards, J. A., 2012. Remote sensing digital image analysis. Springer.
Rebelo, L., McCartney, M. & C. Finlayson, 2009. Wetlands of Sub-Saharan Africa: distribution and contribution of agriculture to livelihoods. Wetlands Ecology and Management 18 (5), 16–32.
Rundquist, D.C., Narumalani, S. & R.M. Narayanan, 2001. A review of wetlands remote sensing and defining new considerations. Remote Sensing Reviews, 20 (3), 207–226.
Sakané, N., Becker, M., Langensiepen, M. & M. T. van Wijk, 2013. Typology of Smallholder Production Systems in Small East-African Wetlands. Wetlands, 33(1), 101-116.
Snavely, N., Seitz, S.M., & R. Szeliski, 2008. "Modeling the world from internet photo collections." International Journal of Computer Vision, 80(2), 189-210.