QUALITY ASSESSMENT FOR THE FIRST PART OF THE
TANDEM-X GLOBAL DIGITAL ELEVATION MODEL
B. Bräutigam, M. Martone, P. Rizzoli, C. Gonzalez, C. Wecklich, D. Borla Tridon, M. Bachmann, D. Schulze, M. Zink
German Aerospace Center (DLR), Microwaves and Radar Institute, Oberpfaffenhofen, Germany [email protected]
KEY WORDS: Synthetic Aperture Radar (SAR), SAR Interferometry, Digital Elevation Model (DEM), TanDEM-X
ABSTRACT:
TanDEM-X is an innovative synthetic aperture radar (SAR) mission with the main goal to generate a global and homogeneous digital elevation model (DEM) of the Earth’s land masses. The final DEM product will reach a new dimension of detail with respect to resolution and quality. The absolute horizontal and vertical accuracy shall each be less than 10 m in a 90% confidence interval at a pixel spacing of 12 m. The relative vertical accuracy specification for the TanDEM-X mission foresees a 90% point-to-point error of 2 m (4 m) for areas with predominant terrain slopes smaller than 20% (greater than 20%) within a 1° longitude by 1° latitude cell. The global DEM is derived from interferometric SAR acquisitions performed by two radar satellites flying in close orbit formation. Interferometric performance parameters like the coherence between the two radar images have been monitored and evaluated throughout the mission. In a further step, over 500,000 single SAR scenes are interferometrically processed, calibrated, and mosaicked into a global DEM product which will be completely available in the second half of 2016. This paper presents an up-to-date quality status of the single interferometric acquisitions as well as of 50% of the final DEM. The overall DEM quality of these first products promises accuracies well within the specification, especially in terms of absolute height accuracy.
1. INTRODUCTION
The primary goal of the TanDEM-X mission is to generate a consistent digital elevation model (DEM) of the Earth’s land masses. The final DEM product will reach a new dimension of detail with respect to resolution and quality (Krieger, 2007). The absolute height error shall be less than 10 m in a 90% confidence interval at a pixel spacing of 12 m. The relative vertical accuracy for the TanDEM-X mission foresees a 90% point-to-point error of less than 2 m (4 m) for areas with predominant terrain slopes smaller than 20% (greater than 20%) within a 1° longitude by 1° latitude geotile. The absolute vertical and horizontal accuracy shall each be better than 10 m in a 90% confidence level. (Wessel, 2013) and Table 1 list these driving mission specification.
The global DEM is derived from interferometric SAR (synthetic aperture radar) acquisitions performed by the two German radar satellites TerraSAR-X and TanDEM-X which have been flying in a close orbit formation at distances of around 500 m and below since 2010 (Krieger, 2013). Systematic acquisitions for the complete global DEM have been performed until summer 2014 (Borla Tridon, 2014). The data processing is currently ongoing, and DEM products for over the half of the Earth’s land masses have been generated until February 2015. The full delivery of the global DEM is planned for the second half of 2016. Section 2 will present the DEM acquisition and generation approach in more detail.
Up to February 2015, the TanDEM-X mission has been producing over 458,000 interferometric SAR scenes and corresponding input DEMs. This input data base for the final DEM is steadily growing and has been monitored for the whole mission time (Bräutigam, 2014). Single DEM performance and calibration parameters have been derived from this in order to estimate the final product accuracy and to optimize the acquisition strategy. Section 3 provides a full quality status of these single scenes.
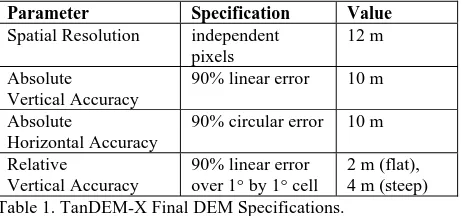
Parameter Specification Value Spatial Resolution independent
pixels
12 m
Absolute Vertical Accuracy
90% linear error 10 m
Absolute
Horizontal Accuracy
90% circular error 10 m
Relative
Vertical Accuracy
90% linear error over 1° by 1° cell
2 m (flat), 4 m (steep) Table 1. TanDEM-X Final DEM Specifications.
The input DEMs are calibrated and mosaicked into larger blocks. Multiple coverages will consequently lead to an overall improvement of the height accuracy (Krieger, 2007). The final DEM of the whole Earth will be delivered in tiles of approximately 110 km by 110 km in size. Section 4 presents an assessment for the relative and absolute height accuracy of over 8,800 final DEM products which are already available.
2. GLOBAL DEM GENERATION
In order to fulfil the height accuracy specifications from Table 1, the satellite orbit formation is continuously optimized with respect to each region that is to be mapped (Krieger, 2007), (Borla Tridon, 2014). The perpendicular baseline, i.e., the distance between the satellites normal to the line of sight, is adjusted according to the required height of ambiguity, which drives the final height accuracy. The height of ambiguity is defined as the height difference equivalent to a complete 2cycle of the interferometric phase. It depends on the imaging incidence angle and is inversely proportional to the baseline length. It is a direct scaling factor that relates the interferometric phase error to the relative height error.
2.1 Systematic Data Acquisition
The systematic planning of interferometric acquisitions has to consider the limited resources of the two satellites as well as the capacity of the ground segment downlink stations. The acquisition concept foresees a first global coverage at larger heights of ambiguity for a robust data basis and a second global acquisition at smaller heights of ambiguity to improve the height accuracy and resolve phase unwrapping problems by dual-baseline processing (Lachaise, 2012). Likewise, multiple acquisitions can be combined to achieve low and homogeneous relative height errors over larger regions.
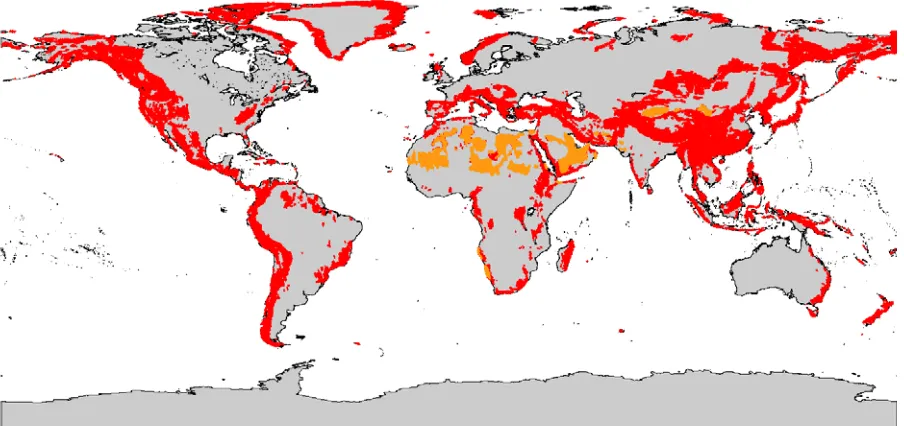
In the first two years of operations two global coverages of the Earth’s land masses, excluding Antarctica, have been acquired. All the acquisitions have been carried out in the nominal right-looking observation mode, during ascending orbits in the northern hemisphere and during descending orbits in the southern hemisphere. Some difficult terrain such as forests affected by strong volume decorrelation, mountainous regions affected by shadow and layover, and deserts with low return signal needed to be acquired multiple times with different constraints (Borla Tridon 2014b). The regions are given in Figure 1. Acquisitions over mountainous regions, which are characterized by rugged topography, are strongly affected by geometrical distortions. Therefore, these areas have been reacquired twice, between August 2013 and April 2014, from the opposite viewing geometry: in descending orbits in the northern hemisphere and in ascending orbits in the southern hemisphere. In order to enable acquisitions from the opposite viewing geometry with a good height of ambiguity, the orbit formation was changed so that the rotation direction of the TanDEM-X satellite around TerraSAR-X, looking in the flight direction, was reversed (Maurer, 2014).
Antarctica has been acquired in separate phases during the local winter which is between May and September on the southern hemisphere. This is especially necessary for the outer regions of Antarctica near the ocean as the backscatter is significantly low during the summer period when the snow is partially melted. In the inner part of Antarctica, dedicated satellite left-looking acquisitions are required due to the inclination of the orbit. The first Antarctica coverage took place in April and May 2013, the second coverage was performed in April and May 2014.
2.2 Global DEM Generation
The generation of DEM products out of SAR instrument raw data is performed by two processing systems, i.e., the interferometric processor and the calibration and mosaicking processor (Wessel, 2008), (Fritz, 2012). The interferometric data processing chain starts with SAR focusing of the raw data from the two satellites and delivers coregistered scenes of 50 km by 30 km in size. These scenes are interferometrically processed and geocoded into single input DEMs which are roughly calibrated in height by using radargrammetry (Rossi, 2012). A crucial step is the phase unwrapping of the interferograms. Acquisitions with low height of ambiguity use dual-baseline phase unwrapping supported by already processed acquisitions with larger heights of ambiguity (Lachaise, 2012).. As a pre-requisite, these scenes have undergone a sophisticated synchronization and calibration process, see Section 3.1 and (Breit, 2011).
When all the input DEMs of a larger region (in the order of 1000 km by 1000 km) are available, the tilts and offsets are calibrated out using suitable height references (Wessel, 2011). A small subset of data points from the laser altimeter mission ICESat is used for calibration, a larger portion of ICESat data serves for validation of the final DEM heights (Huber, 2009). Finally, the mosaicking processor combines all elevation data and produces the output DEM tiles of about 110 km by 110 km (1° by 1° size at the equator). On top of the elevation information, each of these DEM products contains additional data layers like a height error map, SAR amplitude data or height validation statistics (Wessel, 2013). The global DEM will consist of almost 20,000 tiles covering the Earth’s land masses which are about 150 million square kilometers.
3. INTERFEROMETRIC QUALITY ASSESSMENT
During the acquisition and data processing process, the single interferometric scenes are analysed for their quality in terms of interferometric calibration and performance. Within this paper, we present an overview of over 458,000 interferometric SAR scenes and corresponding input DEMs.
Figure 1. Regions affected by shadow and layover effects (in red) have been identified from terrain slope calculations. Deserts regions (in orange) have been derived from TanDEM-X coherence data of the first and second year acquisitions.
3.1 Interferometric Calibration of Single Acquisitions
Interferometric calibration of the complete bistatic SAR system is a pre-requisite for generating useful DEM scenes (Krieger, 2007). Each single DEM needs to be as close as possible to its real height to allow an accurate geocoding and to facilitate the final mosaicking and calibration process, which handles tilts and offsets in larger blocks of neighbouring scenes. In the case of TanDEM-X, systematic baseline errors as well as phase and timing offsets have been measured and analysed in order to calibrate the single input scenes (Hueso González, 2012), (Krieger, 2012).
The stability of the line of sight error of the satellite distance vector (the baseline) contributes to a height offset of the DEM (Walter Antony, 2013). A baseline estimation error of 1 mm roughly corresponds to a height error of 1 m for a typical height of ambiguity. Hence, the bias in the baseline must be continuously monitored over all mission phases and acquisition settings. The long-term evolution of the baseline bias is shown in Figure 2 with the dashed lines representing the implemented system offsets. The measurements show a standard deviation of less than 1.4 mm.
The two further aspects of interferometric calibration cover the measurements of radargrammetric shifts and the absolute radar
phase. Internal time delays need to be compensated so that the correct height of ambiguity band can be derived from the radargrammetric shifts, in order to provide a rough absolute height information (Rossi, 2012). For the radar phase, instrument systematics inside and between the satellites have to be calibrated. After interferometric calibration of the above mentioned aspects, the absolute height offset of single DEM scenes can be estimated from reference data such as SRTM or ICESat. 87% of all single input DEMs are already better than the ±10 m specification. The detailed statistics of the mean absolute height offset in the input DEMs for different acquisition coverages is listed in Table 2. For most of the outlying 13% of the scenes, the height of ambiguity band was not correctly resolved in the first interferometric processing attempt and will be corrected before the final mosaicking.
3.2 Interferometric Performance of Single Acquisitions
The key parameter for the evaluation of the interferometric performance is the coherence, which gives a measure for the amount of noise in the interferogram (Martone, 2012). Up to February 2015, more than 458,000 scenes have been processed and the mean coherence value of more than 89% of all scenes (with water bodies being filtered out) is higher than 0.6, where 0.6 is considered as a reliable reference value for interferometric processing (Figure 3).
Figure 2. Long-term evolution of the estimated baseline bias: radial and cross-track components in red and green, respectively. The solid lines show the fitted mean values.
Figure 3. Histogram of mean coherence of land per scene. The red and the green dotted line give the relative occurrence of coherence over 0.6 and 0.8, respectively (February 2015)
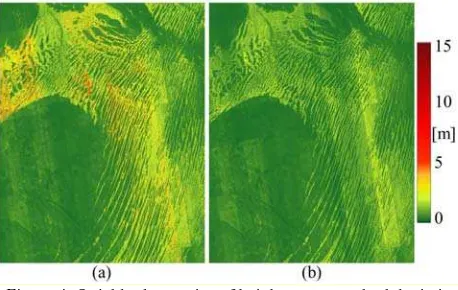
Figure 4. Quicklook mosaics of height error standard deviation per pixel over the Sahara desert, generated by combining first year and second year coverages only (a) and adding desert acquisitions (b).
In order to get an overview of the height error performance, quicklook images annotated to each processed DEM scene can be combined to a global mosaic (Bräutigam, 2012), (Rizzoli, 2014). Figure 4(a) shows the relative height error standard deviation quicklook map over the Sahara desert with a resolution of 500 m by 500 m. These maps can be used to identify areas which need further acquisition in order to achieve the specified performance. The combination of multiple coverage acquisitions over the same area will consequently shift the relative height error of the final global DEM into its accuracy specifications; see example improvement in Figure 4(b).
Low- and high-relief terrain can be properly distinguished by applying a threshold at 20% on a slope map, which is derived by evaluating the bidimensional gradient of the corresponding TanDEM-X quicklook DEM, as presented in (Rizzoli, 2012) (84.4% of the covered land is characterized by low-relief terrain). The required point-to-point relative height error confidence level is then derived from these two distributions (Gonzalez, 2014). The confidence level of the global relative height error for different acquisition coverages are listed in Table 2. It can be seen that the supporting acquisition phases – although over difficult terrain – significantly contribute with a good performance. This is due to the optimized acquisition strategy as an outcome of the continuous mission monitoring.
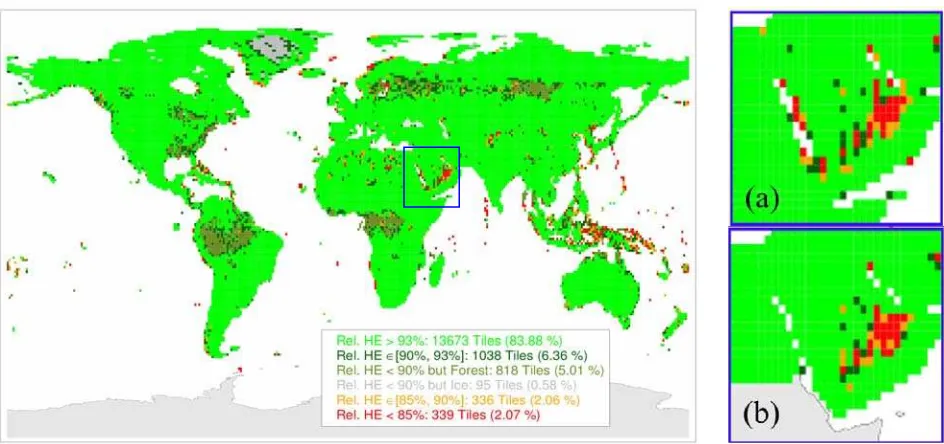
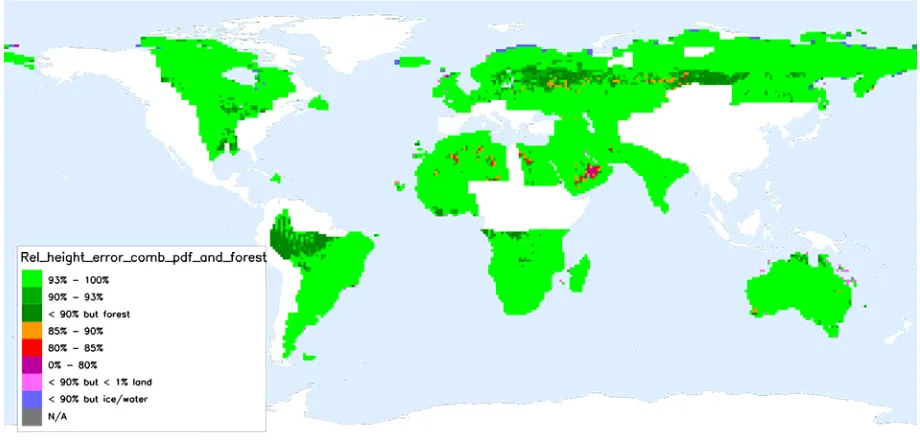
A global map of the relative height error confidence level for the final DEM tiles, derived from the quicklook mosaic of the relative height error of all the available TanDEM-X coverages up to September 2014, is depicted in Figure 5. As it can be seen, the relative height error can be achieved for more than 90% of all the tiles. Highly vegetated and snow-covered tiles which do not achieve the TanDEM-X specification are identified in grey. Such tiles are not taken into account for the evaluation of the global mission performance.
4. QUALITY OF FINAL DEM PRODUCTS
The final global DEM is produced in blocks of several hundreds of tiles. 8,856 final DEM tiles have been generated as of February 2015. Each DEM product contains a relative height error map as well as annotation statistics about the absolute error.
4.1 RELATIVE HEIGHT ACCURACY
The relative height accuracy of a DEM is important for derivative products that make use of the local differences between adjacent elevation values, such as slope, aspect calculations and drainage networks. It accounts only for random errors. The DEM cells are generated by mosaicking different Figure 5. Confidence level of the relative height error for final DEM tiles, derived from the quicklook mosaic of the relative height
error standard deviation. Subfigures (a) and (b) over the Arabian Peninsula present the confidence level per tile derived from the quicklook mosaic compared to the height error confidence level of the final TanDEM-X DEM at full resolution, respectively.
Mean Coherence > 0.6 Relative Height Error Confidence Mean Height Offset < 10 m
1st Global Coverage 84.1% 88.0% (flat) 91.1% (steep) 93.6%
2nd Global Coverage 86.6% 90.0% (flat) 89.9% (steep) 92.0%
Additional Coverage 88.5% 68.6% (flat) 82.9% (steep) 85.2%
Desert Acquisitions 96.4% 90.8% (flat) 89.8% (steep) 89.2%
Difficult Terrain
(opposite viewing direction)
93.3% 81.6% (flat) 92.3% (steep) 74.0%
Combined Quality 89.3% 96.8% (flat) 98.8% (steep) 87.6%
Table 2. Quality of over 458,000 DEM scenes from single coverages processed as of February 2015. 64% of these scenes are from the two global coverages. Percentages for coherence and absolute height offset are derived from the mean value per scene of all respective acquisitions. The relative height error analysis gives the confidence level for achieving the 2 m (flat) and 4 m (steep) specification. Relative height error data is based on quicklook map evaluation with a resolution of 300 m by 300 m.
acquisitions. As the heights are combined as a result of a weighting process, the corresponding height error standard deviations per pixel are also weighted (Wessel, 2013). The single-point height accuracy per pixel is saved into a height error map inside the TanDEM-X product. The height accuracy over a tile can be computed by summing the Gaussian error distribution functions of all pixels, separated by flat and steep terrain. The combined confidence level is calculated based on the sum of the areas under the sum probability densities (Gonzalez, 2014)
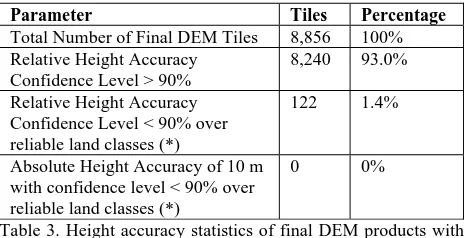
Table 3 shows that 8,240 out of 8,856 DEM tiles have a relative height accuracy of more than 90% for the specified 2 m (4 m) of flat (steep) terrain. Further 72 tiles are not evaluated due to too few data points (e.g. small islands) or sea ice coverage. On top of that, we identified 422 tiles with lower relative height accuracy, but which are dominated by highly forested areas. Due to volume decorrelation effects, the estimated height error
is artificially increased over forest. Figure 6 shows the global map of available DEM tiles with their final confidence level of the relative height accuracy. As expected from the performance prediction (Figure 5), mainly arid desert regions have lower performance (Martone, 2014). Hence, up to now only 122 tiles (less than 1.4%) do not meet the relative height accuracy specification.
4.2 ABSOLUTE HEIGHT ACCURACY
To sell off the absolute height accuracy global specification, the majority of ICESat points that have not been used in the calibration were chosen as a worldwide data set for validation of the TanDEM-X data (Huber, 2009). When evaluating this global specification, only the first 1,000 points per tile with the lowest height variation between pixels within an ICESat footprint are considered. Consequently, tiles with fewer validation points (e.g. coastal regions) are evaluated with Figure 6. Global map showing confidence level for relative height accuracy (2 m for flat and 4 m for steep terrain) per DEM tile (status February 2015).
Figure 7. Global map showing 90% absolute height accuracy per DEM tile in meters (status February 2015).
Table 3. Height accuracy statistics of final DEM products with status of February 2015. (*)Tiles with unreliable data, e.g. over forest or sea ice, are filtered out in the accuracy calculations.
similar weights as tiles with more copious validation points. As the ICESat data is laser-based, there can be an offset to the radar based TanDEM-X measured height, especially over vegetation or snow where the signal penetration of the two systems can differ.
The most current height statistics, as of February 2015, of the available DEMs is shown in Table 4. Of all the ICESat data points that overlap with the available TanDEM-X data (on the order of 35 million), approximately 8 million are within the top 1,000 points that will be used for the validation. The mean of the height deviation between the validation points and the DEM data is quite small, only 15 centimeters. The linear accuracy of the validation points for 10 meters is very high at 99.7%. The system specification of an absolute global height accuracy of less than 10 meters with a 90% linear error is met and far exceeded with an accuracy of 1.09 meters.
The absolute height error of the final TanDEM-X DEM products can be validated by comparing the TanDEM-X heights against accurate reference points (Huber, 2009). By weighting the mean offset per tile with the used number of ICESat validation points, we get an absolute height offset of +0.28 m in average with a standard deviation of 1.36 m. The global absolute height accuracy will finally be determined from the cumulative statistics of all comparisons against the ICESat validation points. The corresponding results are shown in Table 4. The 361 final DEM tiles containing GPS tracks have also a very low absolute offset of -0.21 m in weighted average with a standard deviation of less than 2.0 m.
In addition to the global specification, the absolute height accuracy is also monitored on a tile basis for all validation points in the tile. Only eleven out of the 8,856 tiles have an absolute height accuracy greater than 10 m, which is below the 90% specification. However these eleven tiles contain too few validation points or too few data points, hence there are no DEM products violating the absolute height specification (see Table 3). Figure 7 shows a per tile overview of the absolute height error for the available tiles. The vast majority of these tiles have an absolute height accuracy of less than 5 meters, and 148 tiles are between 5 and 10 meters. It is expected that the quality of DEMs over more mountainous terrain will impact the global statistics.
5. QUALITY SUMMARY
The TanDEM-X mission is generating a high-resolution and very accurate digital elevation model (DEM) using single-pass SAR interferometry. The Earth’s land masses are systematically mapped multiple times, where difficult terrain like steep mountains is covered at least four times. The systematic data
Parameter Value
Number of Final DEM Tiles 8,856 Accumulated Number of Validation Points 8,008,514 Mean Height Deviation
of Validation Points (m)
0.15
Accumulated Absolute Height Accuracy of 10 m (linear error)
99.7%
Accumulated Absolute Height Accuracy with 90% Linear Error (m)
1.09
Table 4. Global absolute height accuracy over all validation points (status February 2015).
acquisition phase has been competed in August 2014. Continuous data monitoring provided a quick performance feedback on a per scene basis or at quicklook resolution. Regions with lower performance, e.g. over sandy deserts, could be re-acquired with an optimized acquisition scenario. The majority of the data shows a reliable data basis as the mean coherence is above 0.6 for almost 90% of the data. The interferometric calibration of the SAR data pairs has further pushed the initial height accuracy of the majority of scenes (87%) to better than 10m. In total, over 458,000 scenes have been analysed in this work.
The final DEM will be produced by calibrating and mosaicking all these individual DEM scenes into a homogeneous data set consisting of almost 20,000 tiles. Each tile has a size of about 110 km by 110 km. Up to February 2015, 8,856 final DEM tiles have been completed and analysed for this paper. The final quality of these DEM products is well within the specified accuracy range. The relative height accuracy has already been predicted by using quicklook products of the input scenes. It corresponds very well with the first final DEM data. The absolute height accuracy far exceeds the specification as the first DEM data has been generated for mainly moderate terrain types. It is expected to complete the processing of the global DEM by the second half of 2016. Until then, the quality monitoring process will be further continued.
ACKNOWLEDGEMENTS
The TanDEM-X project is partly funded by the German Federal Ministry for Economics Affairs and Energy (Förderkennzeichen 50 EE 1035).
REFERENCES
D. Borla Tridon, M. Bachmann, D. Schulze, M. D. Polimeni, M. Martone, J. Böer, M. Zink, 2014. „TanDEM-X DEM Difficult Terrain & Antarctica Acquisitions towards the Planning of the Science Phase”, European Conference on Synthetic Aperture Radar (EUSAR), Berlin, Germany.
D. Borla Tridon, M. Bachmann, D. Schulze, C. Ortega-Míguez, M. D. Polimeni, M. Martone, J. Böer, M. Zink, 2014b. „TanDEM-X: DEM acquisition in the third year era”, International Journal of Space Science and Engineering, vol. 1, no. 4.
B. Bräutigam P. Rizzoli, M. Bachmann, 2012. “Global Performance Monitoring from TanDEM-X Quicklook Data,” European Conference on Synthetic Aperture Radar, Nuremberg, Germany.
B. Bräutigam, M. Bachmann, D. Schulze, D. Borla Tridon, P. Rizzoli, M. Martone, C. Gonzalez, M. Zink, G. Krieger, 2014. “TanDEM-X Global DEM Quality Status and Acquisition
Parameter Tiles Percentage
Total Number of Final DEM Tiles 8,856 100% Relative Height Accuracy
Confidence Level > 90%
8,240 93.0%
Relative Height Accuracy Confidence Level < 90% over reliable land classes (*)
122 1.4%
Absolute Height Accuracy of 10 m with confidence level < 90% over reliable land classes (*)
0 0%
Completion”, IEEE International Geoscience And Remote Sensing Symposium, Montreal, Canada, 2014.
H. Breit, M. Younis, U. Balss, A. Niedermeier, C. Grigorov, J. Hueso Gonzalez, G. Krieger, M. Eineder, T. Fritz, 2011. "Bistatic synchronization and processing of TanDEM-X data," IEEE International Geoscience and Remote Sensing Symposium, Vancouver, Canada.
T. Fritz, H. Breit, C. Rossi, U. Balss, M. Lachaise, S. Duque, 2012. “Interferometric processing and products of the TanDEM-X mission”, IEEE International Geoscience and Remote Sensing Symposium, Munich, Germany.
C. Gonzalez, B. Bräutigam, M. Martone, P. Rizzoli, 2014. “Relative Height Error Estimation Method for TanDEM-X DEM Products”, European Conference on Synthetic Aperture Radar, Berlin, Germany.
J. Hueso González, J. Walter Antony, M. Bachmann, G. Krieger, M. Zink, D. Schrank, M. Schwerdt, 2012. “Bistatic system and baseline calibration in TanDEM-X to ensure the global digital elevation model quality”, ISPRS Journal of Photogrammetry and Remote Sensing.
M. Huber, B. Wessel, D. Kosmann, A. Felbier, V. Schwieger, M. Habermeyer, A. Wendleder, A. Roth, 2009. “Ensuring Globally the TanDEM-X Height Accuracy: Analysis of the Reference data sets ICESat, SRTM and KGPS-Tracks”, IEEE International Geoscience and Remote Sensing Symposium, Cape Town, South Africa.
G. Krieger, A. Moreira, H. Fiedler, I. Hajnsek, M. Werner, M. Younis, M. Zink, 2007. “TanDEM-X: A Satellite Formation for High Resolution SAR Interferometry”, IEEE Transactions on Geoscience and Remote Sensing, vol. 45, no. 11.
G. Krieger, F. De Zan, M. Bachmann, J. Hueso Gonzalez, M. Rodriguez Cassola, M. Zink, 2012, “Unexpected Height Offsets in TanDEM-X: Explanation and Correction,” IEEE: International Geoscience And Remote Sensing Symposium, Munich, Germany,
G. Krieger, M. Zink, M. Bachmann, B. Bräutigam, D. Schulze, M. Martone, P. Rizzoli, U. Steinbrecher, J. W. Antony, F. De Zan, I. Hajnsek, K. Papathanassiou, F. Kugler, M. Rodriguez Cassola, M. Younis, S. Baumgartner, P. López-Dekker, P. Prats, A. Moreira, 2013. “TanDEM-X: A radar interferometer with two formation-flying satellites”, Acta Astronautica, 89 (2013) 83–98.
M. Lachaise, U. Balss, T. Fritz, H. Breit, 2012. “The Dual Baseline Interferometric Processing Chain for the TanDEM-X Mission,” IEEE: International Geoscience And Remote Sensing Symposium, Munich, Germany, 2012.
M. Martone, B. Bräutigam, P. Rizzoli, C. Gonzalez, M. Bachmann, G. Krieger, 2012. “Coherence evaluation of TanDEM-X interferometric data”, ISPRS Journal of Photogrammetry and Remote Sensing.
M. Martone; B. Bräutigam; P. Rizzoli; G. Krieger, 2014. „TanDEM-X Performance over Sandy Areas”, European Conference on Synthetic Aperture Radar, Berlin, Germany.
E. Maurer, R. Kahle, G. Morfill, B. Schlepp, S. Zimmermann, 2014. “Reversal of TanDEM-X’s Relative Motion From Counter-Clockwise to Clockwise,” International Conference on Space Operations, Pasadena, CA.
P. Rizzoli; B. Bräutigam; T. Kraus; M. Martone; G. Krieger, 2012. “Relative Height Error Analysis of TanDEM-X Elevation Data”, ISPRS Journal of Photogrammetry and Remote Sensing, vol. 73.
P. Rizzoli; M. Martone; B. Bräutigam, 2014. “Global Interferometric Coherence Maps From TanDEM-X Quicklook Data”, IEEE Geoscience and Remote Sensing Letters, vol. 11, no. 11.
C. Rossi, R. Rodriguez Gonzalez, T. Fritz, N. Yague Martinez, M. Eineder, 2012. “TanDEM-X calibrated RawDEM generation,” ISPRS Journal of Photogrammetry and Remote Sensing.
J. Walter Antony, J. Hueso González, M. Schwerdt, M. Bachmann, G. Krieger, M. Zink, 2013. “Results of the TanDEM-X Baseline Calibration”, IEEE Journal of Selected Topics in Applied Earth Observations and Remote Sensing.
B. Wessel, U. Marschalk, A. Gruber,M. Huber, T. Hahmann, A. Roth, M. Habermeyer, 2008. „Design of the DEM Mosaicking and Calibration Processor for TanDEM-X,”, European Conference on Synthetic Aperture Radar, Friedrichshafen, Germany.
B. Wessel, A. Gruber, A. Wendleder, M. Huber, M. Breunig, U. Marschalk, D. Kosmann, A. Roth, 2011. “Production Chain towards First Calibrated and Mosaicked TanDEM-X DEMs,” IEEE International Geoscience And Remote Sensing Symposium, Vancouver, Canada.
B. Wessel, 2013. TanDEM-X DEM Products Specification, DLR Public Document, TD-GS-PS-0021, Issue 3.0.