ANALYTICAL HIERARCHY PROCESS MODELING FOR MALARIA RISK ZONES IN VADODARA DISTRICT, GUJARAT
Bindu Bhatt a, Janak P Joshib a
Professor, Department of Geography, Faculty of Science, The Maharaja Sayajirao University of Baroda, Vadodara [email protected]
b
Research Scholar, Department of Geography, Faculty of Science, The Maharaja Sayajirao University of Baroda, Vadodara [email protected]
ISPRS Technical Commission VIII Mid -Term Symposium 2014
KEY WORDS: Malaria, Analytical Hierarchy Process (AHP), Multi Criteria Evaluation (MCE), Annual Parasitic Index (API) Vadodara
ABSTRACT:
Malaria epidemic is one of the complex spatial problems around the world. According to WHO, an estimated 6, 27, 000 deaths occurred due to malaria in 2012. In many developing nations with diverse ecological regions, it is still a large cause of human mortality. Owing to the incompleteness of epidemiological data and their spatial origin, the quantification of disease incidence burdening basic public health planning is a major constrain especially in developing countries.
The present study focuses on the integrated Geospatial and Multi-Criteria Evaluation (AHP) technique to determine malaria risk zones. The study is conducted in Vadodara district, including 12 Taluka among which 4 Taluka are predominantly tribal. The influence of climatic and physical environmental factors viz., rainfall, hydro geomorphology; drainage, elevation, and land cover are used to score their share in the evaluation of malariogenic condition. This was synthesized on the basis of preference over each factor and the total weights of each data and data layer were computed and visualized. The district was divided into three viz., high, moderate and low risk zones .It was observed that a geographical area of 1885.2sq.km comprising 30.3% fall in high risk zone. The risk zones identified on the basis of these parameters and assigned weights shows a close resemblance with ground condition. As the API distribution for 2011overlaid corresponds to the risk zones identified.
The study demonstrates the significance and prospect of integrating Geospatial tools and Analytical Hierarchy Process for malaria risk zones and dynamics of malaria transmission.
1. INTRODUCTION
The threats to human health from vector bore diseases especially mosquito borne diseases like malaria, dengue, elephantiasis etc. continue to be a global problem. The increasing trend of environmental change is significantly changing malaria pattern at the local and as well as global scales. Distribution of malaria is governed by a large number of factors relating to the parasite, the vector and the host (Molineaux 1988). Factor like change in land-use pattern, settlement patterns, ongoing urban development activities, indiscriminate use of insecticides, drug resistance of malarial parasites, rise in temperature, population movements and degree of deforestation are resulting in increase of malaria and the disease control is becoming difficult.
Also seasonality, proximity to breeding grounds, vector density, biting rates, and proportion of infectious mosquitoes, contribute to the spread of mosquito-borne diseases. Hence, efforts to correlate malaria and the environment are computed as the latter influences development of both parasite and the vector. Therefore, combination of human factors and relevant environmental information to the malaria biology might indicate a predominant epidemiologic situation, making the action of health services easier. It is still a large cause of human mortality, and controlling it not only requires case detection and treatment, but control of mosquito vectors and their habitats. However, resources targeted at malaria control are frequently limited and inadequate; in the developing nations, the incompleteness of epidemiological data obstructs the quantification of disease incidence, which burdens basic public health planning.
Mapping malaria cases can help health authorities to understand more about spatial distribution of the disease in their area as well as its temporal occurrence. The provided information can
help control programs and for preparing health facilities based on the requirement of each area. Spatial models for the study and management of vector-borne disease risk have become common with the increase of digital environmental data and geospatial tools. Such models often help identify the underlying factors contributing to vector-borne disease risk and burden. In this context Remote Sensing and Geographic Information System (RS and GIS) can best fit to investigate the root problem both spatially and temporally. GIS also enable us to generate revised maps as soon as new data are available (Srivastava et al., 2009). In conjunction with Multi Criteria evaluation, GIS have been widely applied to vector-borne disease risk mapping. In its most basic form, MCE is a structured tool that allows for the evaluation of alternatives based on multiple, possibly conflicting or even incommensurate criteria in a decision problem. MCE based approaches begin with an intelligence phase where the problem definition, decision constraints and evaluation criteria are defined.(Malczewski J:1999)
This study can help identifying risk areas adding to the efficiency of prevention efforts and will contribute as means of targeting high risk areas, which help to organize efforts towards the fight against malaria efficiently. In addition, it can predict possible malaria incidences.
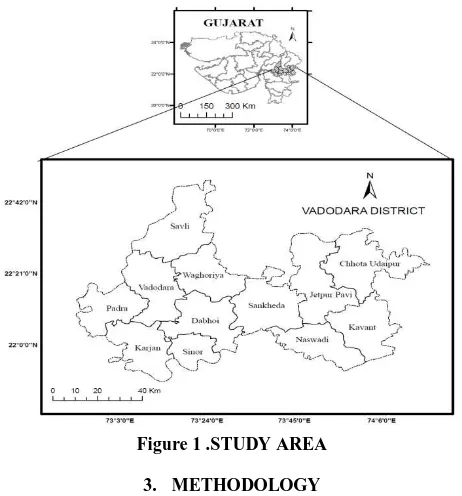
2. THE STUDY AREA
Vadodara District is situated between 21° 49´ and 22° 47´ N latitudes and 72° 50´ and 74° 17´ E longitudes, occupying 7,550 sq.km. area. The district has 12 Taluka with total population of 4,157,568 (Census, 2011). 4 Talukas on eastern boundary are predominantly tribal. The area is characterized by rugged and undulating topography owing to the offshoots of hilly tracts in the east, covered by the deciduous vegetation while the western region is vast alluvial plains. Kawant Taluka has the maximum hilly terrain. The area is drained by the Dhadhar R. and Orsang River a The International Archives of the Photogrammetry, Remote Sensing and Spatial Information Sciences, Volume XL-8, 2014
tributary of Narmada River. The district is situated in the tropical region is relatively dry except the month of monsoon i.e. June to September. The temperature in summer may go up to 45°C and in winter temperature recorded is about 10°C except some extreme and the district receives on an average rainfall of 900 mm.
Figure 1 .STUDY AREA
3. METHODOLOGY
The complex epidemiology of vector-borne diseases creates significant challenges in the design and delivery of prevention and control strategies, especially in light of rapid social and environmental changes. Here Remote Sensing, GIS and Multi-Criteria Evaluation based approach is used as geospatial models and spatially precise decision support tools for the management of vector-borne diseases.
The Analytic Hierarchy Process (AHP) Saaty (1980), method is one of the more widely used Multi Criteria approach. This method based on the concept of pair-wise comparisons to create a ratio matrix and estimate a ranking or weighting of each of the criteria. It takes the pair-wise comparisons as input and produces the relative weights as output. This comparative analysis is a multiple-criteria evaluation, where the alternative products are ranked at the end of the evaluation. Different criteria have different levels of importance and enables criteria weighting to take care of their relative importance.
AHP procedure is terminated at the attribute level, and the attribute weights are assigned to the attribute map layers and processed in the GIS environment. This approach is referred to as spatial AHP (Banai-Kashani, 1989; Eastman et al., 1993; Malczewski, 1999, David Chikodzi, 2013).
Integration of AHP in GIS has helped us to be more precise in defining risk areas of Malaria in decision-making and authorities can respond faster to situations before cases occur. 3.1 Data Set:
Predominant among these are climatic and environmental factors, particularly those that affect habitat and breeding sites of the anopheline vectors such as temperature, precipitation, humidity, presence of water, vegetation and man to vector contact, also drainage density (Windmeijer & Andriesse ,1993) Environmental factors, such as temperature, humidity, rainfall and wind patterns have great impact on mosquito reproduction, development and longevity and the parasite survival in its life
cycle in mosquito. It is known that mosquito breeding is influenced by temperature - a change in temperature from 12°C to 31°C reduces the number of days required for breeding from 65 days to 7.3 days (Li J et. al.2002)
3.2 Malaria Risk Factors
a) Geomorphology: Malaria risk is linked inextricably to the hydrological and geomorphologic processes that form vector breeding site. Larval source management is a promising component of integrated malaria control and elimination. This requires development of a framework to target productive locations through process-based understanding of habitat hydrology and geomorphology( Hardy et al,2013), Hydrological and geomorphological processes governing the availability and productivity of Anopheles breeding habitat need to be understood at the local scale for which larval source management is implemented in order to effectively target larval source interventions. Mapping and monitoring these processes is a well-established practice providing a tractable way forward for developing important malaria management tools. (Smith et al 2013)
This map is extracted and digitized from the geo hydrological Atlas of Gujarat prepared by SAC. This map gives the information of the landforms like plains, hill, and plateaus along with its formation and state i.e. erosion prone surface or erosion resistant etc thus it acts as the signature of the topography of the study area. The study area represents three different physiographical divisions, the eastern part is hilly undulating followed by piedmont zone and in the western part are the alluvial planes. The slope is due south west direction as apparent from the figure.
Figure 2 Hydro-Geomorphology
b) Drainage Density: Drainage network is considered as expression of climate, vegetation and soil (Molgen et al 1998) The study area is largely drained by two large river systems namely Mahi and Narmada. The Mahi River outlines the district in the west and its tributaries drain the western region of the study area. The Narmada River is in the south of the study area, its main tributary Orsang River drains the whole eastern part of the study area and central part is drained by the Orsang River and its tributaries. Drainage density proved to be a highly significant predictor because of its association with swamps; thus, the distance and the area of the swamp represent the most suitable habitat for the mosquito's life cycle. Water bodies (brooks, ponds, lakes, rivers, streams and springs) may not be clearly detected; therefore, drainage density was calculated by dividing the length of streams and river networks by the basin area. The low density drainage density represents permeable rocks, low rainfall area, sandy soil The International Archives of the Photogrammetry, Remote Sensing and Spatial Information Sciences, Volume XL-8, 2014
types and good vegetation cover, while flat areas with the high density, impermeable rock, high rainfall, clay soil and little vegetation. The drainage density is relatively high in the eastern region were as its low in the plains. Along with the natural drainage system the regions also has network of Narmada main, branch and sub branch canals of the Narmada irrigation project.
Figure 3 Drainage Network
c) Elevation: defines the ecology of malaria transmission through temperature. At certain altitudes malaria transmission does not occur because of extreme temperatures that inhibit the mosquito and parasite life-cycle. Slope together with rainfall amounts received at a place can influence the spread of malaria. Areas on flat ground are most likely to accumulate and dam rain water thereby increasing the risk of malaria. DEM is prepared to determine how topography and terrain characteristics are associated with the availability and stability of mosquito breeding habitats and malaria transmission. SRTM 90 m. is used to generate DEM.
Figure 4 Physiography
d) Rainfall: Rainfall is a key determinant of malaria transmission [Smith et al,2013), as it governs the availability of aquatic habitats required for breeding by vector mosquitoes. Despite this, observed relationships between rainfall and malaria transmission are variable (Zhang,Y et al,2008) . As humidity is favourable to mosquito growth, rainfall and stagnant water bodies also influence mosquito density.
Figure 5 Annual Rainfall 2011
e) Landcover/ Landuse (LCLU) :Landcover and landuse type of an area are important risk factors to malaria transmission. Marsh clearance, dam construction and crop cultivation also increase the risk of malaria at local scale
The LULC map was prepared with the help freely downloadable satellite images of Landsat 7 ETM+ 30 meter resolution and Google earth which resembles a broad level of classification primarily the agriculture, built-up, water bodies and vegetation cover, waste land, scrubland and others. With other factors land use / land cover changes have been fueled to promoting the vector borne disease epidemics in newer areas (Bouma M, et al, 1995, Tyagi BK, et al., 1995)
Figure 6 Landuse/Land Cover
f) Epidemiological Data: A PHC based data of malaria cases at micro level (i.e. Village level) for 2011 is obtained from District Malaria Office Vadodara. The data of around 1530 villages reported at 80 PHC in the study area is used for the analysis. These data are based on passive detection, mainly established malaria cases reported by PHC. The data do not provide information on parasite species. So, the data only include symptomatic cases. There may be a significant number of asymptomatic cases among repeatedly infected adults. In addition, there are an unknown number of symptomatic cases among the migrant and displaced people who may not have sought or received treatment from public health organizations for a variety of reasons. The malaria cases used in the analyses therefore reflect the lower bound of the true prevalence. API was calculated as
Total No of Blood Smear Positive for Malaria parasite in year/ Total Population *1000 (1)
The highest API observed was around 29, in the ode village of the Chhota Udaipur and there are total 9 villages having more than 10 The International Archives of the Photogrammetry, Remote Sensing and Spatial Information Sciences, Volume XL-8, 2014
API. Among these high incidence villages 7 are located mainly
The process of deriving the weights of each factor involved the following steps: 1. Formulation of a pair-wise comparison matrix for each of the input parameters. And of the relative weights of each input parameter was assigned.
The risk factors do not have the same role and weight in the modeling of the final malaria risk zones. In order to designate the importance of each parameter, we weighted them using a pair wise comparison method which is one of the components of AHP. To assist in the weighting process of the pairwise matrix, the Saaty’s pair wise comparison table was used.
Intensity of importance
Definition of Explanation
1 Equal importance Two factors contribute equally to the objective
Table 1. Saaty’s pair wise comparison table with 9 degrees
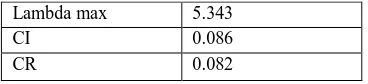
Parameter After computing the pair wise matrix, a measure of consistency was used to check if the matrix was derived at an acceptable level of consistency. (Saaty, 1980)
Consistency index, CI is given by
CI=[λmax-n]/[n-1] (2) Where n is the dimension of comparison matrix, λ max is the maximum Eigen value of the comparison matrix.
P
Table 4 Random Consistency Index
Consistency Ratio, which is a comparison between Consistency Index and Random Consistency Index
CR=CI/RI (3) The appropriate Consistency index is called Random Consistency Index (RI). In practice, a CR of 0.1 or below is considered acceptable. Any higher value at any level indicates that the judgments warrant reexamination. Thus, CR reflects the consistency of one’s judgment. If the value of Consistency Ratio is smaller or equal to 10%, the inconsistency is acceptable. If the Consistency Ratio is greater than 10%, we need to revise the subjective judgment.(Satty,1980). In this study, a consistency ratio of 0.08 is obtained which is less than 0.10, the ratio indicate a reasonable level of consistency in the pair-wise comparisons. Since, CR < 0.1, the judgments are acceptable. The value of CR=0.08 is acceptable suggesting judgment of parameters weight in identifying risk zones for malaria is agreeable.
Table 5 Consistency value
Hazard map, i.e. a map that highlights areas which are vulnerable for breeding and maintenance of malaria vectors and parasites, was prepared by weighting and overlaying environmental factors (Jeefoo et al., 2008). Every layer was then re-classified based on these ranks. Rating was standardized followed by using analyst of Arc GIS software. Re-classified layers were multiplied by their standard weight and then added to others for providing the hazard/risk layer/maps. The accuracy in risk map was assessed by comparing with the spatial distribution of API in study area. The obtained risk map was then divided into high, moderate and low risk areas as three strata for planning control interventions.
Lambda max 5.343
CI 0.086
CR 0.082
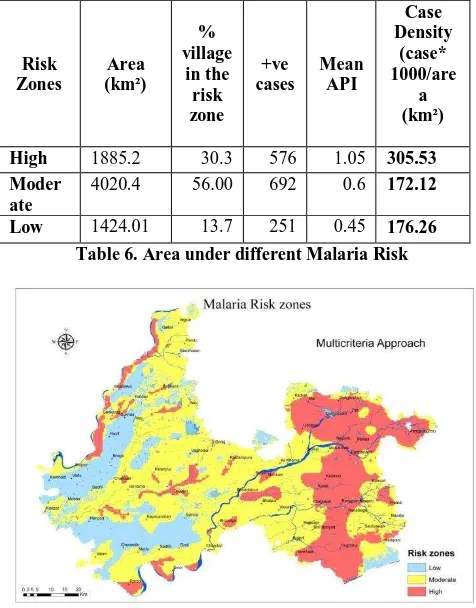
4. RESULTS AND DISCUSSION:
The influence of climatic and physical environment factors namely rainfall, hydro geomorphology; drainage density, elevation, and land cover were used to score their share in the evaluation of the conducive for the malariogenic condition. This was synthesized on the basis of preference over each factor and the total weights of each data and data layer were also computed. Finally, the situation in the entire area is visualized. Integration of this method, enabled to identify the spatial interaction of the multitude factors as per their influence and identify the problematic region.
The district was divided into three viz., high, moderate and low risk zones. It was observed that a geographical area of 1885.2 sq.km comprising 30.3% fall in high risk zone.
Risk
Figure 7. AHP derived Malaria Risk Zones
The risk zones identified on the basis of the parameters and assigned weights show a close resemblance with ground condition. The isolines representing API for the year 2011 was overlaid on the risk zones. This indicates PHCs of Eastern region namely Zoz, Malaza, Dungarbhint, Tejgadh, Rangpur, Dughdha falls into high risk zone.
Also the villages around high risk areas have very high annual parasite index which validates the influence of the physical factors influence the malaria incidence and transmitivity in the region.
This phenomenon can be perhaps attributed to the small streams and rivulets which are non perennial, in due course of time after monsoon, the water in it depletes and several stagnant water pools are formed.
Figure 8. Malaria risk zones overlaid with API isolines Also wet paddy cultivation, rock mining and mineral mining make anthropogenic reservoirs contribute to high risk. In the western and central part of the Vadodara district were having API in the range of 1- 2 which shows the condition is stable throughout the region also the environmental factors are relatively less conducive as compared to the eastern region.
The southern and eastern parts of the study area are rendered inaccessible in combination of the PHC availability and road connectivity (Bhatt.B, Joshi, J, 2013). Hence, this could be another factor for not seeking timely and complete treatment by tribal population.
5. CONCLUSION:
Therefore, it can be concluded that MCE -GIS based model combination has potentiality to provide rational and non-bias approach in making decisions in public health. AHP integrated with Geospatial technique is a decision support tool that allows for the consideration of diverse quantitative and qualitative criteria using both data-driven and qualitative indicators for evaluating alternative strategies with transparency and stakeholder participation.
The model can also be used to understand the dynamics of malaria transmission like better understanding of the effects on a malaria outbreak of interventions such as residual spraying and bed net use. This can be used to explain why certain places prone to malaria do not have any outbreaks at all. As future scope, this study can be enhanced by adding micro level information such as demographic characteristic, socio-economic and cultural components, health care and health care services.
6. ACKNOWLEDGEMENT
We would like to express our gratitude to Indian Council of Medical Research (ICMR), New- Delhi (5/8-7(204/2009-ECD-II) for granting financial aid.
REFERENCES:
Banai-Kashani, R. 1989. A new method for site suitability analysis: the analytic hierarchy process. Environmetal Management 13(6); 685-693.
Bhatt.B ,Joshi.J (2013) A geospatial approach for assessing and modeling spatial accessibility of the primary health centers in the tribal Talukas of the Vadodara district International Journal of Geomatics and Geosciences Volume 3, no 3, 2013 The International Archives of the Photogrammetry, Remote Sensing and Spatial Information Sciences, Volume XL-8, 2014
Bhatt.B ,Joshi.J, 2014 ,ICMR unpublished report.
Bouma M, et al, 1995. Epidemic malaria in India’s Thar Desert. Lancet 346: 1232–33
David Chikodzi, “Spatial Modelling of Malaria Risk Zones Using Environmental, Anthropogenic Variables and Geogra-Phical Information Systems Techniques.” Journal of Geosciences and Geomatics 1, no. 1 (2013): 8-14. doi: 10.12691/jgg-1-1-2.
Eastman, J. R., Kyem, P. A. K., Toledano, J. and Jin, W. (1993). GIS and decision making. Geneva: The United Nations Institute for Training and Research (UNITAR) Hardy Andrew J., Javier G. P. Gamarra, Dónall E. Cross,Mark G. Macklin,Mark W. Smith, Japhet Kihonda,Gerry F. Killeen,George N. Ling’ala, Chris J. Thomas Habitat: Hydrology and Geomorphology Control the Distribution of Malaria Vector Larvae in Rural Africa Published: December 03, 2013 DOI: 10.1371/journal.pone.0081931
Jeefoo, P., Tripathi, N.K., Hara, S., 2008. Analytical hierarchy Process modeling for malaria risk zonation in Kanchanaburi, Thailand. In: International Symposium on Geo-informatics for Spatial Infrastructure Development in Earth and Allied Sciences, 4–6 December, Vietnam.
Li.J., Welch RM, Nair US, Sever TL, Irwin DE, Cordon-Rosales C, Padilla N: Dynamic Malaria Models with Environmental Changes. In Proceedings of the Thirty- Fourth South-eastern Symposium on System Theory. Huntsville, AL; 2002:396-400.
Malczewski, J. (1999). GIS and multicriteria decision analysis. New York: John Wiley & Sons, Inc. New York, USA.
Molgen.G.G.et.al 1998 On Sensitivity to Climate Change Water Resources Res 34(4) 855-862
Molineaux L (1988). The Epidemiology of Human Malaria as an Explanation of its Distribution, Including Some Implications for its Control. In: Wernsdorfer, W.H., AND McGregor, I (Eds.) Malaria, Principles and Practice of Malariology vol. 2, Churchill Livingstone, New York, 913– 998
Satty,T,1980 The Analytic Hierarchy Process, New York: McGraw Hill. International, Translated to Russian, Portuguese, and Chinese, Revised editions, Paperback (1996, 2000), Pittsburgh: RWS Publications.2001
Smith MW, Macklin MG, Thomas CJ (2013) Hydrological and geomorphological controls of malaria transmission. Earth Science Reviews 116:109-127.10.1016/j.earscirev.2012.11.004
Srivastava, A., Nagpal, B.N., Joshi, P.L., Paliwal, J.C., Dash, A.P., 2009. Identification of malaria hot spots for focused intervention in tribal stat of India: a GIS based approach. Int. J. Health. Geog. 8, 30
Tyagi BK, et al.,. 1995. Epidemic malaria in Thar Desert. Lancet 346: 634–35.
Windmeijer, PN and W Andriesse (Eds.) (1993) Inland valleys in West Africa. An Agro-ecological characterization of rice-growing environments. Publication 52. International Institute for Land Reclamation and Improvement, Wageningen, The Netherlands. p 160.
Zhang Y, Bi P, Hiller JE (2008) Climate change and the transmission of vector-borne diseases: a review. Asia Pac J PublicHealth 20:64- 6. PubMed: