IMAGE SELECTION FOR 3D MEASUREMENT BASED ON NETWORK DESIGN
T.Fuse a, *, R.Harada a,
a Dept. of Civil Engineering, University of Tokyo, Hongo 7-3-1, Bunkyo-ku, Tokyo, 113-8656,Japan- [email protected], [email protected]
Commission V, WG V/4
KEY WORDS: Image Selection, Bundle Adjustment, Network Design, Visualization, Graph cut
ABSTRACT:
3D models have been widely used by spread of many available free-software. On the other hand, enormous images can be easily acquired, and images are utilized for creating the 3D models recently. However, the creation of 3D models by using huge amount of images takes a lot of time and effort, and then efficiency for 3D measurement are required. In the efficiency strategy, the accuracy of the measurement is also required. This paper develops an image selection method based on network design that means surveying network construction. The proposed method uses image connectivity graph. By this, the image selection problem is regarded as combinatorial optimization problem and the graph cuts technique can be applied. Additionally, in the process of 3D reconstruction, low quality images and similarity images are extracted and removed. Through the experiments, the significance of the proposed method is confirmed. Potential to efficient and accurate 3D measurement is implied.
1. INTRODUCTION
In late years, movements of the 3D model making and utilization are generalized by the development of the computer technology. The making of a variety of 3D models has been performed by an expert, but 3D model production software available free such as Blender or 123D is shown much on web, and the environment that anyone can easily make the 3D model is set. The constructed 3D model is used in the frequent natural disaster measures or actual situation grasp of the infrastructure other than a scene design, view simulation, a visual material for city planning and 3D model is utilized in various fields.
The general 3D model making is often carried out by photogrammetry. The three-dimensional measurement with the image presents an active state by development of Computer Vision (CV). Besides, in late years the mass image acquisition becomes possible, and an opportunity to apply photographic surveying spreads more and more. As 3D model making example from an image in large quantities, there is business to make digital 3D map of the whole world using a large quantity of satellite images and trial to make 3D model of an urban by using a large quantity of images on community websites such as Flickr (Agarwal et al., 2011). Furthermore, even an individual comes to be able to easily acquire a large quantity of images as consecutive image by the spread of high-performance video cameras at a low price. It is hoped that it is not special for an individual to make 3D model by these consecutive images by using 3D model production software.
However, for the 3D model making, it is necessary to process a large quantity of images and it takes a lot of time and effort to create 3D model by using huge amount of images. Therefore efficiency of the model making is called for. Furthermore, as well as efficiency, it is important to secure the accuracy of the 3D model. In the general photogrammetry, specifications and configurations of cameras are set in advance as project planning, which is so called as network design in photogrammetry (K.B.Atkinson, 1996). The network design means surveying
network construction, and mainly consists of zero-order design (ZOD: the datum problem), first-order design (FOD: the configuration problem), second-order design (SOD: the weight problem). Considering the availability of huge amount of images, the network design may be applied in order to select images among them after taking the images. The image selection based on the network design will be expected to contribute improvement of efficiency for 3D measurement and keeping of accuracy simultaneously.
A purpose of this paper is to develop a method of automatic selection of the using image from a large quantity of images based on the network design for three-dimensional measurement. Specifically, the proposed method uses image connectivity graph. The image connectivity graph represents the relationships between images by using node as an image and edges as relationships between two images. The edges in the graph have costs, which are defined by elements in the first-order design of the network design. The FOD is known as the most important aspect in the network design. The estimation accuracies of exterior orientation elements, namely variances of estimated camera positions between two images, are set as the costs. Once the image connectivity graph is constructed, the image selection problem is regarded as combinatorial optimization problem. Against the combinatorial optimization problem, the graph cuts technique (Kubo, 2000) can be applied. Here, the cost in the connectivity graph is considered as the energy, and then technique can find the optimized connectivity graph in the sense of cost minimization with smaller number of edges as possible. The remaining edges are corresponding to selected image pairs. Additionally, in the process of 3D reconstruction, low quality images and similarly images are also extracted and removed. By this, the efficiency of the image selection is improved.
2. AUTOMATIC IMAGE SELECTION METHOD FOR THREE DIMENSIONAL MEASUREMENT
In this section, we present perspective of the proposed method (Figure 1). Firstly, the internal orientation element of the camera for photography is found by camera calibration (Z. Zhang, 1998). Then, image matching is carried out for two pieces of images from an image in large quantities, and image coordinates of the feature points that are common to each image pairs are found. From the result of the image matching, image pairs having low accuracy of the matching are detected and removed. Furthermore, with the image coordinate of each feature point provided as a result of image matching, the three-dimensional coordinate group of the feature points and the camera external orientation element between two pieces of images are calculated. In doing so, the detection and removal of the similar images are carried out. With the three-dimensional coordinate group of the feature points and camera external orientation element between each provided image pair, the measurement accuracy of the camera external orientation element is estimated by bundle adjustment (Luhmann et al., 2006; Okaya, 2010; Iwamoto et al., 2011). Finally, based on network design, we perform graph expression of the relations between the image, and automation of the image selection is relative orientation, and it is necessary to extract feature points with characteristic of the color and form in images and to make the point thought to be the same point between images matched. This work is called image matching, and in this paper, we performed image matching for two pieces of images from a large quantity of images.
We use SURF algorithm (Bay, H. et al., 2008) for extraction of the feature points in this paper. In SURF algorithm, firstly, a color image is converted into a monochrome grayscale image, and a corner and an edge of grayscale images are detected, and feature points are extracted. The feature points here refer to the points that the pixel change (brightness change) of the image has a big. Then, quantity of feature and a feature vector are calculated and consider the points where a feature vector resembles to be the same point and perform a matching. Matching is carried out for two pieces of image pair by the method described above and reduces the number of the pair of image by comparing the number of the matching. We set a certain threshold and in certain image pairs, if the number of the matching is less than the threshold, the image pairs are removed for the reason of the matching accuracy of the pair image being low, or picture itself being low.
2.3 The acquisition of the three-dimensional point group and the external orientation element
Next, using the image coordinate of the feature points and camera internal orientation element in each image provided as a result of matching, three-dimensional coordinate of the feature point and the camera external orientation element are estimated. Here, after having performed the three-dimensional reconstruction between each image pair, the image pair thought to be the similar image was detected.
First of all, for similar image detection, it is necessary to find the base line length between each image pair. As for the base line length, the base line length between the adjacent frame images of consecutive images shall be defined 1. Namely, the base line
feature points in a certain image pair is M, the distance between the object and an image pair (the p-th frame image and the q-th frame image) is defined as follows.
� =∑ √ �+ �+� distance between image pair and object, we detected the similar image pairs. In image pairs, the similar degree of the image becomes higher if the distance between an image pair and object is much bigger than the base line length. We set a certain threshold and detected the similar image pairs and remove one of two pieces if the value of H/B is bigger than the threshold (H means the distance between an image pair and the object, B Camera calibration
Matching every two pieces of images (2.2)
Calculation of three dimensions coordinate group of the feature points and the external orientation
element (2.3)
(Removal of low accuracy image pairs)
Calculation of estimation accuracy of the external orientation element by the bundle adjustment between two pieces of images (2.4)
(Removal of similar images)
Graph expression of the relations between the images (3.1)
Automatic selection of images by the combination optimization (3.2)
means base line length). In this way, the removal of the similar images is carried out in a 3D reconstruction process.
2.4 Calculation of the external orientation element estimate accuracy by the bundle adjustment
Three-dimensional coordinate group of feature points in each image pair was found, but it is thought that these values include a photography error by all means. Here, the estimation accuracy of the external orientation element of each image pair is got by bundle adjustment for each image pair. In external orientation elements, we consider only a translation matrix expressing the position of the camera that is the most important element of the network design.
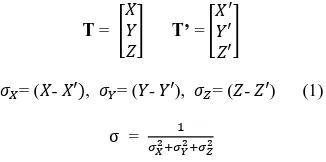
In a certain image pair, if the translation matrix that is provided as a result of 3D reconstruction is T, and the translation matrix that is estimated by the bundle adjustment is T’, the estimation accuracy is defined as follows.
T = [ ] T’ = [ ′ ′
′]
� = ( - ′ , � = ( - ′), � = ( - ′) (1)
σ = � +� +�
where , , = components of translation matrix T ′, ′, ’ = components of translation matrix T’ � , � , � = measurement error of each components σ = the estimation accuracy of the translation matrix
3. AUTOMATIC IMAGE SELECTION BY THE COMBINATION OPTIMIZATION.
3.1 Graph expression of the relations between the images based on network design
Here, we perform the graph expression of the relation between the images based on a way of the graph theory (T.L.Basakkar, 1970). Each photographed image is set as a node of the graph, and edges mean relationships between two images. The edges in the graph have costs, which are defined by the estimation accuracy of exterior orientation elements, namely variances of estimated camera positions between two images. Camera positions mean the FOD that is thought to be the most important element in the network design. It becomes possible to express
image relation based on a network design by incorporating the estimation accuracy of the camera position that is the element of the network design for cost of the edges (Figure 2).
3.2 Automatic image selection by the application of the combination optimization problem
From here, we perform automatic selection of image relations by applying a combination optimization problem. Specifically, we consider applying a graph cut theory to estimate graph structure to be constructed by an edge as little as possible. For a graph expressing image relations, we establish an initial node and a terminal node and the find the set of the cut edge realizing the min-cut. As for the set of a calculated cut edge, the cost sum namely the sum of the estimation accuracy of the camera position between the images is in this way minimized. In other words, because the edge group detected is a group of the edges that the estimation accuracy of the camera position is low, it is thought that the influence that a graph gives overall estimation accuracy even if these edges are removed is small and therefore these edges are removed from a graph. The remaining edges are corresponding to selected image pairs. By reducing the number of the edges constituting a graph, the number of the image pairs to use decreases, and will be connected for the efficiency of the measurement. From the above, while securing high accuracy by consideration of the estimation accuracy of the camera position that is the element of the network design, the effective measurement by automatic selection of the image relation will be realized.
4 RESULTS
4.1 Data description
We photographed the movie around the following structures (Figure 3) using digital video camera, and converted a photographed movie into consecutive images. The number of consecutive images got from the movie is 999. Then we applied these images to proposed method and performed an experiment to confirm the significance of the proposed method.
Figure 2. Graph expression of the image relation Image 1
Image 2
Image 3
・・・・
Image p Image q
Image x Image y
・
・
・
Min-cut Cut edges
Node (image) Edge
4.2 Results
4.2.1 Image matching and removal of low quality images: In this study, for 999 provided frames, the matching with the frame by 20 pieces before and after shall be performed, therefore the matching number of the first image pairs to perform is 19,581 pairs in total. The following figure (Figure 4) shows a distribution of the number of matching. Based on a result provided this time, we set the threshold of the number of the matching with 25 and decided to remove image pairs with number of the matching less than 25. The number of the image pairs that are removed was 1354.
4.2.2 3D reconstruction and removal of similar images: Next, for 18,227 image pairs, we performed the three-dimensional reconstruction. We set the threshold of the number of H/B with 500, and if image pairs whose number of H/B is more than 500, we removed one of image pairs. As a result, 70 sets of image pairs
were detected as similar images, and 70 pieces of images were removed. The number of the image pairs was in this way decreased from 18,227 pairs to 15,892 pairs.
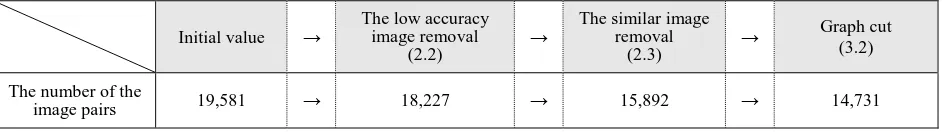
4.2.3 Graph cut: For 15,892 sets of image pairs, we constructed the image connectivity graph that represents the relationships between images by using node as an image and edges as relationships between two images. The number of nodes of graph was 929, and the number of edges of graph was 15,892. In this research, we made five partial graphs other than a whole graph comprised of all images. We divided all images into five group, and each image group constitutes a partial graph. For each these 6 graphs in total, we performed a graph cut. As a result, the total number of cut edges was 1,161, and the number of remaining edges was 14,731. Table 1 shows a change of the number of the edges (the number of the image pairs).
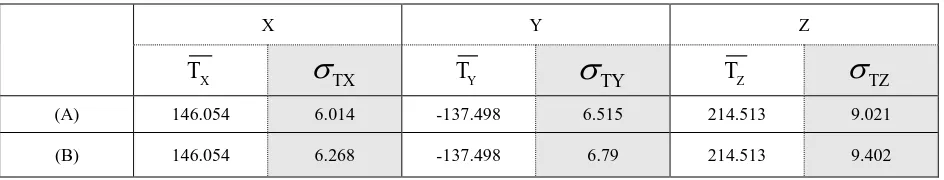
4.2.4 Verification of accuracy of the proposed method: Finally, we performed verification of accuracy of the proposed method. The verification of accuracy is performed by comparing estimation accuracy of the three-dimensional coordinate of the feature point and camera external orientation element by using all image relations and these got by only using image relations chosen by proposed method. Accuracy comparison is performed by applying bundle adjustment to the selected images (after applying the proposed method) and all images (before applying the proposed method). Table 2, and Table 3 show a result of accuracy comparison of the three-dimensional coordinate group of the feature points and external orientation element.
0 1000 2000 3000 4000 5000
distribution of the number of matching
25 50 75 100 125 150 175 200 225 250 275 300 300~
Initial value →
The low accuracy image removal
(2.2) →
The similar image removal
(2.3) →
Graph cut (3.2)
The number of the
image pairs 19,581 → 18,227 → 15,892 → 14,731
X Y Z
X
XY
YZ
Z(A) 36.648 1.584 -37.019 1.239 51.935 1.945
(B) 35.793 1.226 -35.849 1.324 50.856 1.803
T
h
e
n
u
m
b
er
o
f ima
g
e
p
airs
The number of matching
Figure 4 Distribution of the number of matching
Table 1. A change of the number of the use image pairs in each stage
Table 2. A result of accuracy comparison of three-dimensional coordinate of feature point (A)… Three dimensional measurement using all image relations
(B)… Three dimensional measurement using only chosen image relations
̅,̅ ̅, = The average of each direction of the characteristic point three dimensions coordinate value
5. DISCUSSION
Table 1 shows that by the proposed method the number of using image pairs decreased to approximately 75% in comparison with before application of method, therefore improvement of the effectiveness of 3D measurement was confirmed. In addition, Table 2 and Table 3 show that the accuracy of 3D measurement using only image pairs selected automatically by proposed method is almost the same level as that using all image pairs. From the above, an effective three-dimensional measurement was realized while keeping accuracy by an application of the proposed method.
6. CONCLUSION
In this paper, we examined the method to enable a more efficient 3D measurement while keeping accuracy using a large quantity of images, and developed method to select using images automatically from a large quantity of images group by considering the network design. Furthermore, we applied proposed method for real data (photographed images) and inspected effectiveness and the accuracy, and examined application possibility of the proposed method. Actually, through the experiments verifying the effectiveness and accuracy of the proposed method, the significance of the proposed method is confirmed, and it is expected that proposed method will lead to development of the future photogrammetry.
On the other hand, there are many future works to apply the proposed method practically. Firstly, it is hoped that the proposed method apply to not only sequential images but also various kinds of images such as shared images on the internet. In such cases, interior orientation elements should be introduced because these images are photographed by different cameras. Additionally, definition of cost function for the edges will be investigated. In this method, only estimation accuracy of the external orientation element between two images is set as variable for cost function. By adding the estimation accuracy of the three-dimensional coordinate of the feature points to cost function as variable, it is expected that we can express the relations between images in greater detail and can obtain result having higher accuracy. Furthermore, discussion about relationships between efficiency and accuracy will be required, because if we apply the graph cuts repeatedly, it is thought that the effectiveness improves, but the accuracy decreases. As a result, applicability of photogrammetry will be more increased.
7. REFERENCE
Bay, H., Ess, A., Tuytelaars, T., Gool, L.V., 2008, “Speeded-Up
Robust Features (SURF)” Computer Vision and Image Understanding, Vol.110, No.3, pp.346-359
Iwamoto, Sugaya, Kanatani, 2011. “Bundle Adjustment for 3-D
Reconstruction: Implementation and Evaluation” IPSJ SIG Technical Report, pp.1-8
K.B.Atkinson, 1996. Close Range Photogrammetry and Machine Vision, Whittles Publishing, Latheronwheel, UK
Kubo, 2000, Kumiawasesaitekika To Algorizumu, Kyouritsu Publishing, Tokyo, pp.85-94
Luhmann, T., Robson, S., Kyle, S. and Harley, I., 2006. Close Range Photogrammetry. Whittles, Scotland, UK.
Okaya, 2010. “Bundle adjustment” Computer Vision saisentan gaido, Vol.3, pp.1-31
Sameer Agarwal, Yasutaka Furukawa, Noah Snavely, Ian Simon, Brian Curless, Steven M. Seitz and Richard Szeliski, 2011.
“Building Rome in a Day” Communications of the ACM, Vol.54, No. 10, pp.105-112,
T.L.Basakkar, 1970, Finite Graphs and Networks An introduction with Applications, Baifuusya, Tokyo,
Z.Zhang, 1998. “A Flexible New Technique for Camera Calibration” IEEE Translatrions on Pattern Analysis and Machine Intelligence, 22(11), pp.165-186
X Y Z
X
T
TXT
Y
TYT
Z
TZ(A) 146.054 6.014 -137.498 6.515 214.513 9.021
(B) 146.054 6.268 -137.498 6.79 214.513 9.402
(A)… Three dimensional measurement using all image relations
(B)… Three dimensional measurement using only chosen image relations �̅̅̅,�̅̅̅,�̅̅̅.. The average of each value of the translation matrix of each frame