ACCURACY ANALYSIS FOR AUTOMATIC ORIENTATION OF A TUMBLING
OBLIQUE VIEWING SENSOR SYSTEM
K. Stebner a, A. Wieden a
a
Institute of Optical Sensor Systems, German Aerospace Center (DLR), Rutherford-Str. 2, 12489 Berlin, Germany, [email protected], [email protected]
KEY WORDS: Photogrammetry, Remote Sensing, Aerial Imaging, UAVs, Oblique Camera System, Sensor Orientation, Direct Georeferencing, MACS
ABSTRACT:
Dynamiccamera systems with moving parts aredifficult to handle in photogrammetric workflow, because it is not ensured that the dynamics are constant over the recording period. Minimum changes of the camera’s orientation greatly influence the projection of oblique images. In this publication these effects – originating from the kinematic chain of a dynamic camera system – are analysed and validated. A member of the Modular Airborne Camera System family – MACS-TumbleCam – consisting of a vertical viewing and a tumbling oblique camera was used for this investigation. Focus is on dynamic geometric modeling and the stability of the kinematic chain. To validate the experimental findings, the determined parameters are applied to the exterior orientation of an actual aerial image acquisition campaign using MACS-TumbleCam. The quality of the parameters is sufficient for direct georeferencing of oblique image data from the orientation information of a synchronously captured vertical image dataset. Relative accuracy for the oblique data set ranges from 1.5 pixels when using all images of the image block to 0.3 pixels when using only adjacent images.
1. INTRODUCTION
No single product or solution in aerial photography can completely comply with the needs of any user, given the diverse set of tasks in remote sensing. Nowadays there is a growing demand for specialized solutions, like oblique viewing camera systems. For manned aircrafts several multi head camera systems with oblique looking cameras were developed, e.g. Quattro DigiCam from Ingenieur-Gesellschaft for Interfaces (Kremer, 2010) or Leica RCD30 Oblique. Also, camera systems small enough for the use with Unmanned Aerial Systems (UAS) are required.
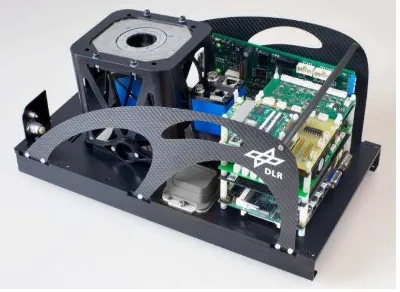
Figure 1. MACS-TumbleCam
At the DLR Institute of Optical Sensor Systems a wide range of passive-optical sensor systems is developed and exemplarily deployed. Over the last years, a modular approach has been pursued. The Modular Airborne Camera System (MACS) as described by Lehmann et al., 2011 has been evaluated for different remote sensing applications (e.g. Wieden & Linkiewicz, 2013). In 2012 a small, lightweight
camera system MACS-TumbleCam (Figure 1) has been developed to enable UAS based acquisition of image data, which can be used for photogrammetric processing.
This camera system contains a moving camera head for the oblique viewing camera similar to AOS (Aerial Oblique System) from BSF Swissphoto (Wiedemann, 2009). For that kind of dynamic systems certain parameters must be determined with high accuracy to ensure consistent orientation of the images for photogrammetric analysis and derivation of high quality products such as 3D models and high-level geoinformation.
2. 3D CAMERA SYSTEM MACS-TUMBLECAM
MACS-TumbleCam is a two-head camera system lighter than 5kg designed for the autonomous acquisition of RGB image data. It consists of two camera heads, a position and orientation measurement system and a computer for control and data storage. One camera head is fixed vertical looking down. The other moves in a tumbling manner, actuated by a piezo motor (Figure 2, beta angle). The moving camera head is mounted in a way that allows movement only in two axes (Figure 2, x and y direction). Both camera heads are synchronized for image acquisition by use of a high-frequency trigger system. This way the camera and resulting image is not rotated but tilted in relation to the vertical camera head. The optical axis of the moving head is tilted by 30 deg from the optical axis of the fixed head and follows a circle. Movement can be continuous or stopped on arbitrary points of the motors rotation (Rüther-Kindel & Brauchle, 2013).
For the MACS-TumbleCam image data orientation a reference orientation method (Wieden & Stebner, 2013) will be evaluated within this publication. By using a vertical and oblique sensor it resembles the procedure described by Wiedemann & Moré, The International Archives of the Photogrammetry, Remote Sensing and Spatial Information Sciences, Volume XL-3/W1, 2014
2012. The vertical viewing camera head (VertCam) will be oriented via conventional bundle block adjustment. The tumbling camera head (ObCam) shall be oriented using its geometrical relation to VertCam.
Figure 2. CAD-construction model
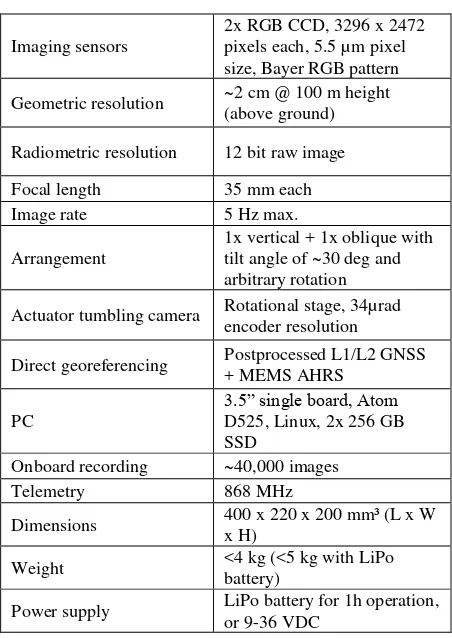
Imaging sensors
2x RGB CCD, 3296 x 2472 pixels each, 5.5 µm pixel size, Bayer RGB pattern
Geometric resolution ~2 cm @ 100 m height (above ground)
Radiometric resolution 12 bit raw image
Focal length 35 mm each
Image rate 5 Hz max.
Arrangement
1x vertical + 1x oblique with tilt angle of ~30 deg and arbitrary rotation
Actuator tumbling camera Rotational stage, 34µrad encoder resolution
Direct georeferencing Postprocessed L1/L2 GNSS + MEMS AHRS
PC
3.5” single board, Atom D525, Linux, 2x 256 GB SSD
Onboard recording ~40,000 images
Telemetry 868 MHz
Dimensions 400 x 220 x 200 mm³ (L x W x H)
Weight <4 kg (<5 kg with LiPo battery)
Power supply LiPo battery for 1h operation, or 9-36 VDC
Table 1. Specifications MACS-TumbleCam
3. DETERMINATION OF THE MOTION MODEL
The movement of the ObCam in relation to the VertCam can be described as a rotation based on the angular position of the piezo motor and the modelling of the kinematic chain. Due to the tumbling concept the ObCam does not rotate around the z-axis. Therefore, the kappa angle is theoretically constant zero
about all piezo motor positions. Three simple trigonometric formulas describe the theoretical approach (Rüther-Kindel & Brauchle, 2013). These are valid only if the projection center is also the center of rotation of this tumbling camera head. This is not the case with MACS-TumbleCam due to constraints regarding construction quality of the kinematic chain.
Therefore, the deviations of the motion must be measured and described mathematically. The elasticity of the kinematic chain and the uncertainties of the angle encoder of the piezo motor are error values and do influence the transformation parameters between VertCam and ObCam. The geometric reconstruction of position and rotation of the ObCam in relation to the VertCam is investigated by using the mathematical approach of projective reconstruction (Wrobel, B. P., 2001). This way, for each angular position of the piezo motor the exterior orientation information of ObCam can be derived from the exterior orientation of VertCam.
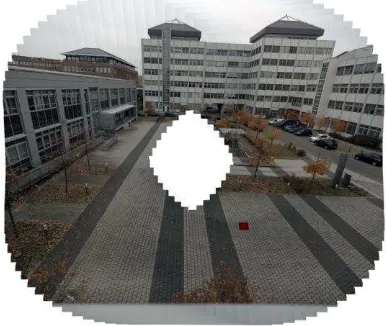
To determine the deviation between the theoretical model and the actual characteristics of the system, an experimental installation (Figure 3) was set up in front of a test field. An additional wide-angle camera head was used as reference and control camera (RefCam). The interior orientation of all cameras was previously determined by a test field calibration (Table 2). The angle of view of the RefCam covered the imaging range of both camera heads of MACS-TumbleCam (Figure 4). With a complete overlap of all images and a maximum scaling factor of about two between the images a consistent evaluation of the images was enabled.
Figure 3. Experimental set-up
Figure 4. Footprints of the experimental set-up (RefCam – light blue, VertCam – red, ObCam – purple)
Camera Scaling
factor Interior orientation (Stddev)
RefCam
The transformation between the wide-angle RefCam and VertCam should be constant, whereas the tumbling ObCam requires different transformation parameters for each angular position of the piezo motor because of uncertainties in the kinematic chain. In the projective reconstruction the image of RefCam provides the reference points for the images of MACS-TumbleCam. Homologous points in the images from all three cameras have then to be located to determine the transformation parameters between the camera images.
Accuracy tests on this method – which is also used in industrial applications (e.g. Darr et al., 2013 and Hanel et al., 2013) – can be found in Luhmann, 2009. To detect a potential mutual movement of VertCam and RefCam due to vibrations or instabilities in the experimental set-up, the image information of these cameras were checked by a block matching algorithm as
Table 3. Overview of deviations between motion model and complete set of measurements
In order to validate the general quality of the measurements, the determined angle values from the different series of measurements were compared with each other. The mean of all angles roll, pitch and yaw for each piezo motor position was calculated. In addition, the standard deviation from the mean values has been determined for each piezo motor position. The maximum deviations are presented in Table 3 as Δmax. The
average values Δmean describe the repetition accuracy of the kinematic chain.
NegErr and PosErr represent the maximum absolute deviations from the nominal motion model. These recurring minima and maxima discernable as turning points of each graph in Figure 6 indicate the influence of the construction quality and stiffness of the kinematic chain. The number and position of the graph’s turning points even reveal the presence of two joints.
The graphs also show constant portions of the deviation (Figure 6), which indicate a constant rotation between the two camera heads. This rotation can be described as boresight misalignment between the VertCam and ObCam. No relative movement of RefCam and VertCam was discernible when analysing the block matching during the series of measurements. This indicates a stable experimental set-up.
Figure 5. Motion model of tumbling ObCam
Figure 6. Measured deviations from theoretical model
The constant offsets and the angle-dependent variances are used to calculate compensation values for each position of the piezo motor and therefore for each possible exterior camera orientation. These values have been added to the theoretical motion model.
Afterwards six test measurements have been carried out. In each case the mean epipolar error was calculated to determine the pixel deviation in the resulting projection. The results are shown in Table 4. The mean deviation of epipolar error was 0.5 pixels and the maximum error was 0.7 pixels. Using the enhanced model, the images of the tumbling ObCam were projected on a virtual plane (Figure 7). No geometric errors were discernible.
PointID Epipolar error [px]
1 0.413
2 0.684
3 0.325
4 0.578
5 0.681
6 0.532
Mean 0.536
Table 4. Epipolar error of ObCam from experimental examination
Figure 7. Projected ObCam images from one series of measurements
4. VALIDATION AND EXEMPLARY USE OF THE ENHANCED MOTION MODEL
The compensation values for the theoretical motion model of the tumbling ObCam had to be validated using a realistic scenario. For this purpose an aerial image acquisition near Hammelburg, Germany was carried out in April 2012. ATISS (Danders, 2011), a small fixed-wing UAS of the TFH Wildau was used. Aim of the test campaign was to validate the motion model of the experimental set-up and to test the applicability of the reference orientation for image data of the MACS-TumbleCam.
Figure 8. Flight path of the carrier UAS
The test target is an abandoned village and its surrounding area about 1000 m long and 300 m wide. It was recorded in ten overlapping flight lines (Figure 8) with about 5 cm GSD. Both
cameras were triggered synchronously. For the ObCam eight discrete motor positions in 45 deg increments were used. The circular movement of the piezo motor was interrupted for each shot to create comparable images in regard to motion blur.
First, an aerotriangulation (AT) using ground control points was performed on 726 images of VertCam. The AT results are indicated in Table 5 and show a typical characteristic for a vertical image set. The internal accuracy of the AT was determined to 0.1 pixels.
Omega [deg] Phi [deg] Kappa [deg] Misalign. IMU
to VertCam -0.5919 0.0325 0.1091 Mean stddev.
rotation 3.7/1000 3.8/1000 1.2/1000 X [m] Y [m] Z [m] Mean stddev
translation 0.012 0.013 0.021
Mean stddev.
controlpoints 0.031 0.030 0.053
Table 5. Overview of AT for images of VertCam
The exterior orientation of VertCam was used as reference for the determination of the exterior orientation of the ObCam. The exterior orientation of VertCam was transferred to ObCam using the corrected motion model.
Six test measurements on arbitrary selected oblique images were carried out in order to check the accuracy of the reference orientation and the enhanced motion model.
Figure 9 shows the distribution of the measurement points. The epipolar error from all possible pixel measurements (
Figure 10) was determined for each point. The accuracy was below these from the experimental set-up. Assessed pixel deviation was about 1.5 pixels using all images and 0.3 pixels using only adjacent images (Table 6).
Figure 9. Distribution of the six test measurements
Figure 10. Epipolar geometry for one selected point in different oblique images
It is expected that the lower accuracy in the actual flight campaign originates from the quality of the vertical aerotriangulation. In contrast to a vertical image data set oblique images cover a wider area with the same aperture angle. Additionally, due to the full set of viewing angles captured by ObCam, objects are captured more often and from larger distances. Identical homologous points are visible on oblique images from up to seven flight stripes. Therefore, in oblique image data the residual errors carried over from the vertical image block’s triangulation have a higher influence on the accuracy.
When using a reduced set of images containing mostly adjacent images the epipolar geometry is significantly better. The epipolar error decreases to about 1/3 of a pixel length (
Table 6).
Table 6. Epipolar error for each point of test campaign
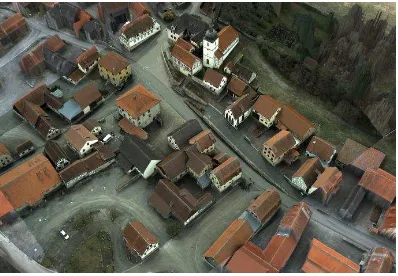
To test the complete workflow for the MACS-TumbleCam and to examine the results of the test campaign visually as well, a digital surface model was calculated from the oriented images of VertCam. This model was texturised using vertical and oblique image data. Figure 9 shows a detail of the texturised 2.5D model in a 3D view. No geometric errors are discernible.
Figure 11. Texturised surface model by using vertical and oblique image data
5. CONCLUSION
Transformation parameters between the images of the two camera heads of the MACS-TumbleCam were successfully determined using an experimental set-up. These parameters can be used for the calculation of highly accurate approximations for the exterior orientation of the ObCam without the need for auxiliary measurement devices. It is further shown that accuracies equal or better than 1.5 pixels can be achieved by
using the determined compensation values. Oriented images of ObCam can directly be used for texturising 2.5D surface models. In further studies, the derivation of true 3D information using the MACS-TumbleCam must be examined. First investigations on the image block provided information about causes for the lower accuracies in the oblique image data.
From the photogrammetric point of view the UAS test flight has shown that it may be useful to design an airborne version of MACS-TumbleCam. Size, weight and power requirement of a camera system can be lowered by limiting the number of camera heads necessary for the acquisition of a full set of oblique imagery. Enabling smaller and more cost-effective aircraft for this task, the concept of a dynamic camera system can considerably reduce the effort for oblique data acquisition and processing. experimental set-up, Sebastian Pless for his contributions and all involved partners of the UAS test campaign.
7. REFERENCES
Chan, S. H., Vo, D. and Nguyen, T. Q. 2010. Sub-pixel motion estimation without interpolation. Proceedings of IEEE Conference on Acoustics, Speech and Signal Processing, pp. 722-725.
Danders, C., 2011. Flugleistungsvermessung der Flugmessdrohne ATISS (Autonomous Flying Testbed for Integrated Sensor Systems). Master Thesis, Technische Fachhochschule Wildau, Wildau, Germany.
Darr, T., Götz, C., Tuttas, S., Becker, T. & Stilla, U. 2013. Genauigkeit der inversen Navigation bei hoher Passpunktsichtbarkeit zur Absolutpositionierung eines geführten Messsystems. DGPF Tagungsband 22 /2013, 22, pp. 279-288.
Hanel, A., Götz, C., Tuttas, S., Becker, T. & Stilla, U., 2013. Orientierungsgenauigkeit eines Multi-Kamerasystems bei Roboterbewegungen in einer Fahrzeugkarosserie. DGPF Tagungsband 22 /2013, 22, pp. 298-307.
Kremer, J., 2010. The Quattro DigiCAM - IGI's Versatile – Aerial Camera System for Various Aerial Imaging Tasks. Seyfert, E. [ed], DGPF-Publikationen, Deutsche Gesellschaft für Photogrammetrie, Fernerkundung und Geoinformation (DGPF) e.V., Oldenburg, pp. 623–630.
Lehmann, F., Berger, R., Brauchle, J., Hein, D., Meissner, H., Pless. S., 2011. MACS –Modular airborne camera system for generating photogrammetric high-resolution products. PFG 6/2011, pp. 435–446.
Luhmann, T., 2009. Precision potential of photogrammetric 6DOF pose estimation with a single camera. ISPRS Journal of Photogrammetry and Remote Sensing, 64(3), pp. 275-284. The International Archives of the Photogrammetry, Remote Sensing and Spatial Information Sciences, Volume XL-3/W1, 2014
Rüther-Kindel, W. and Brauchle, J., 2013. The SALSA PROJECT – HIGH-END AERIAL 3D CAMERA, Int. Arch. Photogramm. Remote Sens. Spatial Inf. Sci., XL-1/W2, pp. 343-348
Wiedemann, A., 2009. Photogrammetrische Schrägluftbilder mit dem Aerial Oblique System AOS. Seyfert, E. [ed.], DGPF-Publikationen, Deutsche Gesellschaft für Photogrammetrie, Fernerkundung und Geoinformation (DGPF) e.V., Oldenburg, pp. 1–8.
Wiedemann, A. and More, J., 2012. Orientation strategies for aerial oblique images. ISPRS Int. Archives of Photogrammetry, Remote Sensing and Spatial Sciences, Vol. 39(B1).
Wieden, A. and Linkiewicz, M., 2013. True- Oblique- Orthomosaik aus Schrägluftbildern zur Extraktion von 3D-Geoinformationen. DGPF Tagungsband 22 /2013, 22, pp. 373-383.
Wieden, A. and Stebner, K., 2013. Referenzorientierung für Bilddaten aus Mehrkopfkamerasystemen. DGPF Tagungsband 22 /2013, 22, pp. 518-525.
WROBEL, B. P., 2001. Minimum Solutions for Orientation. Volume 34 of Springer Series in Information Science. Berlin Heidelberg: Springer