A ROBUST CHANGE DETECTOR FOR MULTILOOK POLARIMETRIC SYNTHETIC
APERTURE RADAR DATA
M. Ghanbaria,∗
, V. Akbarib, A. A. Abkara, M. R. Sahebia, M. Liuc
a
Department of Surveying and Geomatics Engineering, K.N.Toosi University of Technology, Tehran, Iran - [email protected] bDepartment of Physics and Technology, University of Tromsø, Tromsø, Norway, NO-9037 - [email protected]
c
Key Labratory of Digital Earth Sciences, Institute of Remote Sensing and Digital Earth, Chinese Academy of Sciences, Beijing 100094, China
KEY WORDS:Change detection, SAR polarimetry, Kittler and Illingworth thresholding, Hotelling-Lawley trace statistic
ABSTRACT:
In this paper, we propose a robust unsupervised change detection algorithm for multilook polarimetric synthetic aperture radar (PolSAR) data. The Hotelling-Lawley trace (HLT) statistic is used as a test statistic to measure the similarity of two covariance matrices. The generalized Kittler and Illingworth (K&I) minimum-error thresholding algorithm is then applied on the test statistic image to accurately discriminates changed and unchanged areas. The algorithm, tested on real PolSAR images, provides satisfactory results.
1. INTRODUCTION
Spatio-temporal data mining (STDM) is an emerging and wide research area which comprises different approaches for describ-ing an object, an event or a position over time of interest (Julio and Adem, 2011). Detecting and mining changes occured on a spatial multitemporal database, as a part of STDM, is important in many applications such as environmental monitoring. Given a set of mutitemporal data, change mining is the problem of deriving the changing regions between any two data sets. The availability of synthetic aperture radar (SAR) data on the one hand and the in-sensitiveness of SAR imagery to atmospheric and sun-light con-ditions on the other hand offer a great potential for change detec-tion and monitoring applicadetec-tions, see e.g. (Park et al., 2013, Ak-bari et al., 2013). In particular, polarimetric SAR (PolSAR) sen-sors potentially provide increased detection capability, as com-pared to single-polarization SAR.
In the analysis of multitemporal SAR images, several unsuper-vised change detection approaches have been developed and de-scribed in the literature, such as (Conradsen and Skriver, 2003, Akbari and Eltoft, 2013, Marino and Sanchez-Lopez, 2013). Un-supervised SAR change detection is generally performed in three sequential steps: 1) image preprocessing, including co-registration, geometric and radiometric corrections, and speckle reduction, 2) pixel by pixel comparison of two pre-processed SAR images by a desired test statistic, and 3) analysis of the test statistic image by applying a decision threshold resulting the final change map.
We limit our focus to change detection in multilook complex (MLC) PolSAR images, where the backscattered signal is rep-resented by the so-called sample polarimetric covariance (or co-herency) matrix. Conradsenet al., 2003, presented the Wishart likelihood ratio test (LRT) as a new test statistic for change detec-tion in multilook PolSAR images and gave the asymptotic sam-pling distribution for the test statistic. Akbariet al., 2013, uti-lized the complex-kind Hotteling-Lawley trace (HLT) as a test statistic for change detection in multilook PolSAR images. The sampling distribution of the HLT statistic was approximated by a Fisher-Snedecor (FS) distribution. Both test statistics effectively compacts the matrix-variate information into a scalar measure.
After applying test statistic, thresholding process is performed to achieve final change/no-change map. The methods in Conradsen
∗Corresponding author.
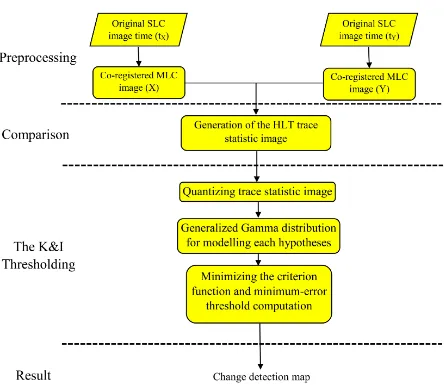
et al., 2003, and Akbariet al., 2013, belong to the class of con-stant false alarm rate (CFAR) detectors. The change detectors are performed using the approximated distribution of the test statis-tics at a given probability of false alarm. In the present paper, the change detector involves the optimal selection of the thresh-old value to accurately distinguish ”change” from ”no-change”. The thresholding is performed using the generalized Kittler and Illingworth’s minimum-error algorithm (K&I for short) proposed in (Moser and Serpico, 2006) on the HLT test statistic image. Generalized Gamma distribution is used to model change and no-change hypotheses. This parametric model is developed because of its capability for better fitting the densities of classes in the HLT statistic image. The general block diagram of the proposed unsupervised change detection is shown in Figure 1.
Figure 1: General block diagram of the proposed change detec-tion approach.
The reminder of this paper is organized as follows: In Section 2., we describe the proposed change detection algorithm including the Hotelling-Lawley trace statistic and thresholding. 3. demon-strates the performance of the method with two Radarsat-2 fully
The International Archives of the Photogrammetry, Remote Sensing and Spatial Information Sciences, Volume XL-2/W3, 2014 The 1st ISPRS International Conference on Geospatial Information Research, 15–17 November 2014, Tehran, Iran
This contribution has been peer-reviewed.
polarimetric images of Suzhou, China and discusses the results. Section 4 is dedicated to conclusions.
2. THEORY
LetX={X(i, j); 1≤i≤I,1≤j≤J}andY={Y(i, j); 1≤ i≤I,1≤j≤J}be two co-registered multilook complex Pol-SAR images at timest0andt1(t1> t0), whereRandCare the number of rows and columns of the images, respectively. In order to determine whether a change has occurred at position(i, j)in the image, we need to compare PolSAR measurementsX(i, j)
andY(i, j). These are the Hermitian and positive definite sam-ple covariance matrices with dimensiond×d, wheredis number of polarimetric channels. We shall assume that imagesXandY
have the same original resolution and have been subject to the same multilook processing resulting the same number of looks i.e.,Lx=Ly.
2.1 Hotelling-Lawley trace statistic
In order to perform the change detection, one of the hypothesis should be chosen:
H0:Σx=Σy,
H1:Σx6=Σy, (1)
The null hypothesis (H0) corresponds tono-changeand the al-ternative hypothesis (H1) tochange. It should be noted that both hypotheses are attained by assumingLx=Ly. The HLT statistic
is used to measure similarity between two covariance matricesX
andYand is defined as (Akbariet al., 2013):
τHLT=tr(X−1Y) (2)
whereτHLTcompacts the matricesXandYinto a scalar mea-sure. HLT statistic is chosen here with respect to its clear dif-ferentiation of change and no-change cases such that it maps the no-change case to values centered around the polarimetric dimen-sion, d, and the change case to values much smaller or much larger than that. It is worth noting that the HLT can be used to test either kind of change correspond to backscatter decrease and increase or even both. To achieve final change/no-change map thresholding process has been performed. In this paper we adopt Kittler and Illingworth method to perform the thresholding step.
2.2 Thresholding
LetT be the scalar feature image whose pixels are quantized gray level values{t1, t2, ..., tn}. If we suppose that these gray
level values are independent identically distributed (i.i.d.) , the K&I addresses the problem of change detection as a two cate-gory (change and no-change) classification problem that is ac-complished by minimizing a so-called criterion function. This completely automatic unsupervised approach distinguishes two hypothesesH0 andH1by an optimum threshold value,τ, such that thekth pixel belongs toH0 category iftk ≤τ and toH1
category iftk> τ.
Assuming that h(t) is the histogram of the scalar feature im-age, K&I method assumes the histogram as a mixture population probability density function (PDF),p(t), that each components of the mixture has a given distribution with its parameters and a prioriprobabilityPi(i = 1,2)(Kittler and Illingworth, 1986). There exists a gray level,τ, for which:
is taken into account to replace a gray level value,t, by a correct scalar value given by:
andPiτcan be estimated through histogram of the scalar feature
image by this equation: finding the optimal threshold. With an averaging over the whole image the criterion function can be characterized:
J(τ) =X t
h(t)ε(t , τ) (7)
By minimizing this discriminant function the minimum-error thresh-old is defined, i.e.τm=arg min{J(τ) :τ=t1, t2, ..., tn}.
The Generalized Gamma distribution, denoted GΓD, was first proposed by Stacy (Stacy, 1962) and has been widely applied in many fields. Having three parameters this distribution has a highly flixible form and good fitting capability to the histograms of change and no-change classes. The probability density func-tion of the GΓD is given by (Krylov et al., 2011): WhereΓ(.)denotes the usual Gamma function andνiis not zero,
κi, andσiare positive real values refer to the power, shape, and
scale parameters respectively(i= 0,1). This probability density spans a rich and versatile family of parametric distributions in which it includes several statistical behaviors. Specifically, Ex-ponential (forκi = 1, νi = 1), Rayleigh (κi = 1,νi = 2),
Nakagami (νi= 2), Weibull (κi= 1), and Gamma (νi= 1) are
the subfamilies thus far considered in the literature. The lognor-mal distribution is also obtained as a limiting parametric model when (κi→ ∞).
The cruicial step of PDF parameter estimation in present paper is performed by using method of log-cumulants (MoLC). This pa-rameter estimation method have been proposed by (Tison et al., 2004) turns out to be a well-known and precise estimation method that has been recently adopted in many literatures of the analysis and processing of SAR images (Oliver and Quegan, 2004). It is demonstrated that, applied to a selection of PDF families, MoLC enabled to obtain more feasible system of equations and applica-ble to a smaller sample as compared to usual method of moments, meanwhile the maximum likelihood approach is not directly ap-plicable (Krylov et al., 2011). In the MoLC, it is proposed to ex-ploit Mellin transform instead of usual Fourier and Laplace trans-forms in order to define second-kind charasteristic functions for the analysis of specifically positive-valued PDFs. Specially for a positive valued random variable,u, with PDFp(u)defined on u∈R+
The International Archives of the Photogrammetry, Remote Sensing and Spatial Information Sciences, Volume XL-2/W3, 2014 The 1st ISPRS International Conference on Geospatial Information Research, 15–17 November 2014, Tehran, Iran
This contribution has been peer-reviewed.
This transform is referred to as the first second-kind charasteristic function. The second charasteristic function of the second-kind is given by the natural logarithm ofΦu(s), i.e.,
ψu(s) =lnΦu(s). (10)
Ther-th order second-kind moment,m˜r, and ther-th order
second-kind cumulant,˜kr, is defined in the way of definition of the
tradi-tional moments and cumulants:
According to (11), we call the second-kind moments aslog-moments and in the same way, the second-kind cumulants are called log-cumulants. For a set of i.i.d observations {xi}ni=1 the sample estimates of cumulants can be obtained through the following re-lations:
wherer = 2,3. Knowing the sample cumulants, we can solve the system of equation defines MoLC by expressing sample es-timates of log-cumulants as a function of PDF parameters and inverting it.
The MoLC provides for the GΓD the following equations (Krylov et al., 2011): function (Abramowitz et al., 1972). Regarding 13, the estimates
ˆ
be solved by simple numerical procedures to obtainκˆi.
Accord-ing to 14 and 15 and the fact thatΨ(2,ˆκi) < 0, the other two
where sgn(.)is the sign function (Abramowitz et al., 1972). It should be noted that the applicability condition of MoLC to GΓ
PDF is written as (Krylov et al., 2011):
ˆ
k2i≥0.63|ˆk3i|2/3. (19)
Therefore the MoLC system of equations for the GΓD case is compatible with samples that report this condition.
3. EXPRIMENTAL RESULTS
In order to assess the capability of the proposed approach, a real data set made up of a subset (300×233pixels) of two Radarsat-2 fully polarimetric SAR images are used. They have been ac-quired over the Suzhou city, China, on April 9, 2009 and June 15, 2010. The incidence angle in which the data is taken is from range38.37◦
to38.95◦
. Between the two acquisition dates, we have a series of ground changes occurred in the scene due to urban expansion. The pauli decomposition images of these two PolSAR images are shown in Figure 2(a) and Figure 2(b) and the main changes are labeled by red oval in the latter Figure. A test map (see Figure 2(c)) which is made up of 3071 no-change test pixels and 1320 change pixels is available.
(a) (b)
(c)
Figure 2: Multitemporal PolSAR images relating to the city of Suzhou used in this experiment. (a) April 9, 2009 pauli decom-position image. (b) June 15, 2010 Pauli decomdecom-position image. (c) Map of changed areas (ground truth) used as reference in the ex-periment. Color legend for (c): white, change; gray, no-change; black, unlabeled pixels
Applying HLT statistic to this PolSAR data set, we have achieved the scalar feature images shown in Figure 3. It can be inferred from this figure that we have changes arising either radar backscat-ter increase (main changes occured in the scene; see Figure 3(a)) or decrease (upper right relatively white areas and the lineal struc-tures occurred in lower left part of Figure 3(b) labeled by red oval) where adopting HLT allows for detecting both. Final change detection map was attained by implementing the proposed K&I approach on the quantized HLT images (see Figure 4(a)) and
The International Archives of the Photogrammetry, Remote Sensing and Spatial Information Sciences, Volume XL-2/W3, 2014 The 1st ISPRS International Conference on Geospatial Information Research, 15–17 November 2014, Tehran, Iran
This contribution has been peer-reviewed.
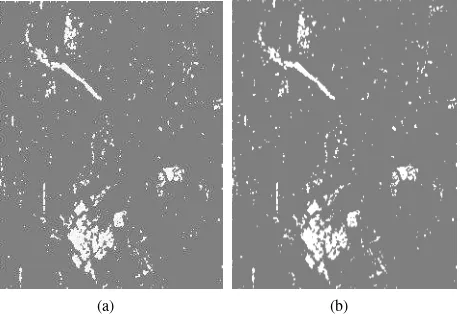
(a) (b)
Figure 3: HLT statistic scalar feature images relating to the data set. (a) tr(X−1Y). (b) tr(Y−1X). Color legend: white, high values of HLT statistic followed by great changes in the direc-tion of increase (a) and decrease (b) of the radar backscatter; gray, smaller values of HLT related to the slight changes in radar backscatter; black, least values in the HLT scalar feature image corresponding to no-change areas.
CFAR-based approach proposed in (Akbariet al., 2013) (see Fig-ure 4(b)). Numerical results show that the proposed method gives a satisfactory detection accuracy (87.12%) comparing to the CFAR-based detection in (Akbariet al., 2013) result (85.00%). As it can be seen in table 1, we obtained a superior performance of the pro-posed generalized K&I method based on overall error rate where the measured OER for this method is4.17%against4.50%in confidence level1.00%for the CFAR-based method.
(a) (b)
Figure 4: Final results of the unsupervised change detection for experimental data. Details of change obtained in case of (a) the generalized K&I method proposed in this paper (b) CFAR method. Color legend: white, change; gray, no-change; black, unlabeled pixels
Table 1: Change detection performances Method overall error rate detection rate false-alarm rate K&I 4.17% 87.12% 0.42 % CFAR 4.50% 85.00% 0.35%
4. CONCLUSION
We have proposed a novel unsupervised change detection, em-ploying the minimum-error K&I algorithm on the complex-kind HLT trace statistic scalar feature image. This scalar feature im-age was attained by applying HLT statistic to two multilook
po-larimetric SAR images. Having a series of PolSAR images ac-quired over the same geographical area, the numerical results show that the proposed algorithm proves to be effective in min-ing the changes occurred between any two times of the tempo-ral series. In particular, a comparison between the results of the proposed unsupervised algorithm and the results of the CFAR-based method in (Akbariet al., 2013) confirmed the capability of the approach, as we obtained a superior performance for the proposed approach as compared to the recently proposed CFAR-based algorithm. GΓD PDF parameter estimation as a key stage in the process has a great effect on the final results, where if we have good-fitted PDFs to the histograms of change and no-change classes followed by an exact parameter estimation, a more ac-curate change detection results will be achieved; therefore we should assess and further analysis thegoodness-of-fitof the es-timated PDFs numerically, that would be considered for future journal work.
REFERENCES
Abramowitz, M., Stegun, I. A. et al., 1972. Handbook of mathe-matical functions. Vol. 1Number 5, Dover New York.
Akbari, V., Doulgeris, A. P. and Eltoft, T., 2013. Monitoring glacier changes using multitemporal multipolarization SAR im-ages. Geoscience and Remote Sensing, IEEE Transactions on PP(99), pp. 1–13.
Akbari, Vahid, A. S. N. D. A. P. and Eltoft, T., 2013. The Hotelling-Lawley trace statistic for change detection in polari-metric SAR data under the complex Wishart distribution. Geo-science and Remote Sensing Symposium (IGARSS), 2013 IEEE International pp. 4162–4165.
Conradsen, K., N. A. A. S. J. and Skriver, H., 2003. A test statistic in the complex Wishart distribution and its application to change detection in polarimetric SAR data. Geoscience and Remote Sensing, IEEE Transactions on 41(1), pp. 4–19.
Julio, P. and Adem, K., 2011. Data mining and knowledge dis-covery in real life applications.
Kittler, J. and Illingworth, J., 1986. Minimum error thresholding. Pattern recognit. 19(1), pp. 41–47.
Krylov, V. A., Moser, G., Serpico, S. and Zerubia, J., 2011. On the method of logarithmic cumulants for parametric probability density function estimation.
Marino, A., C. S. and Sanchez-Lopez, J., 2013. A new polari-metric change detector in radar imagery. Geoscience and Remote Sensing, IEEE Transactions on 51(5), pp. 298–3000.
Moser, G. and Serpico, S. B., 2006. Generalized minimum-error thresholding for unsupervised change detection from SAR ampli-tude imagery. Geoscience and Remote Sensing, IEEE Transac-tions on 44(10), pp. 2972–2982.
Oliver, C. and Quegan, S., 2004. Understanding synthetic aper-ture radar images. SciTech Publishing.
Park, S.-E., Yamaguchi, Y. and Kim, D.-j., 2013. Polarimet-ric SAR remote sensing of the 2011 Tohoku earthquake using ALOS/PALSAR. Remote Sensing of Environment 132, pp. 212– 220.
Stacy, E. W., 1962. A generalization of the gamma distribution. The Annals of Mathematical Statistics pp. 1187–1192.
Tison, C., Nicolas, J.-M., Tupin, F. and Maˆıtre, H., 2004. A new statistical model for markovian classification of urban areas in high-resolution sar images. Geoscience and Remote Sensing, IEEE Transactions on 42(10), pp. 2046–2057.
The International Archives of the Photogrammetry, Remote Sensing and Spatial Information Sciences, Volume XL-2/W3, 2014 The 1st ISPRS International Conference on Geospatial Information Research, 15–17 November 2014, Tehran, Iran
This contribution has been peer-reviewed.