APPLICATION OF MOBILE LIDAR MAPPING FOR DAMAGE SURVEY
AFTER GREAT EAST JAPAN EARTHQUAKE
Emiko Ariyasu a*, Megumi Koizumi a, Masahiro Ikubo a, Shuhei Hatake a
a Department of Geomatics Development, Asia Air Survey, 1-2-2 Manpukuji Asao-ku Kawasaki-shi Kanagawa, Japan –
(emk.ariyasu, mgm.koizumi, ff.ikubo, sh.hatake)@ajiko.co.jp
Commission TCs, I, III and V
KEY WORDS: MMS, laser, accuracy, point cloud, cadastral survey, mapping,
ABSTRACT:
A massive earthquake of magnitude 9.0 hit off Tohoku region, the east coast of the Japanese main land, on 11 March, 2011. It was one of the historically powerful earthquakes in the world. The earthquake triggered powerful tsunami and broad-scale subsidence, so that, residential areas and infrastructures were catastrophically damaged. After that, it is necessary to renew a new map for
reconstruction, such as cadastral map. In the critical situation, Mobile LiDAR Mapping system is efficient to rapidly collect fine data at once and capture more details of terrain features than data from airborne. In this paper, we would like to introduce procured instruments in our company and implemented survey several areas after the event, and suggest how to survey for cadastral map by Mobile LiDAR Mapping System.
1. INTRODUCTION
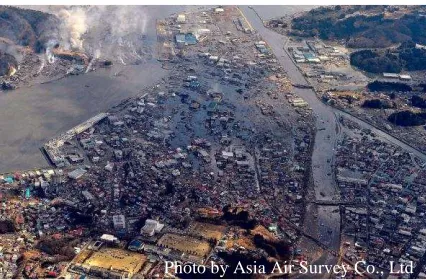
On March 11, 2012, at 2:46 JST (5:46 GMT) in the evening, Tohoku and Kanto region in Japan hit a magnitude 9.0 earthquake, and its quake generated a devastating tsunami (Figure 1). It is estimated that the initial tsunami wave took 10 to 30 minutes to make its first landfall, and the more than 10 m height of tsunami is reached along Pacific Ocean in 530 km. Also, the highest wave from the tsunami was estimated approximately 40 m at Ofunato, Iwate, according to 2011 Joint Survey Group. Such unpredicted massive tsunami caused extensive damage in Tohoku region, Japan. National Police Agency on April 12, 2012 reported that 15,856 people killed, 3,070 missing, 129,404 buildings totally collapsed, 3,918 roads, 78 bridges and 29 railways destroyed or damaged by the earthquake and the tsunami along the coast of Pacific ocean. Also, the latitude of earthquake, it is reported by Geospatial Information Authority of Japan (GSI) that the ground at Oshika Peninsula northeast of Sendai moved 5.3 meters eastward and fell by 1.2 meters by tectonic force, and the other places also were moved over a meter in the Tohoku region. In addition, it is reported liquefaction and landslides by field survey with academic and research organizations after Tohoku earthquakes. Such massive damage washed out existed maps or made existed maps useless for the broad-scaled crustal deformation, and changed the location of terrain features. Thus, the damaged area is rapidly required to make a new map for reconstructing the area.
Terrestrial Mobile LiDAR Mapping System has started to materialize into actual development over the last decade of the previous century. This system operates a platform on a standard vehicle roof, which are mounted LiDAR sensors with several digital cameras at targeting sides and geospatial information tools like GNSS and IMU. In Japan, the integrated system is generally called MMS, which stands for Mobile Mapping system. MMS is getting to be popular in the worldwide for
infrastructural mapping and monitoring for rapidly collecting fine data at once. The advantage of MMS is helpful to survey the earthquake-damaged area for making a cadastral map, which will be rapidly collected data. The aim of paper is to introduce practical examples of MMS survey at the earthquake, and suggest how MMS is fully contributed to effectively re-settle in the earthquake-devastating area, considering experiences of MMS survey in the event.
Figure 1. Kesen-numa city damaged by Tsunami
2. PROCUREMENT
2.1. GeoMaster NEO 1
GeoMaster NEO 1 is the first system, which procured on March, 2011 from StreetMapper mounting systems from 3D Laser Mapping Company in England and IGI in Germany (Figure 2). The system is mounted two 2D laser scanners, VQ250 in Riegl in Austria, pulse 300 KHz, two 1200 MB pixels digital cameras in front and rear, spherical digital camera, Ladybug3, on the top of platform, and optical odometer at rear side of the car. This system was in training period when the earthquake occurred, but
Photo by Asia Air Survey Co., Ltd
* Corresponding author.
International Archives of the Photogrammetry, Remote Sensing and Spatial Information Sciences, Volume XXXIX-B1, 2012 XXII ISPRS Congress, 25 August – 01 September 2012, Melbourne, Australia
urgently utilized for recoding data in April and successfully worked to collecting data.
Figure 2. GeoMaster NEO 1
2.2. GeoMaster NEO 2
GeoMaster NEO 2 is as same as the first system but distributed at West division in December, 2011 (Figure 3). Since there is a problem in GeoMaster NEO1 which occurred lower image quality with higher driving speed, digital cameras both front and rear sides were altered to degrade into 500 MB pixels, considering more focus on the shutter speed. GNSS is also switched to one which GLONOSS is receivable.
Figure 3. GeoMaster NEO 2
2.3. GeoMaster NEO 3
GeoMaster NEO 3 is procured from Mitsubishi Electronics in April, 2012, which differs from former systems (Figure 4). The difference is to be mounted a high-accurate LiDAR data collection, Z/F9000, at phase-shift type. As a result, it is available to collect more detailed LiDAR data in 1 mm resolution, even though the former systems are acquired with only 1 cm resolution at time-of-flight system. As the other advantages for GeoMaster NEO 3, the reflectance frequency is about 1000 KHz and the nodding rotation is performed 200Hz. Also, this system is mounted 5 digital cameras in the same type with the second system (right front, left front, right side, left side, and rear side) and spherical digital camera, Ladybug3. Those multiple sensors are expected to utilize not only for digital road mapping, but also for assessment of road surface control and road infrastructure management.
Figure 4. GeoMaster NEO 3
3. SURVEY OF DISASTER DAMAGE
3.1. Liquefaction Damage
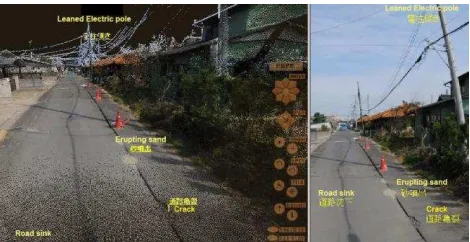
Liquefaction in Kasumigaura, Kanto-region was surveyed with GeoMaster NEO 1 in April 1, 2011. There are many places occurred liquefaction which caused by the soil type, called Kanto loam. It is a typical volcanic ash soil covering diluvial upland, as high hydraulic conductivity, high porosity, and complex soil texture (Yamazaki et al., 1963). The liquefaction was caused to collapse electric poles and houses and
water-saturated sediments along roads after the earthquake. Our company was surveyed the disaster damage with MMS to understand the terrestrial condition, and it was succeeded to detect crack in the road, floated manholes, and leaned electric poles on a screen using a original display software for MMS, LaserMap Viewer (Figure 5).
Figure 5. Liquefaction in Itako city - MMS (left) and a picture (right)
3.2. Tsunami Disaster Damage
Our company surveyed several damaged places after the event with MMS for four days since April 20, 2011: Abukuma estuaries, Kitakami-river levee, and Onagawa.
The survey of Abukuma estuaries was surveyed the disaster damage from a side. Miyagi offshore including this place had been acquired data from airborne LiDAR with 1 point/m2, but also used MMS for understanding more details of scouring.
Kitakami river levee was recorded data in both side of right and left of the crown, and found the levee failures and road collapses. There is a disadvantage in this place which is levee-like filled-up International Archives of the Photogrammetry, Remote Sensing and Spatial Information Sciences, Volume XXXIX-B1, 2012
XXII ISPRS Congress, 25 August – 01 September 2012, Melbourne, Australia
land that is hardly reflected in the foot of slope and the surface of levee.
Onagawa at Oshika peninsula is a famous fishing harbor. This area hit 20m tsunami, so that, collapsed third- and four- floor building. A lot of buildings were devastated by objects like car. MMS was able to detect damages by the event (Figure 6).
Figure 6. Two images of the holed building by tsunami – left: point cloud data, right: photography image
4. SUGGESTION
4.1. Cadastral survey
Cadastral survey is a land survey that ensures land boundaries for land valuation and taxation under the laws of land ownership. The survey is essential to reconstruct infrastructure for promptly setting up a reconstruction plan as a database to redevelop for city plan, construction, considering safety for the future. Also, it is necessary to estimate adequate compensation for the disaster. Tohoku region has been developed cadastral map in 90% before the event. However, the map has been washed out by the accurately measurable with level of a few cm which is ten times finer than aerial imagery.
- It is able to accurately measure the edge of road and possible to rapidly measure at lower cost.
- Landowner easily understands the current land information taken by MMS, which is close to eye angles
4.1. Accuracy (Required Accuracy for Cadastral survey vs Accuracy of MMS)
Accuracy of cadastral survey is required to follow National Land Survey Law, which enacted in 1951. The level of accuracy differs from types of landuse, which is related with population.
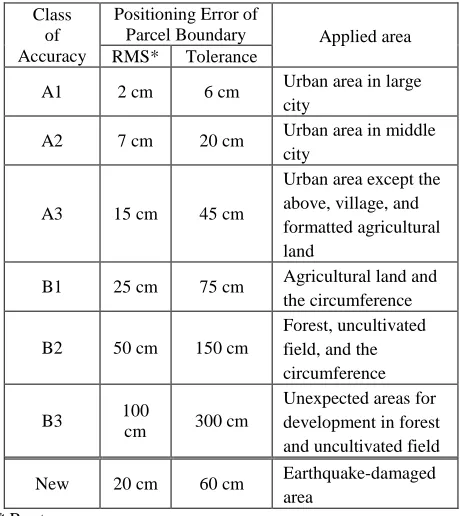
For example, urban areas where many people live are required to survey in the highest level of accuracy. The classes of landuse at earthquake-damaged area are dominated with small towns and agricultural lands, which are ranged from A3 to B1 level on the Standard (Table 1). That means that the survey level is adequate to take in RMS 20 cm and tolerance 60 cm. Also, this level is possible to take data in MMS.
Class
Table 1. National Land Survey Law with idea of earthquake-damaged area
The MMS accuracy verification is implemented on an edge of white line like a pedestrian crossing, which is easily discriminated by reflectance intensity (Figure 7). Table 2 shows the values taken with 142 points by RTK-GPS survey at a good condition for receiving GPS. Both values of errors are applicable to product 1:500 scale geological map.
Figure 7. A targeting point for MMS accuracy verification
Horizontal Error (RMS) 6.3 cm Vertical Error (RMS) 4.6 cm
Table 2. RMS error from 142 points in a good condition
However, bad conditions for receiving GNSS like urban area are rapidly increased cost and time to utilize control points for adjustment and implement field surveys for improving the accuracy.
The survey from MMS is often expected the rapidity. Consider International Archives of the Photogrammetry, Remote Sensing and Spatial Information Sciences, Volume XXXIX-B1, 2012
XXII ISPRS Congress, 25 August – 01 September 2012, Melbourne, Australia
of the rapidity, it will be better to set up RMS error from 15 cm to 20 cm for avoiding additional works like field survey for the cost. When consider the accuracy, cadastral survey by MMS is applicable to survey classes from A3 to all B.
4.2. Features of Current Situation Map for Cadastral
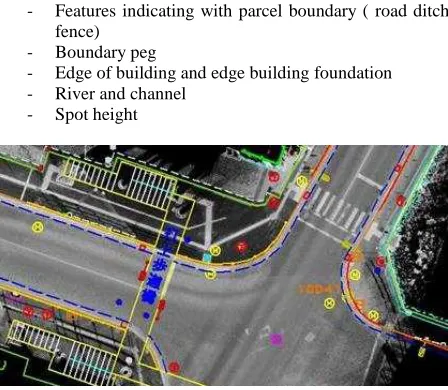
MMS is effective to utilize for collecting positioning data of public and private boundary along roads. In this technique has been implemented by Asia Air Survey Co., Ltd under a project, “Urban area parcel boundary fundamental study” (Tokyo) from Ministry of Land, Infrastructure, Transport and Tourism since 2010. Targeting areas will be surveyed the all along every drivable roads, and features taken in the field survey for relating with cadastral current situation map are below;
- Features indicating with parcel boundary ( road ditch, fence)
- Boundary peg
- Edge of building and edge building foundation - River and channel
- Spot height
Figure 8. Current situation map with MMS data
5. CONCLUSION
The Great East Japan Earthquake hit Japan and devastated northeastern region of Japan. The earthquake and the tsunami destroyed all terrestrial objects and cut off infrastructures and transportation. Also, the earthquake caused crustal movement. Japanese government is required to rapidly corresponding to make a map for adequate reconstruction because there are many victims surfer from the disaster. The damaged area is essential to secure basic infrastructure for restoration, but it is necessary to complete cadastral survey at first.
After the disaster survey by MMS, it is proved that MMS was useful to rapidly collect data for reconstruction after a massive disaster at once. The survey style is expected to be one of powerful tools to survey a disaster as well as airborne photo and airborne LiDAR. Also, it is possible to contribute the field survey related with cadastre. However, MMS data processing takes more than 5 to 6 times more than airborne LiDAR for massive complicating data. For example, the density of point cloud is so high that is more than 400 points/m2 and manually filtering process for removing undesirable data, such as people and car. The disadvantage should be solved by improving in a new method and a new data processing. Therefore, the restoration at massive disaster area will be recovered as soon as possible.
ACKNOWLEDGEMENT
We would like to express my heartfelt condolences to the victims of Great East Japan Earthquake, and we are very sorry for suffering people and their family in disaster areas. Also, as Japanese, We very appreciate for all the supports and aids from worldwide.
REFERENCES
Geospatial Information Authority of Japan. 2011. Tectonic force from the M9.0 earthquake (vertical and horizontal movement)
National Police Agency of Japan., 2012. Damage Situation and Police Countermeasures associated with 2011 Tohoku district – off the Pacific Ocean Earthquake (April 11, 2012).
The Act on Special Measures for Promotion of National Land Survey. 1951. National Land Survey Law.
The 2011 Tohoku Earthquake Tsunami Joint Survey Group (2011) Nationwide Field Survey of the 2011 off the Pacific Coast of Tohoku, The 2011 off the Pacific coast of Tohoku Earthquake Tsunami Information. http://www.coastal.jp/ttjt/ (1 June, 2012).
Yamazaki, F., Yawata,. and Sudo, S. 1963. Physical properties of the Kanto Loam (in Japanese). Trans. Agric. Engng Soc. Japan . No. 7, 1-13.
International Archives of the Photogrammetry, Remote Sensing and Spatial Information Sciences, Volume XXXIX-B1, 2012 XXII ISPRS Congress, 25 August – 01 September 2012, Melbourne, Australia