L
Journal of Experimental Marine Biology and Ecology 244 (2000) 239–252
www.elsevier.nl / locate / jembe
Role of ciliates, flagellates and bacteriophages on the
mortality of marine bacteria and on dissolved-DNA
concentration in laboratory experimental systems
a b b a ,*
M.C. Alonso , V. Rodriguez , J. Rodriguez , J.J. Borrego
a
Department of Microbiology, Faculty of Sciences, University of Malaga, Campus de Teatinos, 29071 Malaga, Spain
b
Department of Ecology, Faculty of Sciences, University of Malaga, Campus de Teatinos, 29071 Malaga,
Spain
Received 9 March 1999; received in revised form 3 September 1999; accepted 21 September 1999
Abstract
Several marine bacteriophages, a ciliate (Uronema sp.), and a flagellate (Pseudobodo sp.) were used to study comparatively the grazing and clearance rates of four marine bacteria. Bacteria were fluorescently labelled using rhodamine isothiocyanate. The results obtained indicate that bac-teriophages and flagellates caused a significantly higher (P,0.025) decrease in the number of marine bacteria compared to the ciliate Uronema sp. The role of bacteriophages, ciliates and flagellates in the production of dissolved-DNA (D-DNA) was also studied. The interaction between both bacteriophages and protists with marine bacteria are responsible for an increase of the D-DNA concentration, although a direct relationship between D-DNA concentration and predator number was only obtained from experiments performed with Uronema sp. 2000 Elsevier Science B.V. All rights reserved.
Keywords: Grazing; Ciliates; Flagellates; Bacteriophages; Dissolved DNA; Marine bacteria.
1. Introduction
It is generally accepted that bacterial production in the aquatic environment is kept balanced by protozoan grazing (mainly by microflagellates) (McManus and Fuhrman, 1988; Pace, 1988). However, different studies have suggested that this mechanism does not completely explain the mortality of bacteria in marine ecosystems. Therefore, other
*Corresponding author. Tel.: 134-5-213-1893; fax: 134-5-213-2000.
E-mail address: [email protected] (J.J. Borrego)
factors, such as spontaneous or induced lysis, must be considered (Servais et al., 1985; Sherr et al., 1989). Fuhrman and Suttle (1993) proposed that a proportion of marine bacterial mortality was the result of viral lysis.
Although it is well established that viruses can infect marine bacteria, little is known about their role as control agents of the microbial community structure and as genetic vectors. In addition, the amount of carbon cycled through the viral component is not well established yet (Bratbak et al., 1992).
Infection by marine viruses may be also an important mechanism to increase the amount of dissolved organic matter (DOM). DNA is a component of the DOM pool of both marine and freshwater ecosystems (DeFlaun et al., 1986; DeFlaun and Jeffrey, 1987; Paul et al., 1987), in which it could be used as microbial nutrients (nitrogen and phosphorus) or as a nucleotide source.
In this work, a laboratory comparative analysis has been performed in order to determine the relative importance of ciliates, flagellates and bacteriophages on the mortality of marine bacteria. In addition, several experiments have also been conducted to determine whether prey–predator interactions could be a significant source of dissolved-DNA (D-DNA) in the marine environment.
2. Materials and methods
2.1. Microorganisms
Two species of bacterivorous protozoa were used: Uronema sp., a small, ovoid ciliate (ca. 20mm in length), and Pseudobodo sp., a flagellate (ca. 10mm in length). Both were isolated from seawater (kindly supplied by Dr Iriberri, University of Pais Vasco, Spain), and maintained with marine bacteria at 158C in cereal leaves infusion (CLI) (Lee and Soldo, 1992).
Bacteria used to maintain the protozoan cultures were removed by gravity filtration through 8-mm pore-size cellulose ester filters (Millipore, SC) for ciliate cultures, or through 3-mm pore-size filters (Millipore, SS) for flagellate cultures (Simek and Chrzanowski, 1992).
Marine bacterial strains named A-1, P-1, B-1 and B-2 were used as prey. They were isolated from coastal seawater of the Alboran Sea (south of Spain) using a medium composed of seawater enriched with 0.05% peptone (Difco), 0.05% yeast extract (Difco) and 1.5% agar (Difco) (ESW agar). Cultures were incubated for 24 h at 228C. All the bacteria isolated were partially identified following the criteria described by West et al. (1986). All of them were motile rods, oxidase positive, catalase positive (except for the P-1 strain), and unable to grow in media without NaCl. Strain B-1 was identified as
Vibrio alginolyticus.
Bacteriophages were isolated from seawater concentrated using a tangential flow filtration system with an exclusion size of 50 kDa (Filtron, Mini-Ultrasette), operating at
21
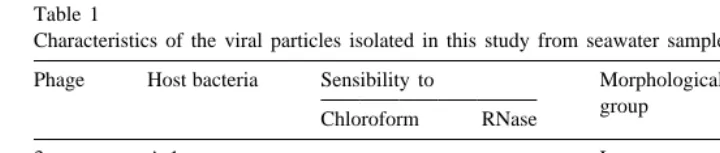
Table 1
Characteristics of the viral particles isolated in this study from seawater samples
Phage Host bacteria Sensibility to Morphological
group Chloroform RNase
3 A-1 2 2 Long non-contractil tail
7 P-1 2 2 Long contractil tail
16 B-2 1 2 Long contractil tail
18 B-1 2 2 Long contractil tail
2.2. Virus–bacteria interaction: experimental design
Volumes of 200 ml of sterile seawater were dispensed in 500-ml flasks, and a suspension of each bacteriophage and host bacteria studied was added to achieve a
21
multiplicity of infection (MOI) of about 6 PFU bacteria . Control experiments using only bacterial cultures were performed. Each phage–bacteria system was assayed in duplicate at 228C.
Samples, collected every 2 h for 10 h, and at longer intervals until 48 h, were fixed with glutaraldehyde (2.5%) and the bacterial number determined by epifluorescence microscopy using a Nikon microscope after staining with 1-4 diamidino-2-phenylindole (DAPI, Sigma), as described by Porter and Feig (1980). Bacterial counts were carried out on randomly selected fields (at least 100 bacteria per sample). Simultaneously, phage numbers were determined as plaque forming units (PFU) by the direct plaque assay.
2.3. Fluorescently labelled bacteria (FLB) uptake experiments
Grazing experiments by protozoa were carried out in 400 ml of sterile seawater dispensed into 500-ml flasks previously soaked with acid and thoroughly rinsed with
21
distilled water. Protozoa were inoculated at densities of 30–100 cells ml for Uronema
21
sp. (Sherr et al., 1992; Strom et al., 1993), or at ca. 1000 cells ml for Pseudobodo sp. ´
(Caron et al., 1991; Gonzalez and Suttle, 1993).
The technique based on the uptake of FLB (Sherr et al., 1987) was used to estimate the ingestion rates of four marine FLB by Uronema sp. and Pseudobodo sp. Bacteria stained with rhodamine isothiocyanate (RITC) were inoculated at concentrations ranging from 30% (for determining grazing rates by Pseudobodo sp.) to 10% (by Uronema sp.)
5 6
of the total bacteria. Initial bacterial concentration ranged between 4310 and 5310
21
bacteria ml .
After addition of FLB, the flasks were maintained for 1 h at 228C in the dark. In the first 10 min, samples were removed each 2 min and subsequently at 15, 20, 30, 45 and 60 min. They were fixed using the Lugol–Formalin decoloration technique (Sherr et al., 1988).
In order to determine the concentration of protozoa, samples were stained with DAPI
21
Bacteria stained with RITC were visualized within protozoan vacuoles in preparations stained with DAPI. Protozoa were located under UV light at 31000 or 3200 (for flagellates and ciliates, respectively) and red fluorescing ingested particles were counted under green light at 31000. At least 60 protozoa per sample were inspected to determine the average FLB per cell, which was followed as a function of the time. The slope of the increase of FLB per protozoan (regression analysis) was considered as a measure of grazing.
2.4. Fluorescent labelling of bacteria
´
FLB were prepared as described by Gonzalez et al. (1992) from cultures of four different marine bacteria. Bacterial isolates were grown on ESW broth at 228C with
8 21
gentle shaking to obtain about 10 cells ml , concentrated by centrifugation at 3000g for 20 min, and rinsed three-fold with cold phosphate-buffered saline solution (PBS, pH
21
7.6). Bacteria were finally resuspended in a solution of dithioerythritol (0.04 mg ml in filtered seawater) (Sigma), and maintained at 48C for 4 h prior to the staining procedure. For the staining procedure, bacterial cells were incubated in the dark, at 128C for 4 h, resuspended in a recently prepared staining solution composed of 10 mg of RITC (Sigma), 10 ml of carbonate–bicarbonate buffered solution (pH 9), and 0.4 ml of acetone (per 100 ml of culture); then bacteria were centrifuged and washed three times with PBS. RITC-stained cells were filtrated onto 0.2-mm pore-size polycarbonate filters (Millipore, GTTP) and enumerated at 31000 under green light with a Nikon microscope.
2.5. Calculation of bacterivory rates
Clearance rate per cell, ingestion rate and community grazing rate were used to evaluate the protozoan bacterivory.
21 21
Per-cell clearance rate (nl cell h ) was calculated by dividing the cell-specific uptake rate of FLB by the concentration of FLB per nl (Sherr et al., 1987). Ingestion rate
21 21
(bacteria cell h ) was calculated by multiplying the uptake rate of FLB per protozoan by the ratio of total bacteria to FLB (Pace et al., 1990). Community grazing rate
21 21
(bacteria l h ) was calculated by multiplying the ingestion rate by the protozoan concentration.
ANOVA analyses were used for comparing average values obtained using different bacterial cultures as prey.
2.6. D-DNA production experiments
Other systems, prepared as described above, were sampled periodically to measure D-DNA concentration and predator number from virus–bacteria and protozoan–bacteria interactions. Samples were collected every 2 h for 10 h for virus–bacteria interaction experiments, and at 0, 9, 24 and 48 h for protozoan–bacteria interaction systems.
(Milli-pore, GS), and D-DNA concentration in the filtrate was determined. Other subsamples were fixed with glutaraldehyde (2.5%) and stained with DAPI to enumerate protozoa as
21
mentioned elsewhere. The viral number was determined in PFU ml . Controls with only bacteria were performed.
Previously to perform the assay with virus–bacteria systems, a study of the correlation between the viral number and the D-DNA concentration measured with 3,5-diaminoben-zoic acid (DABA) was carried out. The numbers for the virus in the filtrate volumes through 0.2-mm pore-size cellulose ester filters was always below the threshold of the method employed. For this reason, we can be sure that the DNA measured in this study does not include DNA in viral particles.
D-DNA concentration was measured with DABA (Karl and Bailiff, 1989), using a Hitachi F-2000 fluorometer (excitation at 405 nm, emission at 520 nm).
3. Results
3.1. Virus–bacteria interactions
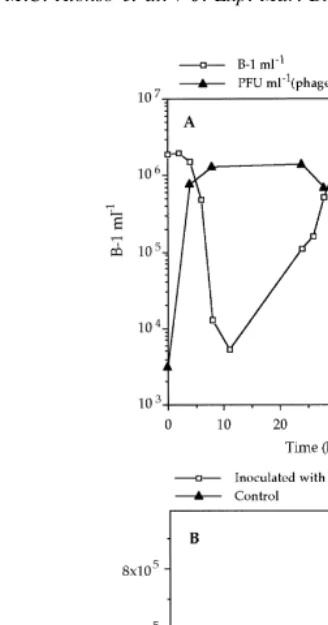
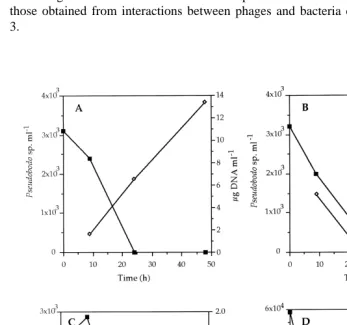
Temporal evolution of the bacterial number was very similar for three of the phage / bacteria systems used (7 / P-1, 18 / B-1 and 16 / B-2). In these systems, an important decrease of bacterial number (2 logs) was observed within the first 11 h [Fig. 1(A)]; subsequently the bacterial number increased to yield values higher than those observed at the beginning of the assay, suggesting that phage-resistant bacteria became predominant [Fig. 1(A)]. The decrease in the bacterial number was always coupled with an increase in the phage particles (3 logs) within the first 8 h [Fig. 1(A)].
In experiments performed with bacteria A-1 and specific phage 3, an increase of the bacterial number was observed during all of the incubation period [Fig. 1(B)]. This result suggests the possibility that phage 3 was a temperate bacteriophage, producing a
21
lysogenic interaction with bacteria A-1. An increase of PFU ml was also observed, reaching the highest yields at 24–48 h [Fig. 1(B)].
The initial slope of the linear regression analysis was considered as the bacterial mortality rate caused by phage infection. The impact of the phage infection on bacterial populations, expressed as a decrease in the bacterial number per hour, is given in Table 2. Mortality rates by phage infection varied both with the phages and the MOI used. No significant differences between the mortality rates were obtained at MOI higher than 1. The lowest value was obtained with bacteriophage 7, which resulted in a decrease in the
7 21 21 8
bacterial number of 3.6310 bacteria l h , compared to about 1–2310
21 21
bacteria l h for the other phages. The mean decreases in the bacterial numbers resulting from viral lysis in relation to bacterial concentration at 0 h were 3.3, 0.5 and 20.1% for P-1, B-1 and B-2 bacteria, respectively.
Fig. 1. (A) Evolution of bacteria and phage number in experiments with the bacteria / phage system B-1 / 18. (B) Evolution of bacterial number in experiments with the system phage 3 / bacteria A-1.
3.2. Protist–bacteria interactions
The uptake of bacteria stained with RITC with Uronema sp. or Pseudobodo sp. was linear for 15–20 min, and then the average number of FLB per cell remained constant or showed a slight decrease over time.
The rates of FLB uptake were used to calculate the clearance rate per cell, ingestion rate, and community grazing rate. The ingestion rate by Uronema sp. varied between
2 2 21 21
3.8310 (for A-1) and 1.5310 (P-1) bacteria ciliate h and, the clearance rate
3 2 21 21
varied between 5310 (for bacteria B-1) and 5.6310 (for A-1) nl ciliate h (Table 3).
In Table 3 a summary of the grazing rates by the flagellate Pseudobodo sp. is also
21 21
expressed. The clearance rate varied between 20 and 40 nl flagellate h , and the
21 21
ingestion rate between 17.4 and 87.9 bacteria flagellate h .
Table 2
Values of mortality rates caused by phage infection calculated by regression analysis 21 21
Uronema sp. and Pseudobodo sp. did not vary significantly with the bacterial strain used
as prey (ANOVA P.0.05).
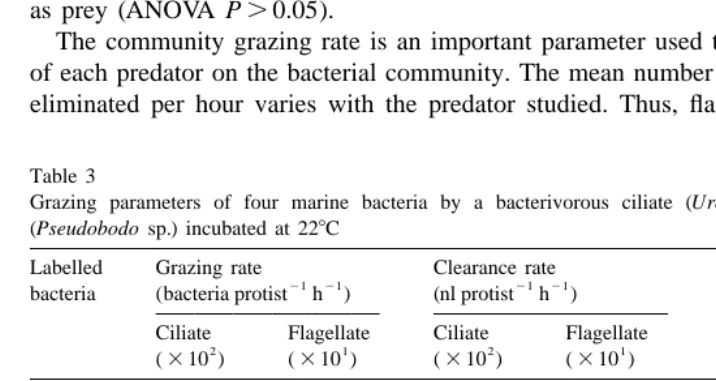
The community grazing rate is an important parameter used to determine the impact of each predator on the bacterial community. The mean number of four marine bacteria eliminated per hour varies with the predator studied. Thus, flagellates caused a mean
Table 3
Grazing parameters of four marine bacteria by a bacterivorous ciliate (Uronema sp.) and a flagellate (Pseudobodo sp.) incubated at 228C
Labelled Grazing rate Clearance rate Community grazing rate
21 21 21 21 21 21 bacteria (bacteria protist h ) (nl protist h ) (bacteria l h )
Ciliate Flagellate Ciliate Flagellate Ciliate Flagellate
7 21 21
decrease of bacterial concentration of 7.461.6310 bacteria l h , showing a higher activity (significant differences, ANOVA P,0.025) than that obtained in experiments
7 6
carried out with Uronema sp., in which a consumption between 2.2310 and 5.9310
21 21 7
bacteria l h was calculated (1.160.4310 ). However, the decrease of the bacterial
7
number caused by phages (6.263.5310 ) was not significantly different from the mean of the community grazing rate calculated in experiments with Pseudobodo sp. (ANOVA
P.0.05).
3.3. D-DNA as a result of prey–predator interactions
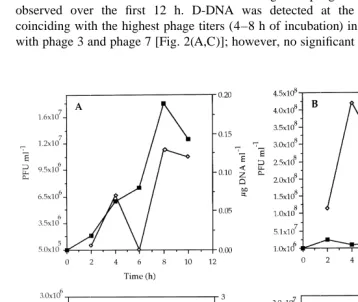
Fluctuations of D-DNA concentration resulting from phage–bacteria interactions were observed over the first 12 h. D-DNA was detected at the highest concentrations coinciding with the highest phage titers (4–8 h of incubation) in experiments performed with phage 3 and phage 7 [Fig. 2(A,C)]; however, no significant relationships (P.0.05)
were obtained. The lowest D-DNA concentrations were obtained using phage 3, which did not cause a lytic effect on bacteria A-1 [Fig. 2(A)].
Control experiments did not yield detection of D-DNA except for B-1 bacteria (V.
alginolyticus), which can be the result of an autolysis process when it is incubated in
seawater for a long time. However, D-DNA concentrations in these controls were always lower than those determined from microbial interaction experiments.
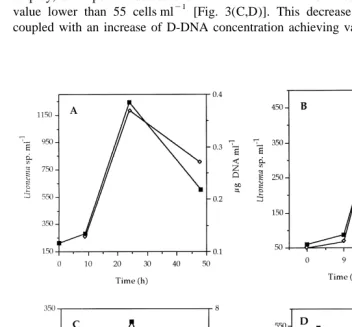
The temporal relationship between the ciliate number and the D-DNA concentration was drawn in Fig. 3. In experiments with B-1 and A-1 bacteria, a direct relationship was observed [Fig. 3(A,B)], since periods of high D-DNA concentration coincided with
21
peaks of ciliate number, with 0.4 and 0.9mg D-DNA ml . When P-1 or B-2 were used as prey, an important decrease of ciliate number was observed, obtaining a minimum
21
value lower than 55 cells ml [Fig. 3(C,D)]. This decrease of ciliate number was coupled with an increase of D-DNA concentration achieving values as high as 6.3 and
21
13mg ml for P-1 and B-2 bacteria, respectively. These high concentrations may be the result of protist lysis and may not be derived from interactions between protists and bacteria.
A decrease of flagellate number was observed in all the experiments performed with
Pseudobodo sp. (Fig. 4). D-DNA concentration was the highest when the flagellate 21
number was under 55 cells ml (after 24–48 h of incubation), reaching values of 1.8,
21
13.4 and 4.1mg ml for P-1, A-1 and B-2 bacteria, respectively. In experiments carried out with B-1 bacteria [Fig. 4(D)], D-DNA was only detected after 9 h of incubation (0.6
21
mg ml ).
The highest D-DNA concentrations from protist–bacteria interactions were lower than those obtained from interactions between phages and bacteria except for bacteriophage 3.
4. Discussion
Abundance of bacteria fell as a result of viral infection (Table 2) within the range of
7
values published by Bratbak et al. (1992), who calculated decreases of about 7310
21 21
bacteria l h . Mean decreases of the bacterial systems were 3.3, 0.5 and 20.1% for the P-1, B-1 and B-2 bacteria, respectively. Similar results were obtained by Middelboe et al. (1996) who calculated a decrease in marine bacterial concentration by viral lysis of about 6%. In addition, Hennes and Simon (1995) demonstrated a similar effect of viral lysis on microbial community structure by using fluorescently labelled viruses.
The increase in bacteriophages simultaneously with the decreasing bacterial numbers observed in this study [Fig. 1(A)], suggests that the decrease in the bacterial number is caused by phage-induced lysis, and not by the presence of growth-inhibitory substances added with the phage inoculum.
Interaction patterns between bacteria and phages 7, 18 and 16 suggest a mechanism of bacterial recovery at low growth rate; thus, under poor conditions for bacterial growth, viral infection would be minimized. It is known that the abundance of some bacteria is
4
only affected by bacteriophages when the host density exceeds a threshold of 10
21
cells ml (Wiggins and Alexander, 1985); however, in other studies such a threshold was not reported (Kokjohn et al., 1991). Similar observations were obtained in bacteria–protozoa interaction studies, in which there was a minimum bacterial con-centration for protozoan bacterivory (Bjornsen et al., 1988; Weisse, 1989; Wikner and
¨
Hagstrom, 1991).
In experiments performed with the 3 /A-1 phage / bacteria system, we did not observe a decrease in the bacterial number [Fig. 1(B)]. Based on this result, it was suggested that phage 3 was a temperate bacteriophage. The presence of temperate phages in seawater has been previously reported, suggesting that they are a considerable percentage of marine bacteriophages (Moebus, 1983; Bratbak et al., 1993; Weinbauer et al., 1993; Jiang and Paul, 1994). Therefore, viral production will not only depend on the host cell concentration, but on any external factor able to induce bacterial lysis, and subsequent release of viral particles to seawater (Weinbauer and Suttle, 1996).
The ingestion and clearance rates calculated in this way for Uronema sp. (Table 3)
2 21 21
were similar to other grazing rates (between 23 and 2.4310 bacteria ciliate h ) for several cultured bacteria by U. nigricans (Crisman et al., 1982), but slightly lower than
2 21 21
those reported by Carlough and Meyer (1990) (6.8310 bacteria ciliate h ). Our flagellate clearance and ingestion rates (Table 3) are high compared with those
´
previously reported values (Gonzalez et al., 1990). A possible explanation for these ´
discrepancies is the effect of high temperature (Sherr et al., 1988; Gonzalez et al., 1990; Barcina et al., 1992), or the higher ingestion rates of cultured flagellates compared to natural protist populations (Fenchel, 1982; Caron et al., 1985).
between these three types of predators. Only a few comparative studies have been performed on the effect of bacteriophages and protists on the bacterial concentration. Fuhrman and Noble (1995) and Steward et al. (1996), in experiments with natural communities, obtained similar bacterial mortality caused by phages and flagellates.
Laboratory assays were developed to determine if different prey–predator interactions are responsible for the amount of D-DNA found in seawater. Previously, Turk et al. (1992) suggested a coupling between D-DNA concentration and predator abundance in the marine environment; however, this finding was not demonstrated by our results. Covariations of predator number and D-DNA concentration were only observed in experiments with ciliates (Fig. 3). This lack of correlation was previously observed by Weinbauer et al. (1993), who found significant differences of viral abundance but not in the case of D-DNA concentration under oligotrophic and eutrophic conditions. The highest D-DNA concentration was obtained from bacteria–bacteriophage interactions (Fig. 2). The D-DNA detected from these interactions may derive either from viral or bacterial DNA (Reisser and Vietze, 1993).
The results obtained support the importance of the prey–predator interactions in the production of D-DNA in the marine environment, and the lack of correlation obtained may be explained by the fact that D-DNA is a dynamic element that is simultaneously consumed by the bacterial population.
Acknowledgements
This research was supported by a grant (AM93-0614-CO2) from the Comision ´
Interministerial de Ciencia y Tecnologıa (CICYT) from the Spanish Government. We thank Dr. Juan Iriberri for supplying the protists and M.J. Navarrete for her help in the English revision of the manuscript. [SS]
References
Barcina, I., Ayo, B., Unanue, M., Egea, L., Iriberri, J., 1992. Comparison of rates of flagellates bacterivory and bacterial production in a marine coastal system. Appl. Environ. Microbiol. 58, 3850–3856.
Bjornsen, P.K., Riemann, B., Horsted, S.J., Nielsen, T.G., Pock-Sten, J., 1988. Trophic interactions between heterotrophic nanoflagellates and bacterioplankton in manipulated seawater enclosures. Limnol. Oceanogr. 33, 409–420.
Bratbak, G., Heldal, M., Thingstand, T.F., Rieman, B., Haslund, O.H., 1992. Incorporation of viruses into the budget of microbial C-transfer. A first approach. Mar. Ecol. Prog. Ser. 83, 273–280.
Bratbak, G., Heldal, M., Naess, A., Roeggen, T., 1993. Viral impact on microbial communities. In: Guerrero,
´ ´
R., Pedros-Alio, C. (Eds.), Trends in Microbial Ecology, Spanish Society for Microbiology, Barcelona, pp. 299–302.
Carlough, L.A., Meyer, J.L., 1990. Rates of protozoan bacterivory in three habitats of a southeastern blackwater river. J. N. Am. Benthol. Soc. 9, 45–53.
Caron, D.A., Goldman, J.C., Andersen, O.K., Dennett, M.R., 1985. Nutrient cycling in a microflagellate food chain. II. Population dynamics and carbon cycling. Mar. Ecol. Prog. Ser. 24, 243–254.
Crisman, T.L., Beaver, J.R., Bays, J.S., 1982. Examination of the relative impact of microzooplankton and macrozooplankton on bacteria in Florida lakes. Verh. Int. Ver. Limnol. 21, 359–368.
DeFlaun, M.F., Paul, J.H., Davis, D., 1986. Simplified method for dissolved DNA determination in aquatic environments. Appl. Environ. Microbiol. 52, 654–659.
DeFlaun, M.F., Jeffrey, W.H., 1987. Distribution and molecular weight of dissolved DNA in subtropical estuarine and oceanic environments. Mar. Ecol. Prog. Ser. 38, 65–73.
Fenchel, T., 1982. Ecology of heterotrophic microflagellates. II. Bioenergetics and growth. Mar. Ecol. Prog. Ser. 8, 225–231.
Fuhrman, J.A., Suttle, C.A., 1993. Viruses in marine planktonic systems. Oceanography 6, 51–63. Fuhrman, J.A., Noble, R.T., 1995. Viruses and protists cause similar mortality in coastal seawater. Limnol.
Oceanogr. 40, 1236–1242. ´
Gonzalez, J.M., Suttle, C.A., 1993. Grazing by marine nanoflagellate on viruses and viral-sized particles: Ingestion and digestion. Mar. Ecol. Prog. Ser. 94, 1–10.
´
Gonzalez, J.M., Iriberri, J., Egea, L., Barcina, I., 1990. Differential rates of digestion of bacteria by freshwater and marine phagotrophic protozoa. Appl. Environ. Microbiol. 56, 1851–1857.
´
Gonzalez, J.M., Iriberri, J., Egea, L., Barcina, I., 1992. Characterization of culturability, protistan grazing and death of enteric bacteria in aquatic ecosystems. Appl. Environ. Microbiol. 58, 998–1004.
Hennes, K.P., Simon, M., 1995. Significance of bacteriophages for controlling bacterioplankton growth in a mesotrophic lake. Appl. Environ. Microbiol. 61, 333–340.
Jiang, S.C., Paul, J.H., 1994. Seasonal and diel abundance of viruses and occurrence of lysogeny / bac-teriocinogeny in the marine environment. Mar. Ecol. Prog. Ser. 104, 163–172.
Karl, D.M., Bailiff, M.D., 1989. The measurement and distribution of dissolved nucleic acids in aquatic environments. Limnol. Oceanogr. 34, 543–558.
Kokjohn, T.A., Sayler, G.S., Miller, R.V., 1991. Attachment and replication of Pseudomonas aeruginosa bacteriophages under conditions simulating aquatic environments. J. Gen. Microbiol. 137, 661–666. Lee, J.J., Soldo, A.T. (Eds.), 1992. Protocols in Protozoology, Society of Protozoologists, Allen Press,
Lawrence, KS.
McManus, G.B., Fuhrman, J.A., 1988. Control of marine bacterioplankton populations: Measurement and significance of grazing. Hydrobiologia 159, 51–62.
Middelboe, M., Jorgensen, N.O.G., Kroer, N., 1996. Effects of viruses on nutrient turnover and growth efficiency of noninfected marine bacterioplankton. Appl. Environ. Microbiol. 62, 1991–1997.
Moebus, K., 1983. Lytic and inhibition responses to bacteriophages among marine bacteria, with special reference to the origin of phage–host systems. Helgolander Meeresunters. 36, 375–391.
Pace, M.L., 1988. Bacterial mortality and the fate of bacterial production. Hydrobiologia 159, 41–49. Pace, M.L., McManus, G.B., Findlay, S.E.G., 1990. Planktonic community structure determines the fate of
bacterial production in a temperate lake. Limnol. Oceanogr. 35, 795–808.
Paul, J.H., Jeffrey, W.H., DeFlaun, M.F., 1987. Dynamics of extracellular DNA in the marine environment. Appl. Environ. Microbiol. 53, 170–179.
Porter, K.G., Feig, Y.S., 1980. The use of DAPI for identifying and counting aquatic microflora. Limnol. Oceanogr. 25, 943–948.
Reisser, W., Vietze, S., 1993. Soluble DNA in freshwater: The role of algal viruses. In: Guerrero, R.,
´ ´
Pedros-Alio, C. (Eds.), Trends in Microbial Ecology, Spanish Society for Microbiology, Barcelona, pp. 308–310.
Servais, P., Billen, G., Rego, J.V., 1985. Rate of bacterial mortality in aquatic environments. Appl. Environ. Microbiol. 49, 1448–1454.
Sherr, B.F., Sherr, E.B., Fallon, R.D., 1987. Use of monodispersed, fluorescently labelled bacteria to estimate in situ protozoan bacterivory. Appl. Environ. Microbiol. 53, 958–965.
Sherr, B.F., Sherr, E.B., Rassoulzadegan, F., 1988. Rates of digestion of bacteria by marine phagotrophic protozoa: Temperature dependence. Appl. Environ. Microbiol. 54, 1091–1095.
´ ´
Sherr, B.F., Sherr, E.B., Pedros-Alio, C., 1989. Simultaneous measurement of bacterioplankton production and protozoan bacterivory in estuarine water. Mar. Ecol. Prog. Ser. 54, 209–219.
Simek, K., Chrzanowski, T.H., 1992. Direct and indirect evidence of size-selective grazing on pelagic bacteria by freshwater nanoflagellates. Appl. Environ. Microbiol. 58, 3715–3720.
Steward, G.F., Smith, D.C., Azam, F., 1996. Abundance and production of bacteria and viruses in the Bering and Chukchi Seas. Mar. Ecol. Prog. Ser. 131, 287–300.
Strom, S.L., Postel, J.R., Booth, B.C., 1993. Abundance, variability, and potential grazing impact of planktonic ciliates in the open subarctic Pacific Ocean. Prog. Oceanog. 32, 185–203.
¨
Turk, V., Rehnstam, A.-S., Lundberg, E., Hagstrom, A., 1992. Release of bacterial DNA by marine nanoflagellates, an intermediate step in phosphorus regeneration. Appl. Environ. Microbiol. 58, 3744–3750. Weinbauer, M.G., Suttle, C.A., 1996. Potential significance of lysogeny to bacteriophage production and bacterial mortality in coastal waters of the Gulf of Mexico. Appl. Environ. Microbiol. 62, 4374–4380. Weinbauer, M.G., Fuks, D., Peduzzi, P., 1993. Distribution of viruses and dissolved DNA along a coastal
trophic gradient in the northern Adriatic Sea. Appl. Environ. Microbiol. 59, 4074–4082.
Weisse, T., 1989. The microbial loop in the Red Sea: Dynamics of pelagic bacteria and heterotrophic nanoflagellates. Mar. Ecol. Prog. Ser. 55, 241–250.
West, P.A., Brayton, P.R., Bryant, T.N., Colwell, R.R., 1986. Numerical taxonomy of Vibrios isolated from aquatic environments. Int. J. Syst. Bacteriol. 36, 531–543.
Wiggins, B.A., Alexander, M., 1985. Minimum bacterial density for bacteriophages replication: Implications for significance of bacteriophages in natural ecosystems. Appl. Environ. Microbiol. 49, 19–23.
¨