24
1.
Mengenal beberapa tanamn yang digunakan sebagai antidiabetika [home page
on the internet]. c2005 [cited 17 Februari 2012]. Available from :
http://www.pom.go.id/public/berita_aktual/detail.asp?id=74&qs_menuid=2
2.
Health research agenda for the 21
stCentury: Country Perspectives-Indonesia
[home page on the internet]. c2005 [cited 17 Februari 2012 ]. Available from
: http://www.whosea.org/researchpolicy/54ACHR.htm.diakses 2 Juli 2005
3.
Galicia E.H., Contreras A.A., Santamaria L.A., Miranda A.A.C., Vega
L.M.G., Saenz J.L.F, et al. studies on Hypoglycemic Activity of Mexican
Medical Plants. In: Proc. West. Pharmacol. Soc 45, 2002; p. 118-24
4.
Muhlisah F. Tanaman Obat Keluarga. Jakarta: PT. Penebar Swadaya; 2001
5.
Santosa M.H dan Zaini N.C. Prospek Tantangan Penelitian, dan
Pengembangan Tanaman Obat Untuk Terapi Diabetes. Surakarta; 2002
6.
Suyono S. Patofisiologi Diabetes Melitus, dalam Penatalaksanaan Diabetes
Mellitus Terpadu. Surakarta; 1999
7.
Sepuluh Makanan yang berpengaruh terhadap glukosa darah. [home page on
the internet]. Available from:
http://sumberdaya.web.id/2011/10-makanan-yang-menurunkan-gula-darah/
8.
Kurniati S. Pemikiran praktis pengelolaan diabetes mellitus tipe 2 dalam
praktek sehari-hari. Majalah kedokteran Atmajaya. Edisi 3, 2004; p. 29-35
9.
Khasiat Buah Alpukat [home page on internet].c2009 [updated 29 Desember
2009: cited 17 Februari 2012]. Available from:
http://www.google.co.id/khasiat-buah-alpukat.html
10.
Gula Darah [home page on internet]. c2008 [cited 17 Februari 2012].
Available from URL : www.wikipedia.org
11.
Slamet Suyono. Diabetes Mellitus di Indonesia. In: Ilmu Penyakit Dalam.
Jakarta : Pusat Penerbitan Ilmu Penyakit Dalam FKUI, 2006; p.1852-53
12.
Sinha R, Fisco G, Teague B, Tamborlane WV, Banyas B, et al. Prevalence of
Impaired Glucose Tolerance Among Children and Adolescents with Mark
Obesity. N Engl J Med. 2002; p. 802-10
13.
Tjokorda Gede Dalem Pemayun. Kontroversi dalam Penanganan Diabetes
Melitus Ditinjau dari Berbagai Aspek Penyakit Dalam. Semarang: Badan
Penerbit UNDIP (PERKENI) : 2007; p. 37 – 49
14.
Mayes PA. Glikoneogenesis dan Pengontrolan Kadar Glukosa Darah. In:
Murray RK, Granner DK, Mayes PA, Rodwell VW. Biokimia Harper.
Jakarta: EGC, 2003; p. 201
15.
WHO. Prevention of Diabetes Mellitus Technical Report Series 844. Geneva
: 1994
16.
ALPUKAT Persea americana P. Mill. « BIOLOGI ONLINE [home page on
internet]. c2009 [cited 17 Februari 2012]. Available from:
http://www.google.co.id/zaifbio.wordpress.com/2009/02/10/alpukat-persea-amxericana-p-mill/
17.
Tumbuhan Alpukat [home page on internet]. c2003 [cited 17 Februari 2012].
Available from:
http://www/google.co.id/repository.usu.ac.id/bitstream/123456789/21018/
18.
Dahlan S. Seri statistik: statistika untuk kedokteran dan kesehatan uji
Lampiran I
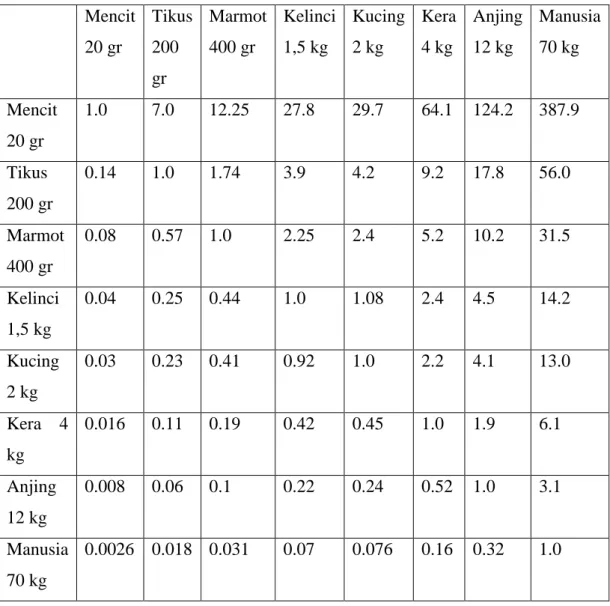
TABEL KONVERSI PERHITUNGAN DOSIS
(LAURENCE & BACHARACH, 1964)
Mencit
20 gr
Tikus
200
gr
Marmot
400 gr
Kelinci
1,5 kg
Kucing
2 kg
Kera
4 kg
Anjing
12 kg
Manusia
70 kg
Mencit
20 gr
1.0
7.0
12.25
27.8
29.7
64.1 124.2
387.9
Tikus
200 gr
0.14
1.0
1.74
3.9
4.2
9.2
17.8
56.0
Marmot
400 gr
0.08
0.57
1.0
2.25
2.4
5.2
10.2
31.5
Kelinci
1,5 kg
0.04
0.25
0.44
1.0
1.08
2.4
4.5
14.2
Kucing
2 kg
0.03
0.23
0.41
0.92
1.0
2.2
4.1
13.0
Kera 4
kg
0.016
0.11
0.19
0.42
0.45
1.0
1.9
6.1
Anjing
12 kg
0.008
0.06
0.1
0.22
0.24
0.52 1.0
3.1
Manusia
70 kg
0.0026 0.018 0.031
0.07
0.076
0.16 0.32
1.0
Lampiran II
DOSIS KONVERSI
1.
Ekstrak buah alpukat
(Persea americana)
Dihitung
dengan
menggunakan
rumus
berdasarkan
konversi
perhitungan dosis antara jenis hewan (LAURENCE & BACHARACH, 1964)
1.
Konversi dosis manusia (70 kg) ke tikus (200 gram ) = 0,018
2.
Dosis buah alpukat pada manusia (70 kg) = 500 gram
3.
Dosis buah alpukat-tikus (200 gram) = 70/70 x 0,018 x 500
= 9 gram / 200grBB
4.
Kemudian diturunkan dan dinaikan sesuai deret ukur menjadi :
1.
9 gr / 2 = 4,5 gram / 200grBB
2.
9 gr x 2 = 18 gram / 200grBB
2. Dosis Glukosa yang dipakai
Dihitung dengan menggunakan rumus berdasarkan konversi perhitungan
dosis antara jenis hewan (LAURENCE & BACHARACH, 1964).
1.
Konversi dosis manusia (70 kg) ke tikus (200 gram) = 0,018
2.
Dosis glukosa pada manusia = 75 gram
3.
Dosis glukosa manusia-tikus (200 gram) = 0,018 x 75
3.
Dosis Glibenklamid
Dihitung dengan menggunakan rumus berdasarkan konversi perhitungan
dosis antara jenis hewan (LAURENCE & BACHARACH, 1964)
1.
Konversi dosis manusia (70 kg) ke tikus (200 gram) = 0,018
2.
Dosis glibenklamid pada manusia (70 kg) = 5 gram
3.
Dosis glibenklamid manusia-tikus (200 gram) = 70/70 x 0,018 x 5
= 0,09gram/200grBB
Explore
Kelompok
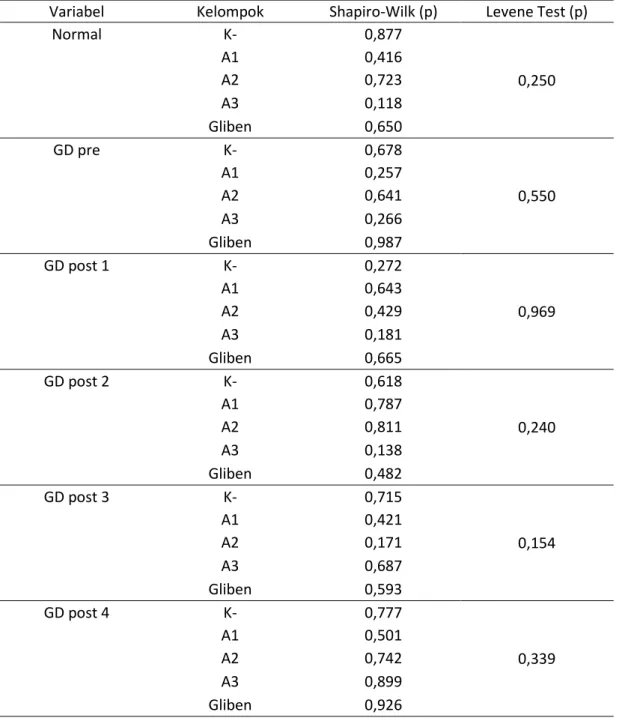
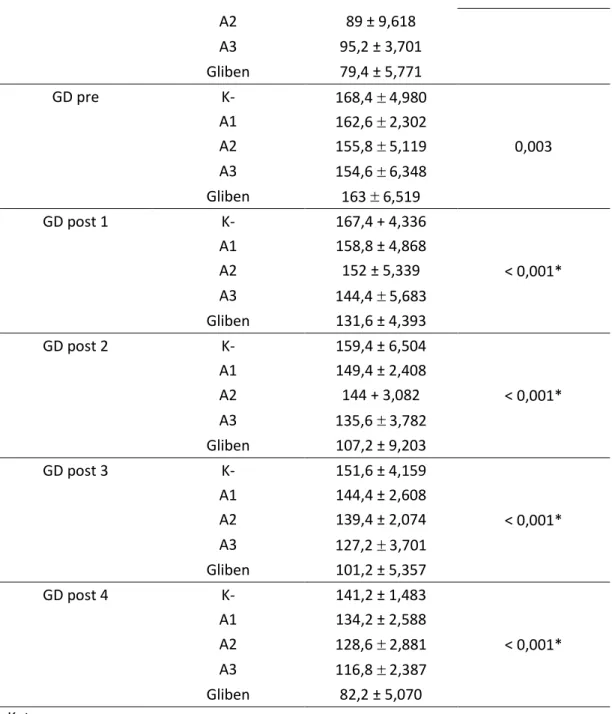
Case Summaries 5 5 5 5 5 5 83.00 168.40 167.40 159.40 151.60 141.20 9.874 4.980 4.336 6.504 4.159 1.483 86.00 167.00 169.00 159.00 152.00 141.00 69 163 163 150 147 139 95 175 173 166 157 143 5 5 5 5 5 5 86.00 162.60 158.80 149.40 144.40 134.20 11.424 2.302 4.868 2.408 2.608 2.588 81.00 162.00 158.00 150.00 144.00 135.00 75 160 152 146 142 131 104 165 164 152 148 137 5 5 5 5 5 5 89.00 155.80 152.00 144.00 139.40 128.60 9.618 5.119 5.339 3.082 2.074 2.881 91.00 155.00 153.00 145.00 140.00 128.00 74 150 146 140 136 125 100 162 158 148 141 132 5 5 5 5 5 5 95.20 154.60 144.40 135.60 127.20 116.80 3.701 6.348 5.683 3.782 3.701 2.387 96.00 154.00 143.00 135.00 126.00 117.00 89 149 139 132 123 114 98 165 154 142 132 120 5 5 5 5 5 5 79.40 163.00 131.60 107.20 101.20 82.20 5.771 6.519 4.393 9.203 5.357 5.070 77.00 163.00 132.00 105.00 100.00 82.00 73 155 127 97 94 75 88 172 138 122 107 89 25 25 25 25 25 25 86.52 160.88 150.84 139.12 132.76 120.60 9.562 7.079 13.297 18.805 18.360 21.415 87.00 162.00 153.00 145.00 140.00 128.00 69 149 127 97 94 75 104 175 173 166 157 143 N Mean Std. Deviation Median Minimum Maximum N Mean Std. Deviation Median Minimum Maximum N Mean Std. Deviation Median Minimum Maximum N Mean Std. Deviation Median Minimum Maximum N Mean Std. Deviation Median Minimum Maximum N Mean Std. Deviation Median Minimum Maximum Kelompok K-A1 A2 A3 Gliben TotalTe sts of Normality .219 5 .200* .970 5 .877 .269 5 .200* .901 5 .416 .218 5 .200* .948 5 .723 .278 5 .200* .821 5 .118 .261 5 .200* .938 5 .650 .211 5 .200* .942 5 .678 .251 5 .200* .868 5 .257 .194 5 .200* .936 5 .641 .275 5 .200* .870 5 .266 .130 5 .200* .992 5 .987 .245 5 .200* .871 5 .272 .206 5 .200* .937 5 .643 .226 5 .200* .903 5 .429 .328 5 .084 .846 5 .181 .194 5 .200* .940 5 .665 .205 5 .200* .933 5 .618 .198 5 .200* .957 5 .787 .227 5 .200* .960 5 .811 .363 5 .030 .829 5 .138 .265 5 .200* .912 5 .482 .207 5 .200* .947 5 .715 .221 5 .200* .902 5 .421 .224 5 .200* .842 5 .171 .227 5 .200* .943 5 .687 .215 5 .200* .929 5 .593 .246 5 .200* .956 5 .777 .221 5 .200* .915 5 .501 .198 5 .200* .951 5 .742 .175 5 .200* .974 5 .899 .206 5 .200* .978 5 .926 Kelompok K-A1 A2 A3 Gliben K-A1 A2 A3 Gliben K-A1 A2 A3 Gliben K-A1 A2 A3 Gliben K-A1 A2 A3 Gliben K-A1 A2 A3 Gliben Normal GD pre GD post 1 GD post 2 GD post 3 GD post 4
Statistic df Sig. Statistic df Sig.
Kolmogorov-Smirnova Shapiro-Wilk
This is a lower bound of the true significance. *.
Lilliefors Significance Correction a.
Te st of Homoge neity of Variance 1.465 4 20 .250 .609 4 20 .661 .609 4 14.069 .663 1.403 4 20 .269 .782 4 20 .550 .642 4 20 .639 .642 4 15.017 .641 .762 4 20 .562 .132 4 20 .969 .082 4 20 .987 .082 4 16.273 .987 .123 4 20 .973 1.499 4 20 .240 1.054 4 20 .405 1.054 4 9.142 .432 1.474 4 20 .247 1.877 4 20 .154 1.024 4 20 .419 1.024 4 14.589 .428 1.929 4 20 .145 1.205 4 20 .339 .979 4 20 .441 .979 4 10.161 .461 1.209 4 20 .338 Based on Mean Based on Median Based on Median and with adjusted df
Based on trimmed mean Based on Mean
Based on Median Based on Median and with adjusted df
Based on trimmed mean Based on Mean
Based on Median Based on Median and with adjusted df
Based on trimmed mean Based on Mean
Based on Median Based on Median and with adjusted df
Based on trimmed mean Based on Mean
Based on Median Based on Median and with adjusted df
Based on trimmed mean Based on Mean
Based on Median Based on Median and with adjusted df
Based on trimmed mean Normal GD pre GD post 1 GD post 2 GD post 3 GD post 4 Levene Statistic df1 df2 Sig.
Normal
GD post 2
Oneway
Post Hoc Tests
ANOVA
Normal
724.240
4
181.060
2.463
.078
1470.000
20
73.500
2194.240
24
Between Groups
Within Groups
Total
Sum of
Squares
df
Mean Square
F
Sig.
Multiple Comparisons
Dependent Variable: Normal Tukey HSD -3.000 5.422 .980 -19.23 13.23 -6.000 5.422 .801 -22.23 10.23 -12.200 5.422 .202 -28.43 4.03 3.600 5.422 .962 -12.63 19.83 3.000 5.422 .980 -13.23 19.23 -3.000 5.422 .980 -19.23 13.23 -9.200 5.422 .458 -25.43 7.03 6.600 5.422 .742 -9.63 22.83 6.000 5.422 .801 -10.23 22.23 3.000 5.422 .980 -13.23 19.23 -6.200 5.422 .782 -22.43 10.03 9.600 5.422 .417 -6.63 25.83 12.200 5.422 .202 -4.03 28.43 9.200 5.422 .458 -7.03 25.43 6.200 5.422 .782 -10.03 22.43 15.800 5.422 .059 -.43 32.03 -3.600 5.422 .962 -19.83 12.63 -6.600 5.422 .742 -22.83 9.63 -9.600 5.422 .417 -25.83 6.63 -15.800 5.422 .059 -32.03 .43 (J) Kelompok A1 A2 A3 Gliben K-A2 A3 Gliben K-A1 A3 Gliben K-A1 A2 Gliben K-A1 A2 A3 (I) Kelompok K-A1 A2 A3 Gliben Mean Difference
(I-J) Std. Error Sig. Lower Bound Upper Bound 95% Confidence Interval
Homogeneous Subsets
Normal
Tukey HSD
a5
79.40
5
83.00
5
86.00
5
89.00
5
95.20
.059
Kelompok
Gliben
K-A1
A2
A3
Sig.
N
1
Subset
for alpha
= .05
Means for groups in homogeneous subsets are displayed.
Uses Harmonic Mean Sample Size = 5.000.
Oneway
Post Hoc Tests
ANOVA
GD pre
646.240
4
161.560
5.807
.003
556.400
20
27.820
1202.640
24
Between Groups
Within Groups
Total
Sum of
Squares
df
Mean Square
F
Sig.
Multiple Comparisons
Dependent Variable: GD pre Tukey HSD 5.800 3.336 .434 -4.18 15.78 12.600* 3.336 .009 2.62 22.58 13.800* 3.336 .004 3.82 23.78 5.400 3.336 .503 -4.58 15.38 -5.800 3.336 .434 -15.78 4.18 6.800 3.336 .285 -3.18 16.78 8.000 3.336 .157 -1.98 17.98 -.400 3.336 1.000 -10.38 9.58 -12.600* 3.336 .009 -22.58 -2.62 -6.800 3.336 .285 -16.78 3.18 1.200 3.336 .996 -8.78 11.18 -7.200 3.336 .235 -17.18 2.78 -13.800* 3.336 .004 -23.78 -3.82 -8.000 3.336 .157 -17.98 1.98 -1.200 3.336 .996 -11.18 8.78 -8.400 3.336 .126 -18.38 1.58 -5.400 3.336 .503 -15.38 4.58 .400 3.336 1.000 -9.58 10.38 7.200 3.336 .235 -2.78 17.18 8.400 3.336 .126 -1.58 18.38 (J) Kelompok A1 A2 A3 Gliben K-A2 A3 Gliben K-A1 A3 Gliben K-A1 A2 Gliben K-A1 A2 A3 (I) Kelompok K-A1 A2 A3 Gliben Mean Difference
(I-J) Std. Error Sig. Lower Bound Upper Bound 95% Confidence Interval
The mean difference is significant at the .05 level. *.
Homogeneous Subsets
GD pre
Tukey HSD
a5
154.60
5
155.80
5
162.60
162.60
5
163.00
163.00
5
168.40
.126
.434
Kelompok
A3
A2
A1
Gliben
K-Sig.
N
1
2
Subset for alpha = .05
Means for groups in homogeneous subsets are displayed.
Uses Harmonic Mean Sample Size = 5.000.
Oneway
Post Hoc Tests
ANOVA
GD post 1
3752.960
4
938.240
38.264
.000
490.400
20
24.520
4243.360
24
Between Groups
Within Groups
Total
Sum of
Squares
df
Mean Square
F
Sig.
Multiple Comparisons
Dependent Variable: GD post 1 Tukey HSD 8.600 3.132 .082 -.77 17.97 15.400* 3.132 .001 6.03 24.77 23.000* 3.132 .000 13.63 32.37 35.800* 3.132 .000 26.43 45.17 -8.600 3.132 .082 -17.97 .77 6.800 3.132 .231 -2.57 16.17 14.400* 3.132 .001 5.03 23.77 27.200* 3.132 .000 17.83 36.57 -15.400* 3.132 .001 -24.77 -6.03 -6.800 3.132 .231 -16.17 2.57 7.600 3.132 .149 -1.77 16.97 20.400* 3.132 .000 11.03 29.77 -23.000* 3.132 .000 -32.37 -13.63 -14.400* 3.132 .001 -23.77 -5.03 -7.600 3.132 .149 -16.97 1.77 12.800* 3.132 .005 3.43 22.17 -35.800* 3.132 .000 -45.17 -26.43 -27.200* 3.132 .000 -36.57 -17.83 -20.400* 3.132 .000 -29.77 -11.03 -12.800* 3.132 .005 -22.17 -3.43 (J) Kelompok A1 A2 A3 Gliben K-A2 A3 Gliben K-A1 A3 Gliben K-A1 A2 Gliben K-A1 A2 A3 (I) Kelompok K-A1 A2 A3 Gliben Mean Difference
(I-J) Std. Error Sig. Lower Bound Upper Bound 95% Confidence Interval
The mean difference is significant at the .05 level. *.
Homogeneous Subsets
GD post 1
Tukey HSD
a5
131.60
5
144.40
5
152.00
152.00
5
158.80
158.80
5
167.40
1.000
.149
.231
.082
Kelompok
Gliben
A3
A2
A1
K-Sig.
N
1
2
3
4
Subset for alpha = .05
Means for groups in homogeneous subsets are displayed.
Uses Harmonic Mean Sample Size = 5.000.
Oneway
Post Hoc Tests
ANOVA
GD post 2
7860.240
4
1965.060
62.741
.000
626.400
20
31.320
8486.640
24
Between Groups
Within Groups
Total
Sum of
Squares
df
Mean Square
F
Sig.
Multiple Comparisons
Dependent Variable: GD post 2 Tukey HSD 10.000 3.539 .070 -.59 20.59 15.400* 3.539 .003 4.81 25.99 23.800* 3.539 .000 13.21 34.39 52.200* 3.539 .000 41.61 62.79 -10.000 3.539 .070 -20.59 .59 5.400 3.539 .559 -5.19 15.99 13.800* 3.539 .007 3.21 24.39 42.200* 3.539 .000 31.61 52.79 -15.400* 3.539 .003 -25.99 -4.81 -5.400 3.539 .559 -15.99 5.19 8.400 3.539 .164 -2.19 18.99 36.800* 3.539 .000 26.21 47.39 -23.800* 3.539 .000 -34.39 -13.21 -13.800* 3.539 .007 -24.39 -3.21 -8.400 3.539 .164 -18.99 2.19 28.400* 3.539 .000 17.81 38.99 -52.200* 3.539 .000 -62.79 -41.61 -42.200* 3.539 .000 -52.79 -31.61 -36.800* 3.539 .000 -47.39 -26.21 -28.400* 3.539 .000 -38.99 -17.81 (J) Kelompok A1 A2 A3 Gliben K-A2 A3 Gliben K-A1 A3 Gliben K-A1 A2 Gliben K-A1 A2 A3 (I) Kelompok K-A1 A2 A3 Gliben Mean Difference
(I-J) Std. Error Sig. Lower Bound Upper Bound 95% Confidence Interval
The mean difference is significant at the .05 level. *.
Homogeneous Subsets
GD post 2
Tukey HSD
a5
107.20
5
135.60
5
144.00
144.00
5
149.40
149.40
5
159.40
1.000
.164
.559
.070
Kelompok
Gliben
A3
A2
A1
K-Sig.
N
1
2
3
4
Subset for alpha = .05
Means for groups in homogeneous subsets are displayed.
Uses Harmonic Mean Sample Size = 5.000.
Oneway
Post Hoc Tests
ANOVA
GD post 3
7807.360
4
1951.840
137.842
.000
283.200
20
14.160
8090.560
24
Between Groups
Within Groups
Total
Sum of
Squares
df
Mean Square
F
Sig.
Multiple Comparisons
Dependent Variable: GD post 3 Tukey HSD 7.200* 2.380 .047 .08 14.32 12.200* 2.380 .000 5.08 19.32 24.400* 2.380 .000 17.28 31.52 50.400* 2.380 .000 43.28 57.52 -7.200* 2.380 .047 -14.32 -.08 5.000 2.380 .258 -2.12 12.12 17.200* 2.380 .000 10.08 24.32 43.200* 2.380 .000 36.08 50.32 -12.200* 2.380 .000 -19.32 -5.08 -5.000 2.380 .258 -12.12 2.12 12.200* 2.380 .000 5.08 19.32 38.200* 2.380 .000 31.08 45.32 -24.400* 2.380 .000 -31.52 -17.28 -17.200* 2.380 .000 -24.32 -10.08 -12.200* 2.380 .000 -19.32 -5.08 26.000* 2.380 .000 18.88 33.12 -50.400* 2.380 .000 -57.52 -43.28 -43.200* 2.380 .000 -50.32 -36.08 -38.200* 2.380 .000 -45.32 -31.08 -26.000* 2.380 .000 -33.12 -18.88 (J) Kelompok A1 A2 A3 Gliben K-A2 A3 Gliben K-A1 A3 Gliben K-A1 A2 Gliben K-A1 A2 A3 (I) Kelompok K-A1 A2 A3 Gliben Mean Difference
(I-J) Std. Error Sig. Lower Bound Upper Bound 95% Confidence Interval
The mean difference is significant at the .05 level. *.
Homogeneous Subsets
GD post 3
Tukey HSD
a5
101.20
5
127.20
5
139.40
5
144.40
5
151.60
1.000
1.000
.258
1.000
Kelompok
Gliben
A3
A2
A1
K-Sig.
N
1
2
3
4
Subset for alpha = .05
Means for groups in homogeneous subsets are displayed.
Uses Harmonic Mean Sample Size = 5.000.
Oneway
Post Hoc Tests
ANOVA
GD post 4
10811.600
4
2702.900
278.076
.000
194.400
20
9.720
11006.000
24
Between Groups
Within Groups
Total
Sum of
Squares
df
Mean Square
F
Sig.
Multiple Comparisons
Dependent Variable: GD post 4 Tukey HSD 7.000* 1.972 .015 1.10 12.90 12.600* 1.972 .000 6.70 18.50 24.400* 1.972 .000 18.50 30.30 59.000* 1.972 .000 53.10 64.90 -7.000* 1.972 .015 -12.90 -1.10 5.600 1.972 .068 -.30 11.50 17.400* 1.972 .000 11.50 23.30 52.000* 1.972 .000 46.10 57.90 -12.600* 1.972 .000 -18.50 -6.70 -5.600 1.972 .068 -11.50 .30 11.800* 1.972 .000 5.90 17.70 46.400* 1.972 .000 40.50 52.30 -24.400* 1.972 .000 -30.30 -18.50 -17.400* 1.972 .000 -23.30 -11.50 -11.800* 1.972 .000 -17.70 -5.90 34.600* 1.972 .000 28.70 40.50 -59.000* 1.972 .000 -64.90 -53.10 -52.000* 1.972 .000 -57.90 -46.10 -46.400* 1.972 .000 -52.30 -40.50 -34.600* 1.972 .000 -40.50 -28.70 (J) Kelompok A1 A2 A3 Gliben K-A2 A3 Gliben K-A1 A3 Gliben K-A1 A2 Gliben K-A1 A2 A3 (I) Kelompok K-A1 A2 A3 Gliben Mean Difference
(I-J) Std. Error Sig. Lower Bound Upper Bound 95% Confidence Interval
The mean difference is significant at the .05 level. *.