i
TUGAS AKHIR
–
MO141326
ANALISA
PENGAMBILAN
KEPUTUSAN
DALAM
PEMILIHAN ALTERNATIF DRE (
DISMANTLEMENT, REPAIR
AND ENGINEERING
) PADA PEMBONGKARAN ANJUNGAN
LEPAS PANTAI
Tommy Saputra
NRP. 4313 100 148
Dosen Pembimbing:
Prof. Ir. Daniel M. Rosyid, Ph.D
Ir. Murdjito, M.Sc.Eng
Departemen Teknik Kelautan
Fakultas Teknologi Kelautan
Institut Teknologi Sepuluh Nopember
Surabaya
ii
FINAL PROJECT
–
MO141326
DECISION
MAKING
ANALYSIS
IN
ALTERNATIVE
SELECTION
OF
DISMANTLEMENT,
REPAIR
AND
ENGINEERING
(DRE)
ON
OFFSHORE
PLATFORM
DECOMMISSIONING
Tommy Saputra
NRP. 4313 100 148
Supervisor:
Prof. Ir. Daniel M. Rosyid, Ph.D
Ir. Murdjito, M.Sc.Eng
Ocean Engineering Department
Faculty of Marine Technology
Institut Teknologi Sepuluh Nopember
Surabaya
ii Tugas Akhir ini dipersembahkan untuk
keluarga tercinta. “Papa, Mama, Ipan, Rafa
Abang lulus !!!”
“Karena sesungguhnya sesudah kesulitan itu ada kemudahan. Sesungguhnya sesudah kesulitan itu ada kemudahan”
iii
Analisa Pengambilan Keputusan dalam Pemilihan Alternatif DRE
(Dismantlement, Repair and Engineering) pada Pembongkaran Anjungan
Lepas Pantai
Nama : Tommy Saputra
NRP : 4313100148
Departemen : Teknik Kelautan FTK-ITS
Dosen Pembimbing : 1. Prof. Ir. Daniel M. Rosyid, Ph.D
2. Ir. Murdjito, M.Sc.Eng
ABSTRAK
Struktur anjungan minyak dan gas lepas pantai memiliki masa operasi dalam setiap desainnya. Saat masa operasi ini berakhir, maka setiap struktur anjungan akan memasuki fase pascaproduksi, yakni pembongkaran (decommissioning) instalasi struktur anjungan. Terdapat beberapa alternatif DRE (Dismantlement, Repair dan Engineering) pada pembongkaran anjungan minyak dan gas lepas pantai diantaranya total removal, partial removal dan leave in place. Dalam memilih alternatif DRE pada pembongkaran perlu diperhatikan kriteria yang harus dipertimbangkan sebelum melaksanakan pembongkaran anjungan antara lain lingkungan, biaya, dan alih fungsi serta keamanan dalam pembongkaran anjungan lepas pantai. Oleh karena itu, penting dilakukan analisa pengambilan keputusan yang akan dijadikan sebagai pertimbangan sebelum melaksanakan pembongkaran anjungan. Pada tugas akhir ini dilakukan analisa pengambilan keputusan dengan teknik kuantitatif dan kualitatif untuk pembongkaran anjungan minyak dan gas lepas pantai dengan metode AHP dan SAW. Dari hasil analisis didapatkan keputusan alternatif DRE pada pombongkaran fixed platform dengan metode AHP dan SAW adalah total removal dengan masing-masing bobot adalah 0,60 dan 0,93.
iv
Decision Making Analysis in Alternative Selection of Dismantlement,
Repair and Engineering (DRE) on Offshore Platform Decommissioning
Name : Tommy Saputra
NRP : 4313100148
Departement : Ocean Engineering, FTK-ITS
Supervisor : 1. Prof. Ir. Daniel M. Rosyid, Ph.D
2. Ir. Murdjito, M.Sc
ABSTRACT
The structure of offshore platform has a lifetime of operation in each of its designs. When this operation end, the structure of the platform will enter the post-production phase, that is decommissioning the installation of the platform structure. There are several dismantlement, repair and engineering (DRE) alternative on decommissioning of offshore platfrom including total removal, partial removal and leave in place. In choosing DRE alternative on decommissioning, it is necessary to consider the criteria that must be considered before carrying out the decommissioning of the platform, such as environment, cost, conversion and sefety. Therefore, it is important to make decision analysis that will be taken into consideration before undertaking the decommissioning of offshore platform. In this bachelor thesis, a decision making analysis with quantitative and qualitative techniques is used to select DRE alternatives on offshore platform decommissioning with AHP and SAW methods. From the analysis result obtained the DRE alternative decision on fixed platform decommissioning with AHP and SAW method is total removal with each weight is 0.60 and 0.93.
Keywords : Decommissioning, Total Removal, Partial Removal, Leave in Place,
v
FOREWORD
Assalammualaikum Wr.W
This bachelor thesis entitled “Decision Making Analysis in Alternative Selection of Dismantlement, Repair and Engineering (DRE) on Offshore Platform Decommissioning” prepared to meet the requirements in completing the undergraduate program (S-1) at Ocean Engineering Department, Faculty of Marine Technology, Institut Teknologi Sepuluh Nopember, Surabaya. This bachelor thesis discusses the comparative analysis of decision making on the selection of DRE alternatives on offshore platform decommissioning by comparing the AHP and SAW methods.
The author realizes that this bachelor thesis is far from being perfect. Therefore, any constructive criticism and suggestion will be gladly accepted. Finally, author hope that this bachelor thesis will be beneficial for the readers.
Wassalammualaikum Wr. Wb.
Surabaya, July 2017
vi
ACKNOWLEDGMENTS
Alhamdulilah, praise be to Allah SWT the Almighty and the most Merciful. All praises are to Allah SWT for all the blesses so that the author can accomplish this bachelor thesis to attain the degree of Sarjana Teknik in Ocean Engineering, ITS. In addition, may peace and salutation be given to Prophet Muhammad SAW who has taken all human being from the darkness to the lightness.
The author would like to express his genuine gratitudes to:
1. I would like to dedicate this work to my beloved parents, Papa Edi Suhaimi and Mama Novita Yuhendra, my brothers Irfan and Rafa, who always believed in me, always were there and will always be whenever I do need them. I owe you everything.
2. My first supervisor, Prof. Ir. Daniel M. Rosyid, Ph.D and my second supervisor, Ir. Murdjito, M.Sc who were continuously supporting me in every problem that occurred during the writing of this bachelor thesis report, kind and patient in giving me advice and their valuable time. I especially thank them for their accurate comments which were of critical importance and their encouragment during this work. Our cooperation was truly an inspiring experience, I feel grateful.
3. My supervisor, Prof. Ir. Eko Budi Djatmiko M.Sc., Ph.D who have guide me during my college.
4. Management of Ocean Engineering Department who have supported in administration for this bachelor thesis.
5. My friends in G16 and Valtameri.
6. Those who cannot be mentioned one by one, who have helped and support the author to finish this thesis.
vii
CONTENTS
APPROVAL SHEET ... i
OFFERINGS SHEET ... ii
ABSTRACT ... iii
CHAPTER I INTRODUCTION ... 1
1.1Background ... 1
1.2Problem Formulation ... 4
1.3Objectives ... 4
1.4Benefits ... 4
1.5Assumptions... 4
1.6Systematics of Writing... 5
CHAPTER II LITERATURE REVIEW AND BASIC THEORY ... 7
2.1 Literature Review ... 7
2.2 Basic Theory ... 8
2.2.1 Offshore Structure ... 8
2.2.2 Decision Making Method ... 9
2.2.2.1 Simple Additive Weighting (SAW) Method ... 9
2.2.2.2 Analytical Hierarchy Process (AHP) Method ... 10
2.2.3 Decommissioning of Offshore Platform ... 13
2.2.3.1 Decommissioning Processes of Offshore Platform ... 14
2.2.3.2 Decommissioning Alternatives of Offshore Platform ... 15
2.2.3.3 Policies of Offshore Platform Decommissioning ... 16
2.2.3.4 Utilization of Offshore Platform Decommissioning ... 17
CHAPTER III RESEARCH METHODOLOGY ... 21
3.1 Research Flowchart ... 21
3.2 Research Steps ... 23
3.3 Method of Collecting Data ... 24
viii
3.3.2 Secondary Data ... 24
CHAPTER IV RESULT AND DISCUSSION ... 27
4.1 Analytical Hierarchy Process (AHP) Method ... 27
4.2 Simple Additive Weighting (SAW) Method ... 62
CHAPTER V CONCLUSION ... 79
5.1 Conclusions ... 79
5.2 Suggestions ... 79
ix
LIST OF FIGURES
Figure 1.1 Offshore Platform Deployment Map ... 2
Figure 1.2 Location of Attaka H Platform ... 3
Figure 1.3 Structure Modelling ... 3
Figure 2.1 Decommissioning Process ... 14
Figure 2.2 Decommissioning Process ... 15
Figure 2.3 Alternative Options ... 19
Figure 3.1 Research Flowchart ... 21
Figure 3.1a Research Flowchart (Advanced) ... 22
Figure 3.1b Research Flowchart (Advanced) ... 23
Figure 3.2 Attaka Platform ... 25
Figure 4.1 Hierarchical Structure Arrangement ... 27
Figure 4.2a Determining The Priority ... 29
Figure 4.2b Determining The Priority of Each Subcriteria ... 38
Figure 4.2c All Weight Evaluation ... 38
Figure 4.2d The Ranked Alternatives ... 39
Figure 4.3a Determining The Priority ... 40
Figure 4.3b Determining The Priority of Each Subcriteria ... 49
Figure 4.3c All Weight Evaluation ... 49
Figure 4.3d The Ranked Alternatives ... 50
Figure 4.4a Determining The Priority ... 51
Figure 4.4b Determining The Priority of Each Subcriteria ... 60
Figure 4.4c All Weight Evaluation ... 60
Figure 4.4d The Ranked Alternatives ... 61
Figure 4.5 The Ranked Alternatives by All Experts ... 62
Figure 4.6 The Grace Platform Location ... 64
Figure 4.7 The Ranked Alternatives ... 69
Figure 4.8 The Ranked Alternatives ... 73
Figure 4.9 The Ranked Alternatives ... 76
x
LIST OF TABLES
Table 2.1 Weighted Scale of Pairwise Comparison ... 11
Table 2.2 List of Random Consistency Index ... 13
Table 3.1 Data of Attaka Platform ... 25
Table 4.1a Comparison pairwise between Decision Maker ... 28
Table 4.1b Normalized Matrix ... 28
Table 4.1.1 Comparison Pairwise between Criteria ... 28
Table 4.1.2 Normalized Matrix ... 29
Table 4.1.3 Weighting of Environtmental Criteria ... 29
Table 4.1.4 Normalized Matrix ... 30
Table 4.1.5 Weighting of Cost Criteria ... 30
Table 4.1.6 Normalized Matrix ... 30
Table 4.1.7 Weighting of Conversion Criteria ... 30
Table 4.1.8 Normalized Matrix ... 31
Table 4.1.9 Weighting of Safety Criteria ... 31
Table 4.1.10 Normalized Matrix ... 31
Table 4.1.11 Weighting of Biomass Production Subcriteria ... 31
Table 4.1.12 Normalized Matrix ... 32
Table 4.1.13 Weighting of Coral Habitat Subcriteria ... 32
Table 4.1.14 Normalized Matrix ... 32
Table 4.1.15 Weighting of Biodiversity Enhancement Subcriteria ... 32
Table 4.1.16 Normalized Matrix ... 33
Table 4.1.17 Weighting of Predecommissioning Cost Subcriteria ... 33
Table 4.1.18 Normalized Matrix ... 33
Table 4.1.19 Weighting of Operational Cost Subcriteria ... 33
Table 4.1.20 Normalized Matrix ... 34
Table 4.1.21 Weighting of Recovery Area Cost Subcriteria... 34
Table 4.1.22 Normalized Matrix ... 34
Table 4.1.23 Weighting of Aquaculture Subcriteria ... 34
Table 4.1.24 Normalized Matrix ... 35
Table 4.1.25 Weighting of Tourism Potential Subcriteria ... 35
Table 4.1.26 Normalized Matrix ... 35
xi
Table 4.1.28 Normalized Matrix ... 36
Table 4.1.29 Weighting of Shipping Access Subcriteria ... 36
Table 4.1.30 Normalized Matrix ... 36
Table 4.1.31 Weighting of Work Safety Risks Subcriteria ... 36
Table 4.1.32 Normalized Matrix ... 37
Table 4.1.33 Weighting of Fishing Activities Subcriteria ... 37
Table 4.1.34 Normalized Matrix ... 37
Table 4.1.35 All Weight Evaluation... 37
Table 4.2.1 Comparison Pairwise between Criteria ... 39
Table 4.2.2 Normalized Matrix ... 40
Table 4.2.3 Weighting of Environtmental Criteria ... 40
Table 4.2.4 Normalized Matrix ... 41
Table 4.2.5 Weighting of Cost Criteria ... 41
Table 4.2.6 Normalized Matrix ... 41
Table 4.2.7 Weighting of Conversion Criteria ... 41
Table 4.2.8 Normalized Matrix ... 42
Table 4.2.9 Weighting of Safety Criteria ... 42
Table 4.2.10 Normalized Matrix ... 42
Table 4.2.11 Weighting of Biomass Production Subcriteria ... 42
Table 4.2.12 Normalized Matrix ... 43
Table 4.2.13 Weighting of Coral Habitat Subcriteria ... 43
Table 4.2.14 Normalized Matrix ... 43
Table 4.2.15 Weighting of Biodiversity Enhancement Subcriteria ... 43
Table 4.2.16 Normalized Matrix ... 44
Table 4.2.17 Weighting of Predecommissioning Cost Subcriteria ... 44
Table 4.2.18 Normalized Matrix ... 44
Table 4.2.19 Weighting of Operational Cost Subcriteria ... 44
Table 4.2.20 Normalized Matrix ... 45
Table 4.2.21 Weighting of Recovery Area Cost Subcriteria... 45
Table 4.2.22 Normalized Matrix ... 45
Table 4.2.23 Weighting of Aquaculture Subcriteria ... 45
Table 4.2.24 Normalized Matrix ... 46
Table 4.2.25 Weighting of Tourism Potential Subcriteria ... 46
xii
Table 4.2.27 Weighting of Renewable Energy Subcriteria ... 46
Table 4.2.28 Normalized Matrix ... 47
Table 4.2.29 Weighting of Shipping Access Subcriteria ... 47
Table 4.2.30 Normalized Matrix ... 47
Table 4.2.31 Weighting of Work Safety Risks Subcriteria ... 47
Table 4.2.32 Normalized Matrix ... 48
Table 4.2.33 Weighting of Fishing Activities Subcriteria ... 48
Table 4.2.34 Normalized Matrix ... 48
Table 4.2.35 All Weight Evaluation... 48
Table 4.3.1 Comparison Pairwise between Criteria ... 50
Table 4.3.2 Normalized Matrix ... 51
Table 4.3.3 Weighting of Environtmental Criteria ... 51
Table 4.3.4 Normalized Matrix ... 52
Table 4.3.5 Weighting of Cost Criteria ... 52
Table 4.3.6 Normalized Matrix ... 52
Table 4.3.7 Weighting of Conversion Criteria ... 52
Table 4.3.8 Normalized Matrix ... 53
Table 4.3.9 Weighting of Safety Criteria ... 53
Table 4.3.10 Normalized Matrix ... 53
Table 4.3.11 Weighting of Biomass Production Subcriteria ... 53
Table 4.3.12 Normalized Matrix ... 54
Table 4.3.13 Weighting of Coral Habitat Subcriteria ... 54
Table 4.3.14 Normalized Matrix ... 54
Table 4.3.15 Weighting of Biodiversity Enhancement Subcriteria ... 54
Table 4.3.16 Normalized Matrix ... 55
Table 4.3.17 Weighting of Predecommissioning Cost Subcriteria ... 55
Table 4.3.18 Normalized Matrix ... 55
Table 4.3.19 Weighting of Operational Cost Subcriteria ... 55
Table 4.3.20 Normalized Matrix ... 56
Table 4.3.21 Weighting of Recovery Area Cost Subcriteria... 56
Table 4.3.22 Normalized Matrix ... 56
Table 4.3.23 Weighting of Aquaculture Subcriteria ... 56
Table 4.3.24 Normalized Matrix ... 57
xiii
Table 4.3.26 Normalized Matrix ... 57
Table 4.3.27 Weighting of Renewable Energy Subcriteria ... 57
Table 4.3.28 Normalized Matrix ... 58
Table 4.3.29 Weighting of Shipping Access Subcriteria ... 58
Table 4.3.30 Normalized Matrix ... 58
Table 4.3.31 Weighting of Work Safety Risks Subcriteria ... 58
Table 4.3.32 Normalized Matrix ... 59
Table 4.3.33 Weighting of Fishing Activities Subcriteria ... 59
Table 4.3.34 Normalized Matrix ... 59
Table 4.3.35 All Weight Evaluation... 59
Table 4.4 The Ranked Alternatives ... 61
Table 4.5 The Ranked Alternatives by All Experts ... 62
Table 4.6 Decision Alternatives ... 63
Table 4.7 The Grace Platform Data ... 63
Table 4.8 Experts Assesment Result ... 64
Table 4.9 Ed-Well Platform Data ... 65
Table 4.10 Reserch Result ... 65
Table 4.11 Safety Considerations... 66
Table 4.12 Specifying The Weight Scale ... 66
Table 4.13a Weights of Criteria by Comparison Matrix ... 67
Table 4.13b The Weighted Criteria... 67
Table 4.13c Match Rating ... 68
Table 4.13d The Ranked Alternatives... 69
Table 4.14a Weights of Criteria by Comparison Matrix ... 70
Table 4.14b The Weighted Criteria... 70
Table 4.14c Match Rating ... 71
Table 4.14d The Ranked Alternatives... 72
Table 4.15a Weights of Criteria by Comparison Matrix ... 74
Table 4.15b The Weighted Criteria... 74
Table 4.15c Match Rating ... 74
Table 4.15d The Ranked Alternatives... 75
xiv
LIST OF APPENDICES
APPENDIX A HIERARCHY STRUCTURE APPENDIX B EXPERTS DATA
1 CHAPTER I
INTRODUCTION
1.1Background
Oil and gas are human needs that have been exploited for a long time in order to meet the energy source for life activities. Initially oil and gas exploration and exploitation only took place on land. Along with the development of knowledge and technology, the business of oil and gas utilization has entered deep sea waters. To utilize the hydrocarbons contained in the seafloor is required an oil and gas platform which is a structure with technology capable of exploration and exploitation activities with all conditions that exist in offshore. Surely this structure will require high technology and expensive investment cost with high risk and various technical difficulties. However, as oil and gas prices increase, the use of this technology is more economical to be utilized.
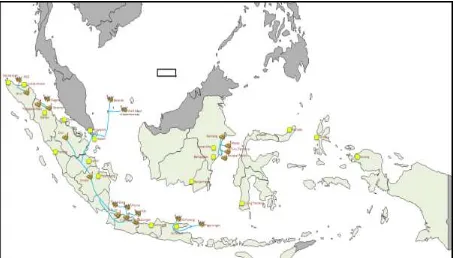
Oil and gas platform technology has long been used in the energy industry. This technology was first used in 1891 in Ohio, USA. Indonesia has begun using the first offshore platform technology operated by PN PERTAMINA-IIAPCO in October 1970 which was inaugurated by President Soeharto at Cinta's production field, north coast of Java. Since that time oil and gas platforms are used in various regions of Indonesia including Natuna, East Kalimantan and North East Sumatra also Java Sea.Currently the platforms have reached the end of the service, so in 2017 will soon begin the decommissoning of the platform.
2
Figure 1.1 Offshore Platform Deployment Map in Indonesia (Source : SKK Migas, 2016)
In many countries, the issue of dismantling offshore platforms cause problems between communities, environmental activists, as well as the companies that operate the rig. To overcome this, Indonesia has had regulations regulating technical guidelines for the dismantling of offshore oil and gas platforms that is minister regulation of ESDM No. 01/2011. Decision making analysis in alternative selection of fixed platform’s dismantlement, repair and engineering (DRE) used as a tool for decision makers in the selection process of DRE’s alternative quickly and appropriately, and able to provide more objective recommendations on DRE of platforms.
3
The structure that used as the object of this bachelor thesis is Attaka H platform which is located off the coast of Makassar Strait. The platform owned by Chevron Indonesia Company was installed in October 1972 with depth of 198 ft.
Figure 1.2 Location of Attaka Platform (Source : Google Earth Pro)
4
1.2Problem Formulation
The problems to be studied in this bachelor thesis are:
1. What is the result of the decision in the alternative selection of dismantlement, repair, and engineering (DRE) on decommissioning of fixed platform with Analitycal Hierarchy Process (AHP) method ?
2. What is the result of the decision in the alternative selection of dismantlement, repair, and engineering (DRE) on decommissioning of fixed platform with Simple Additive Weighting (SAW) method ?
1.3Objectives
Objectives to be achieved by the author are as follows:
1. Determine the decision result in dismantlement, repair, and engineering (DRE) alternative selection on decommissioning of fixed platform with Analitycal Hierarchy Process (AHP) method
2. Determine the decision result in dismantlement, repair, and engineering (DRE) alternative selection on decommissioning of fixed platform with Simple Additive Weighting (SAW) method
1.4Benefits
The expected benefits of this bachelor thesis are to be used as a consideration for the analysis of decommissioning for relevant stakeholders such as the Ministry of Energy and Mineral Resources, Ministry of Marine Affairs and Fisheries, PT Chevron Indonesia and PT Pertamina as state-owned energy company as well or other parties. Decision making analysis of quantitative and qualitative in this bachelor thesis to determine the decision in determining the DRE of offshore fixed platform installation.
1.5Assumptions
To clarify the problem of this thesis, it is necessary to have the scope of testing or assumptions as follows:
a. This bachelor thesis only used AHP and SAW method in analyzing decision making. b. Decommissioning project is assumed to be done without a hitch.
c. Alternative decision of decommissioning only considered from predetermined criteria.
d. Decision making based on oil and gas expert’s perspective from operators.
5
Permen ESDM No. 35/2006, article 17 and 18, and PM Perhubungan No. 129/2016 article 70 also IMO Guidelines 1989 (Removal of Offshore Installations and Structures on the Continental Shelf and in the EEZ).
1.6Systematics of Writing
Systematics of writing used in this bachelor thesis report consists of five chapters are as follows:
CHAPTER I PREFACE. Explaining several things about the research in the bachelor thesis, which is underlying problem of research on decision analysis of decommissioning platforms so it is important to do, the formulation of the problems that become the problems and needs to be answered, the purpose used to answer the problems raised, benefits gained from the research of bachelor thesis, and scope of problems, also an explanation of the reporting system used in the bachelor thesis.
CHAPTER II LITERATURE REVIEW AND BASIC THEORY. Explaining what is the references of this bachelor thesis and the basics of theory, equations, and code used in this thesis. The theories listed in this chapter include: a general description of the structure of platform, the decommissioning of platforms, the techniques and methods of quantitative and qualitative decision making.
CHAPTER III RESEARCH METHODOLOGY. Explaining the sequence of analysis performed to solve the problem in this bachelor thesis.
CHAPTER IV RESULT AND DISCUSSION. Describing the application of decision making methods that have been done in this thesis and discusses the results that have been obtained. CHAPTER V CONCLUSION. Explaining the conclusions that have been obtained from the analysis on this thesis and the author's suggestions as a consideration in the purposes of further research.
6
7 CHAPTER II
LITERATURE REVIEW AND BASIC THEORY
2.1 Literature Review
The decision making technique using the Fuzzy Multiple Attribute Decision Making (FMADM) method is a decision selection method by determining the most optimal alternative choice of selected alternatives with predetermined criteria. Simple Additive Weighting (SAW) is one of the commonly used methods in the case of FMADM. This method of research ever conducted by Heri Sulistiyo on “Sistem Pendukung Keputusan Untuk Menentukan Penerima Beasiswa di SMAN 6 Pandeglang”. Decision making technique with FMADM method is a quantitative and qualitative decision making technique that can be applied to complex problems in daily life.
Fuzzy technique can be used in many problems, both in industry and in the formal field. The research of Muhammad Eka Putra Galus has done research on “Analisa Penggunaan Metode AHP dan Fuzzy AHP pada Perankingan Siswa” with case study of SMK N 1 Batam.
Reason used Fuzzy (Kusumadewi, 2010 on Nabila Khalida Sukandar, 2014) are:
1. Fuzzy logic concept is easy to understand because Fuzzy logic uses the basic set theory, then the mathematical concepts based on Fuzzy reasoning are fairly easy to understand. 2. Fuzzy logic is very flexible, able to adapt to the changes and uncertainties that
accompanied the problem.
3. Fuzzy logic has a tolerance to incorrect data. If given a group of fairly homogeneous data, and then there are some "exclusive" data, then Fuzzy logic has the ability to handle such exclusive data.
4. Fuzzy logic is capable of modeling very complex nonlinear functions.
5. Fuzzy logic can build and apply the experiences of experts directly without having to go through the training process. In this case, often known as Fuzzy Expert System which becomes the most important part.
6. Fuzzy logic can work in conjunction with conventional control techniques. This generally occurs in the field of mechanical engineering as well as electrical engineering. 7. Fuzzy logic is based on natural language. Fuzzy logic uses daily language so it is easy
8
The analysis using AHP method was done in the field of engineering and maritime management ever done by K.L Na et al in a journal entitled “An Expert Knowledge Based Decommissioning Alternative Selection System for Fixed Oil and Gas Assets in The South China Sea”.
Analysis of decision making in choosing the method of platform decommissioning has been done by Ocean Engineering student Rizqi August who researched “Analisis Pembongkaran Platform Pertamina ED-WELL Tripod Berbasis Biaya, Waktu dan Trade-Off
Analisis”. The study used trade-off analysis technique to determine decommissioning method to be selected with cost and time criteria so that the best decision was made using partial removal method.
2.2 Basic Theory
2.2.1 Offshore Structure
An offshore platform is an offshore constructed structure to support the exploration or exploitation of oil and gas. Usually the offshore platform has a drilling rig that serves to analyze the reservoir's geological properties as well as to create a hole that allows the removal of petroleum or natural gas reserves from the reservoir. This offshore structure does not have direct access to land, can be fixed in the seafloor and required to survive in all weather conditions.
Some concepts of offshore structures are (Ainnillah, 2017): a. Fixed Offshore Structure
In fixed construction, vertical, horizontal and moment loads can be transformed by the foundation construction to the seafloor. This type is the oldest and most built. One disadvantage is that production and installation costs of steel structures will rise exponentially to depth. An example is the jack up platform.
b. Floating Offshore Structure
This type has a character moves to follow the wave motion. Often this platform is connected to the seabed using mechanical equipment mooring line or dynamic positioning. For this type of platform, the most important is the mobility and its ability to anticipate the movement due to waves and currents.
c. Compliant Structure
9 2.2.2.Decision Making Method
Any decisions taken in a defined environment contain two elements, namely act and outcome. Actions are often called variable (free) decisions, while the results are called variable (not free) consequences. The decision maker chooses the action so that the result is the best. If the alternatives of action are available, then it becomes a matter of selection problem between those choices of actions that produce the best results (Rosyid, 2009).
The decision making process according to Simon's model [2] can be divided into four phases are (Dwi Citra Hartini et al, 2015):
a. Intelligence Phase
Decision makers perform the identification process on all scope of issues to be solved. At this stage the decision maker must understand the reality and define the problem by testing the data obtained.
b. Design Phase
Modeled a defined problem by deciphering a decision element first, an alternative decision variable, evaluation criteria selected. The model is then validated based on the criteria set for evaluating the alternative decision to be selected. Determination of solutions is the process of designing and developing alternative decisions, determining the number of actions taken, and assigning the weight given to each alternative. c. Choice Phase
The stage of selection of the solution produced by the model. When the solution is acceptable in this last phase, then proceed with the implementation of decision solutions in real world.
d. Implementation of Solution
Essentially the implementation of a proposed solution to a problem is the initiation of new things or the introduction of change that must be managed. User expectations should be managed as part of change management.
2.2.2.1. Simple Additive Weighting (SAW) Method
10
is Simple Additive Weighting (SAW) method. This method is commonly known as the weighted summing method.
In this research, SAW method is chosen because this method determines the weight of each attribute, then done by ranking to find the best DRE alternative on decommissioning from several alternatives, so it is expected that the assessment will be more accurate because it is based on the weight of the criteria that have been determined.
The basic concept of the SAW method is to find a weighted sum of performance ratings on each alternative on all attributes. The SAW method requires the process of normalizing the decision matrix (X) to a scale comparable to all existing alternative ratings.
𝑟𝑖𝑗 =
𝑖 = the biggest weight of each criteria 𝑀𝑖𝑛 𝑥𝑖𝑗
𝑖 = the smallest weight of each criteria benefit = if the biggest weights are the best cost = if the smallest weights are the best
𝑟𝑖𝑗 is the normalized performance rating of the Ai alternatives in the Cj; i=1,2...,m attribute
and j=1,2,...,n. Weight preference for each alternative (Ai) given by:
𝐴𝑖 = ∑𝑛𝑗=1𝑤𝑗𝑟𝑖𝑗 (2.2)
where:
Ai = the rank for each alternative Wj = the weight of each criteria
rij = the weighted normalized performance rating
The largest weight of Vi indicates that Ai's alternatives are preferred.
2.2.2.2. Analitycal Hierarchy Process (AHP) Method
11
most important thing of this method is the functional hierarchy with the main input of human perception. This decision making method is effective to simplify and accelerate complex decision-making processes by solving the problem into sections, organizing sections or variables in a hierarchical order, assigning numerical weights to subjective considerations of the importance of each variable and synthesizing these considerations for defining variables Which has the highest priority and acts to influence the outcome of the situation.
2.2.2.2.1. Basic Principles of AHP
In solving the problem with AHP there are several principles that must be understood (Sudaryono, 2010), including:
1 Create a hierarchy
Complex systems can be understood by breaking them into supporting elements, arranging elements hierarchically and combining them.
2 Weighing criteria and alternative
Criteria and alternative are done by pairwise comparisons. According to Saaty (1988), for variety of issues of scale 1 to 9 is the best scale for expressing opinions. The weight and definition of qualitative opinion from the comparison scale of Saaty can be measured by analytical tables such as table 2.1.
Table 2.1 Weighted Scale of Pairwise Comparison Intensity of
Interest
Definition
1 Equal Importance
3 Moderate Importance
5 Strong Importance
7 Very strong Imporatnce
9 Extreme Importance
2,4,6,8 Weight between two adjacent weights
This research uses validity test by conducting expert judgment in the form of questionnaire. The expert in this case is someone who is an expert in a certain field / someone who knows about the issues to be studied.
3 Set priorities
12
generate weight and priority. Weights and priorities are calculated by manipulating the matrix or by solving the mathematical equations
4 Logical Consistency
Consistency has two meanings. First, similar objects can be grouped according to uniformity and relevance. Second, it concerns the degree of relationship between objects based on certain criteria.
Basically the procedure in the AHP method (Sudaryono, 2010), includes:
1. Identify the problem and determine the desired solution, then compile the hierarchy of problems encountered
2. Determining the priority of the elements
The first step in determining the priority of the elements is to make a pair comparison, ie comparing the elements in pairs according to given criteria. A pairwise comparison matrix is filled with numbers to represent the relative importance of an element against the other elements.
3.Measuring consistency
In making decisions, it is important to know how well consistency is done because we do not want decisions based on consideration with low consistency. Things done in this step:
• Multiply each weight in the first column with the relative priority of the first element, the weight in the second column with the relative priority of the second element and so on.
• Add each line
• The result of the sum of rows divided by the relevant relative priority element
• Sum it up with the number of elements that exist, the result is called χ max 4. Calculating the consistency index (CI) with the formula:
CI = 𝜆 𝑀𝑎𝑥−𝑛
𝑛 (2.3)
where,
n = the number of elements
5. Calculating the consistency ratio (CR) with the formula: CR = 𝐶𝐼
𝑅𝐼 (2.4)
13
than or equal to 10%, then the calculation result can be stated correctly. List of random consistency indexes such as table 2.2.
Table 2.2 List of Random Consistency Index Matrix Size Random Index (RI)
1,2 0
3 0,58
4 0,9
5 1,12
6 1,24
7 1,32
8 1,41
9 1,45
10 1,49
11 1,51
12 1,48
13 1,56
14 1,56
15 1,59
7. Priority setting in each hierarchy 8. Priority synthesis
9. Decision making
2.2.3.Decommissioning of Offshore Platform
Decommissioning is a process whereby the oil and gas operators and offshore pipelines that planned, obtained approval for and carry out the dismantling, disposal or reuse of such installations when they are no longer required for the present purpose (Offshore Technology Report, BOMEL Ltd, 2001).
14
2.2.3.1. Decommissioning Processes and Steps of Offshore Platform
In carrying out the decommissioning of offshore platforms, there are several processes to be implemented, including:
a. Project management b. Engineering and planning c. Fulfillment of licenses and rules
d. Preparation of platform and blockage wells e. Rules of conductor
f. Mobilization and demobilization of barge g. Release of platform
h. Pipeline dan cable dismantling i. Material disposal and site cleaning
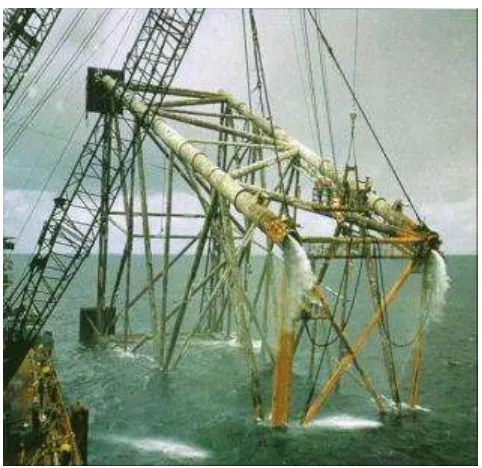
The general process of decommissioning is as follows (Murdjito, 2015): 1. Installation of lifting aids and ready to cut
2. 50 % pre tension on slings and cutting 3. Lifting and moving
4. Laying down the top side to designated on barge 5. Rigging the lifting aids on the jacket
6. Cutting the jacket & conductor at sea bed 7. Lifting the jacket
8. Laying down the jacket to designated on barge 9. Split the jacket (2 part)
10. Sea fastening 11. Sea transportation
15 Figure 2.2 Decommissioning Process
2.2.3.2. Decommissioning Alternatives of Offshore Platform
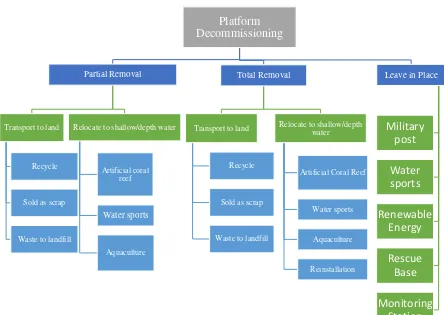
Generally there are 3 DRE alternatives on decommissioning of offshore platforms. Alternative selection is taken after various considerations and impacts on the environment caused by the selection of alternatives used that can be applied on decommissioning of a platform (August W.R, 2017), namely:
a. Complete Removal Decommissioning
This alternative is an alternative to the discharge of a whole platform, all components of the platform being dismantled and transported using Heavy Lift Vessel (HLV) and barge to the land. In this process platform is cut into 2 parts, top side and jacket. The top side can be used again while the jacket will be cut into scrap. In the work done by cutting the connection between jacket and topside, then jacket will cut 5 ft from above seabed using ROV.
b. Partial Removal Decommissioning
This alternative is an alternative to dismantling the platform by removing a portion of the platform and leaving the rest where the platform operates. This method is done by separating the topside and jacket, topside will be taken to the mainland while the jacket will be left in place. In partial removal, the abandoned jacket has several options, ie jackets cut according to regulation and used as coral reef habitats, reused as jackets for renewable energy generation (wind, current and wave).
c. Leave In Place Decommissioning
16
method is commonly used for platforms located at a depth of more than 400 ft and is not on the shipping line.
2.2.3.3. Policies of Offshore Platform Decommissioning
2.2.3.3.1. National Policies
• Ministry of Energy and Mineral Resources regulation No. 11/2011 (Technical Guidelines for Offshore Oil and Gas Installation)
Article 1 Paragraph 3
Decommissioning is the work of partial or complete cutting of the installation and removal / transport of the decommissioning results to a designated location.
Article 2
Decommissioning of offshore installation is done in case the offshore installation is no longer used or will be reused for oil and gas exploration and / or exploitation activities elsewhere.
Article 3
The regulation of technical guidelines for the dismantling of offshore installations aims to ensure the safety of oil and gas and the implementation of environmental management, to maintain the condition of offshore installations as state property and shipping safety, and to optimize the use of state property.
Article 5
Implementation of offshore installation disposal as referred to in Article 4 shall be conducted by the Contractor in accordance with the laws and regulations.
Article 12 (1) The obligations of contractors, among others:
a) cut the conductors for 5 (five) meters below the mud line (mud line) or parallel to the seabed in terms of the distance between the sludge (mud line) and the seabed is less than five (5) meters;
b) cut the conductor cut segments along a maximum of twelve (12) meters; c) dismantle the installation on the surface (top side facility) by cutting the
welded joints between piles with deck feet;
d) cut the pile and the holder for 5 (five) meters below the mud line (mud line) or parallel to the seabed in terms of the distance between the sludge (mud line) and the seabed is less than five (5) meters;
e) bypass the conduit above the riser bend point and at a distance of three (3) meters from the base of the foot installation;
f) clog the abandoned pipelines and buried deep ends one (1) meter or protected by a safety material;
g) cut the pipeline that will be moved, into small sections along the 9 (nine) meters up to twelve (12) meters.
• Government regulation No. 35/2004 article 78 paragraph 1 and PSC (Production Sharing Contract) agreement 1976-1988.
17
• Ministry of Transportation regulation No. 129/2016 Article 70
(1) Building permits and / or installations in the waters shall be granted to the owner in accordance with the period of utilization
(2) Building permits and / or installations in waters that have expired the term of utilization and will be reused, may be renewed upon approval of the Director General
• Ministry of Energy and Mineral Resources regulation No. 35/2006, article 17 and 18 Minister of Energy and Mineral Resources may propose the removal of operating goods (including offshore oil platforms) to be utilized, transferred or destroyed with the approval of the Minister of Finance. In order to utilize oil and gas platforms, other functions must be carried out in full research, whether related to technical issues, standard rules, environments, and applicable legislation.
2.2.3.3.2. International Policies
• IMO Guidelines 1989 (Removal of Offshore Installations and Structures on the Continental Shelf and in the EEZ)
The main points in the IMO Guidelines are:
a) The general principle is that all disused installation “are required to be removed”;
b) Installation in water depths of less than 75 metres, or 100 metres after 1 January 1998, and weighing less than 4000 tonnes should be removed unless:
• not technically feasible
• involving extreme cost; or
• constituting unacceptable risk to personnel or the marine environment; c) An unobstructed water column of 55 metres must be left in the event of a partial
removal;
d) All installation after 1 January 1998 are to be designed and built so that their entire removal is feasible.
Existing installation in water depths of greater than 75 metres (or 100 metres if installed after 1 January 1998) or weighing more than 4000 tonnes can be wholly or partially left in place, provided it is shown that they do not cause unjustifiable interference with other users of sea. However, there is no exception to complete removal where the installation os structure is located in approaches to ports, or in straits used for international navigation, in customary deep draught lanes and IMO adopted routing systems.
2.2.3.4. Utilization Alternatives of Offshore Platform Decommissioning
18
a. Artificial Coral & Aquaculture
The program of utilization of post-production offshore oil and gas platforms for marine habitat is also known as "rig to reef". There are several references to the implementation of the rig to reef program in Indonesia (Murdjito, 2015), including:
• United States of America
This program has been done for a long time in America, especially in the Gulf of Mexico and Louisiana. This oil production platform is also called the largest complex of artificial reefs in the world. Since 2000, 151 platforms have been converted to permanent coral reefs. There are 90 platforms transported to the new location and 61 platform left in place.
• Brunei
Brunei has had a rig to reef program policy since 1998. The Shell Brunei Petroleum offshore operator has transported a number of old platforms and jackets to two areas designed for artificial reef locations far from the shipping line.
b. The location of sports and water tours
Utilization of post production oil and gas platform structure for reuse has been successfully done in East Coast of Sabah, Malaysia. Currently underwater adventure tour around Sipadan island, has been known by divers around the world.
c. Military post
Malaysia will implement the utilization of a modified post-production platform for its defense post in Bintulu. It is planned that the platform will be used for helicopter landing base, handling drones, and stations for Malaysian special task force.
d. Renewable energy
In theory the platforms that is no longer operating can still be utilized to produce renewable energy coming from wind, current, and geothermal (Murdjito, 2015). e. Monitoring station and marine research
f. Rescue Base
19
20
21 CHAPTER III
RESEARCH METHODOLOGY
3.1Research Flowchart
The explanation of this bachelor thesis can be seen in Figure 3.1:
Figure 3.1 Research Flowchart of Bachelor Thesis Decision
Finish Start
Literature Review
Collecting Primary and Secondary Data
Development Study of Decommissioning Alternatives:
1. Qualitative Criteria 2. Quantitative Criteria
Analysis with SAW Method
Analysis with AHP Method
Complete Removal Partial Removal Leave in Place
Decision
Discussion
22
Furthermore, for each method described by the advanced flowchart, Figure 3.1a describes the analysis with the AHP method and Figure 3.1b describes the analysis by the SAW method.
Figure 3.1a Research Flowchart of Bachelor Thesis (Advanced) Calculate the Weights
Ranking
Finish
Problem Identification and Determine the Solution
Selection Criteria
Formulating Problem in the Structure of Hierarchy
Forming a Pairwise Comparison Matrices
Consistency Test CR ≤ 0,1
23 Figure 3.1b Research Flowchart of Bachelor Thesis (Advanced)
3.2Research Steps
Based on the research flowchart, the research procedures and research steps in achieving the purpose of this bachelor thesis is described as follows:
1. Literature Review
The study of literature as reference materials and the sources of theories required in the completion of this thesis are obtained from various sources, among others the collection of books, magazines, journals in ITS library and FTK reading room and internet access also module/note during lectures at Ocean Engineering Department, ITS.
2. Collecting Data
The data required are primary data taken from questionnaires to oil and gas experts in Indonesia and secondary data in the form of platform structure and environmental data.
3. Development Study of Alternatives
Explain the alternatives of DRE undertaken in the decommissioning as well as the advantages and disadvantages of each alternative.
4. Method Analysis
Give Alternative Weights to Each Criteria
Give Weights (W)
Normalization Matrix
The DRE Alternative Ranking of Platform Decommissioning
24
Explain the application of quantitative and qualitative decision making techniques used in this bachelor thesis by using AHP and SAW methods.
5. Decision Making
From the application of decision making techniques obtained the best decision based on predetermined criteria of each method.
6. Result and Conclusion
The results and conclusions of this research are the best decision alternative to determine DRE of decommissioning using AHP and SAW method.
3.3Method of Collecting Data
a. Primary Data
Represents the data obtained directly from the object under study. In this thesis the primary data collection method was obtained by using questionnaires with AHP and SAW methods. The questionnaire contains a list of written questions that have been prepared previously based on literature studies and submitted to respondents who come from a specified professional oil and gas operators. The design of the questionnaire in this research is in the appendices.
b. Secondary Data
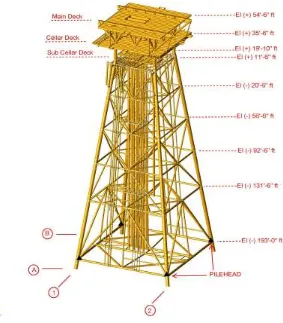
25 Table 3.1 Data of Attaka H Platform
Platform Name Attaka H
Location Makassar Strait, East Kalimantan
0º 09’ 44,901’’ S 117 º 38’ 54,482’’ E
Operator Chevron Indonesia Company
Installation Time Oktober 1972
Dimensional Work Area 40” x 40” (Unmanned)
Number of Leg 4
Jacket Support Main Deck, Cellar Deck, Sub Cellar Deck, Boat Landing
(1), Barge Bumper (2), Riser (11), Conductor (8)
Depth 198 ft (60,4 m)
Wave Height 16,3 ft (100 th)
Wave Period 8,1 s (100 th)
Average of Surface
Temperature
30 º C
Ph 7,51
Total Weight 5,495.335 kips
Number of Deck 3
Number of Well 8
Number of Pile 4
26
27 CHAPTER IV
RESULT AND DISCUSSION
The analysis conducted in this bachelor thesis is the selection of DRE alternatives on the decommissioning of offshore oil and gas platforms using Analytical Hierarchy Process (AHP) and Simple Additive Weighting (SAW) methods.
4.1Analytical Hierarchy Process (AHP) Method
The steps of the AHP method that is done in the DRE alternative selection of platform decommissioning are as follows:
a. Arrange the Hierarchy
Arrangement of hierarchical structure of problems with the first level is the purpose of the problem of determining DRE alternative of decommissioning Attaka H Platform owned by Chevron Indonesia Company in Makassar Strait, the second level is criteria considered; environment (C1), cost (C2),conversion (C3), security and safety (C4), and the last level is the DRE alternative; total removal (A1), partial removal (A2), and leave in place (A3). The hierarchical structure of this problem can be seen in the Figure 4.1 at appendix A.
b. Weighting for Pairwise Comparison
If the hierarchy has been properly composed, then weighted on each hierarchy based on its relative importance level. In this thesis, the comparison is done at level 2 (between criteria), level 3 (between subcriteria) and level 4 (between alternatives). Weighting at level 4 (between alternatives), is intended to compare the weight of choice based on each criterioa. The result of weighting is the weight which is the character of each alternative. While weighting at level 2 (criteria), intended to compare the weight of each criteria in order to achieve the goal so obtained weighting from the importance of each criteria to achieve the established goal of determining the DRE alternative of Attaka platform decommissioning. The weighting procedure of pairwise comparisons in AHP refers to the weighting developed by Thomas L Saaty as in the Table 2.1.
28
Data collection at this thesis is done by using questioner, for multiple comparison done by using matrix differentiation questioner.
c. Consistency Test
Each pairwise comparison element will be tested for consistency in weighting in order to do the next step. Each stage can be continued if the weighting done is consistent. Respondent assessments as follows:
Table 4.1a Comparison Pairwise between Decision Maker
Table 4.1b Normalized Matrix
1) Respondent 1
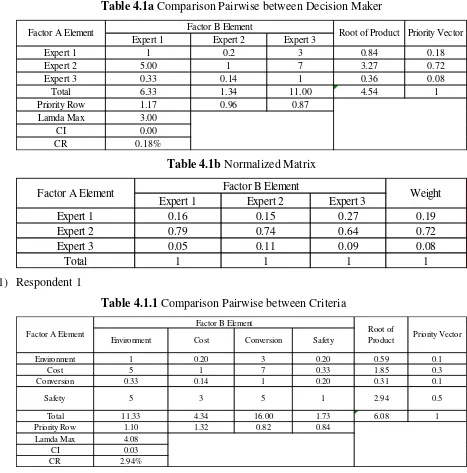
Table 4.1.1 Comparison Pairwise between Criteria Expert 1 Expert 2 Expert 3
Expert 1 1 0.2 3 0.84 0.18 Expert 2 5.00 1 7 3.27 0.72 Expert 3 0.33 0.14 1 0.36 0.08 Total 6.33 1.34 11.00 4.54 1 Priority Row 1.17 0.96 0.87
Lamda Max 3.00 CI 0.00 CR 0.18%
Factor A Element Factor B Element Root of Product Priority Vector
Expert 1 Expert 2 Expert 3
Expert 1 0.16 0.15 0.27 0.19
Expert 2 0.79 0.74 0.64 0.72
Expert 3 0.05 0.11 0.09 0.08
Total 1 1 1 1
Factor A Element Factor B Element Weight
Environment Cost Conversion Safety
Environment 1 0.20 3 0.20 0.59 0.1
Cost 5 1 7 0.33 1.85 0.3
Conversion 0.33 0.14 1 0.20 0.31 0.1
Safety 5 3 5 1 2.94 0.5
Total 11.33 4.34 16.00 1.73 6.08 1
Priority Row 1.10 1.32 0.82 0.84
29 Table 4.1.2 Normalized Matrix
Based on the Table 4.1.1 obtained weighting data based on the first expert thought in determining the priority. In this case the expert selects from 4 criteria. From the above data obtained CR is 2.94%, because CR <10% then the decision is consistent.
Figure 4.2a Determining The Priority of Criteria
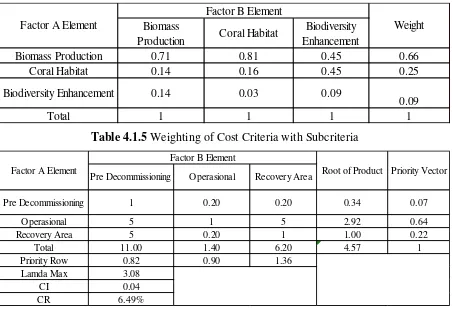
Table 4.1.3 Weighting of Environtmental Criteria with Subcriteria
Based on data CR is 6.49%, because CR < 10% then the decision is consistent. Environment Cost Conversion Safety
Environment 0.09 0.05 0.19 0.12 0.109 Cost 0.44 0.23 0.44 0.19 0.325 Conversion 0.03 0.03 0.06 0.12 0.060
Safety 0.44 0.69 0.31 0.58 0.505
Total 1 1 1 1 1
Factor A Element
Factor B Element
Weight
Biomass Production Coral Habitat Biodiversity Increasing
Biomass Production 1 5 5 2.92 0.64 Coral Habitat 0.20 1 5 1.00 0.22
Biodiversity Increasing 0.20 0.20 1 0.34 0.07
Total 1.40 6.20 11.00 4.57 1 Priority Row 0.90 1.36 0.82
Lamda Max 3.08 CI 0.04 CR 6.49%
Root of Product Priority Vector Factor A Element
30
Table 4.1.4 Normalized Matrix
Table 4.1.5 Weighting of Cost Criteria with Subcriteria
Based on data CR is 6.49%, because CR < 10% then the decision is consistent.
Table 4.1.6 Normalized Matrix
Table 4.1.7 Weighting of Conversion Criteria with Subcriteria
Based on data CR is 6.49%, because CR < 10% then the decision is consistent. Biomass
Production Coral Habitat
Biodiversity Enhancement
Biomass Production 0.71 0.81 0.45 0.66
Coral Habitat 0.14 0.16 0.45 0.25
Biodiversity Enhancement 0.14 0.03 0.09
0.09
Total 1 1 1 1
Factor A Element
Factor B Element
Weight
Pre Decommissioning Operasional Recovery Area
Pre Decommissioning 1 0.20 0.20 0.34 0.07
Operasional 5 1 5 2.92 0.64 Recovery Area 5 0.20 1 1.00 0.22 Total 11.00 1.40 6.20 4.57 1 Priority Row 0.82 0.90 1.36
Lamda Max 3.08 CI 0.04 CR 6.49%
Root of Product Priority Vector Factor A Element
Factor B Element
Pre
Decommissioning Operasional Recovery Area
Pre Decommissioning 0.09 0.14 0.03 0.09
Operasional 0.45 0.71 0.81 0.66
Recovery Area 0.45 0.14 0.16 0.25
Total 1 1 1 1
Factor A Element
Factor B Element
Weight
Aquaculture Tourism Potential Renewable Energy
Aquaculture 1 5 0.20 1 0.22 Tourism Potential 0.20 1 0.20 0.34 0.07 Renewable Energy 5 5 1 2.92 0.64
Total 6.20 11.00 1.40 4.57 Priority Row 1.36 0.82 0.90
Lamda Max 3.08 CI 0.04 CR 6.49% Factor A Element
Factor B Element
31 Table 4.1.8 Normalized Matrix
Table 4.1.9 Weighting of Safety Criteria with Subcriteria
Based on data CR is 6.49%, because CR < 10% then the decision is consistent.
Table 4.1.10 Normalized Matrix
Table 4.1.11Weighting of Biomass Production Subcriteria with Alternatives
Based on data CR is 6.49%, because CR < 10% then the decision is consistent. Aquaculture Tourism Potential Renewable
Energy
Aquaculture 0.16 0.45 0.14 0.25
Tourism Potential 0.03 0.09 0.14 0.09
Shipping Access Fishing Activities Risk of Work Safety
Shipping Access 1 5 0.20 1 0.22 Fishing Activities 0.20 1 0.20 0.34 0.07 Risk of Work Safety 5 5 1 2.92 0.64
Total 6.2 11 1.4 4.57 Priority Row 1.36 0.82 0.90
Lamda Max 3.08 CI 0.04 CR 6.49% Factor A Element
Factor B Element
Root of Product Priority Vector
Shipping Access Fishing Activities Risk of Work Safety
Shipping Access 0.16 0.45 0.14 0.25
Fishing Activities 0.03 0.09 0.14 0.09
Risk of Work Safety 0.81 0.45 0.71 0.66
Total 1 1 1 1
Factor B Element
Weight Factor A Element
Total Removal Partial Removal Leave in Place
Total Removal 1 0.20 5 1 0.22 Partial Removal 5 1 5 2.92 0.64 Leave in Place 0.20 0.20 1 0.34 0.07
Total 6.20 1.40 11.00 4.57 Priority Row 1.36 0.90 0.82
Lamda Max 3.08 CI 0.04 CR 6.49%
32
Table 4.1.12 Normalized Matrix
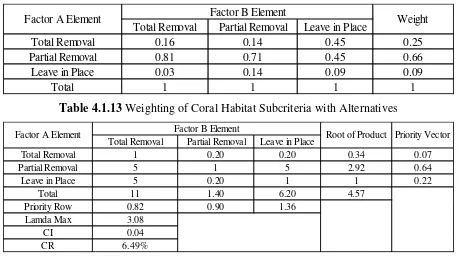
Table 4.1.13 Weighting of Coral Habitat Subcriteria with Alternatives
Based on data CR is 6.49%, because CR < 10% then the decision is consistent.
Table 4.1.14 Normalized Matrix
Table 4.1.15 Weighting of Biodiversity Enhancement Subcriteria with Alternatives
Based on data CR is 6.49%, because CR < 10% then the decision is consistent. Total Removal Partial Removal Leave in Place
Total Removal 0.16 0.14 0.45 0.25
Partial Removal 0.81 0.71 0.45 0.66
Leave in Place 0.03 0.14 0.09 0.09
Total 1 1 1 1
Factor A Element Factor B Element Weight
Total Removal Partial Removal Leave in Place
Total Removal 1 0.20 0.20 0.34 0.07 Partial Removal 5 1 5 2.92 0.64 Leave in Place 5 0.20 1 1 0.22
Total 11 1.40 6.20 4.57 Priority Row 0.82 0.90 1.36
Lamda Max 3.08 CI 0.04 CR 6.49%
Root of Product Priority Vector Factor A Element Factor B Element
Total Removal Partial Removal Leave in Place
Total Removal 0.09 0.14 0.03 0.09
Partial Removal 0.45 0.71 0.81 0.66
Leave in Place 0.45 0.14 0.16 0.25
Total 1 1 1 1
Factor A Element Factor B Element Weight
Total Removal Partial Removal Leave in Place
Total Removal 1 0.20 0.20 0.34 0.07 Partial Removal 5 1 5 2.92 0.64 Leave in Place 5 0.20 1 1 0.22
Total 11.0 1.4 6.2 4.57 Priority Row 0.82 0.90 1.36
Lamda Max 3.08 CI 0.04 CR 6.49%
33 Table 4.1.16 Normalized Matrix
Table 4.1.17 Weighting of Predecommissioning Cost Subcriteria with Alternatives
Based on data CR is 6.49%, because CR < 10% then the decision is consistent.
Table 4.1.18 Normalized Matrix
Table 4.1.19 Weighting of Operational Cost Subcriteria with Alternatives
Based on data CR is 6.49%, because CR < 10% then the decision is consistent. Total Removal Partial Removal Leave in Place
Total Removal 0.09 0.14 0.03 0.09
Partial Removal 0.45 0.71 0.81 0.66
Leave in Place 0.45 0.14 0.16 0.25
Total 1 1 1 1
Factor A Element Factor B Element Weight
Total Removal Partial Removal Leave in Place
Total Removal 1 0.20 0.20 0.34 0.07 Partial Removal 5 1 5 2.92 0.64 Leave in Place 5 0.20 1 1 0.22
Total 11.0 1.4 6.2 4.57 Priority Row 0.82 0.90 1.36
Lamda Max 3.08 CI 0.04 CR 6.49%
Root of Product Priority Vector Factor A Element Factor B Element
Total Removal Partial Removal Leave in Place
Total Removal 0.09 0.14 0.03 0.09
Partial Removal 0.45 0.71 0.81 0.66
Leave in Place 0.45 0.14 0.16 0.25
Total 1 1 1 1
Factor A Element Factor B Element Weight
Total Removal Partial Removal Leave in Place
Total Removal 1 0.20 0.20 0.34 0.07 Partial Removal 5 1 0.20 1 0.22 Leave in Place 5 5 1 2.92 0.64
Total 11.0 6.2 1.4 4.57 Priority Row 0.8 1.4 0.9
Lamda Max 3.1 CI 0.04 CR 6.49%
34
Table 4.1.20 Normalized Matrix
Table 4.1.21 Weighting of Recovery Area Cost with Alternatives
Based on data CR is 6.49%, because CR < 10% then the decision is consistent.
Table 4.1.22 Normalized Matrix
Table 4.1.23 Weighting of Aquaculture Subcriteria with Alternatives
Based on data CR is 6.49%, because CR < 10% then the decision is consistent. Total Removal Partial Removal Leave in Place
Total Removal 0.09 0.03 0.14 0.09
Partial Removal 0.45 0.16 0.14 0.25
Leave in Place 0.45 0.81 0.71 0.66
Total 1 1 1 1
Factor A Element Factor B Element Weight
Total Removal Partial Removal Leave in Place
Total Removal 1 0.20 0.20 0.34 0.07 Partial Removal 5 1 0.20 1 0.22 Leave in Place 5 5 1 2.92 0.64
Total 11.0 6.2 1.4 4.57 Priority Row 0.82 1.36 0.90
Lamda Max 3.08 CI 0.04 CR 6.49%
Priority Vector Root of Product
Factor A Element Factor B Element
Total Removal Partial Removal Leave in Place
Total Removal 0.09 0.03 0.14 0.09
Partial Removal 0.45 0.16 0.14 0.25
Leave in Place 0.45 0.81 0.71 0.66
Total 1 1 1 1
Factor A Element Factor B Element Weight
Total Removal Partial Removal Leave in Place
Total Removal 1 0.20 0.20 0.34 0.07 Partial Removal 5 1 0.20 1 0.22 Leave in Place 5 5 1 2.92 0.64
Total 11.0 6.2 1.4 4.57 Priority Row 0.82 1.36 0.90
Lamda Max 3.08 CI 0.04 CR 6.49%
35 Table 4.1.24 Normalized Matrix
Table 4.1.25 Weighting of Tourism Potential Subcriteria with Alternatives
Based on data CR is 6.49%, because CR < 10% then the decision is consistent.
Table 4.1.26 Normalized Matrix
Table 4.1.27 Weighting of Renewable Energy Subcriteria with Alternatives
Based on data CR is 2.29%, because CR < 10% then the decision is consistent. Total Removal Partial Removal Leave in Place
Total Removal 0.09 0.03 0.14 0.09
Partial Removal 0.45 0.16 0.14 0.25
Leave in Place 0.45 0.81 0.71 0.66
Total 1 1 1 1
Factor A Element Factor B Element Weight
Total Removal Partial Removal Leave in Place
Total Removal 1 0.20 0.20 0.34 0.07 Partial Removal 5 1 5 2.92 0.64 Leave in Place 5 0.20 1 1 0.22
Total 11.0 1.4 6.2 4.57 Priority Row 0.8 0.9 1.4
Lamda Max 3.1 CI 0.04 CR 6.49%
Factor A Element Factor B Element Root of Product Priority Vector
Total Removal Partial Removal Leave in Place
Total Removal 0.09 0.14 0.03 0.09
Partial Removal 0.45 0.71 0.81 0.66
Leave in Place 0.45 0.14 0.16 0.25
Total 1 1 1 1
Factor A Element Factor B Element Weight
Total Removal Partial Removal Leave in Place
Total Removal 1 0.20 0.20 0.34 0.08 Partial Removal 5 1 3.00 2.466212074 0.60 Leave in Place 5 0.33 1 1.19 0.29
Total 11.0 1.5 4.2 4.14 Priority Row 0.9 0.9 1.2
Lamda Max 3.0 CI 0.01 CR 2.29%
36
Table 4.1.28 Normalized Matrix
Table 4.1.29 Weighting of Shipping Access Subcriteria with Alternatives
Based on data CR is 5.78%, because CR < 10% then the decision is consistent.
Table 4.1.30 Normalized Matrix
Table 4.1.31 Weighting of Work Safety Risks with Alternatives
Based on data CR is 7.2%, because CR < 10% then the decision is consistent. Total Removal Partial Removal Leave in Place
Total Removal 0.09 0.13 0.05 0.09
Partial Removal 0.45 0.65 0.71 0.61
Leave in Place 0.45 0.22 0.24 0.30
Total 1 1 1 1
Factor A Element Factor B Element Weight
Total Removal Partial Removal Leave in Place
Total Removal 1 5 9 3.56 0.69 Partial Removal 0.20 1 7 1.12 0.22 Leave in Place 0.11 0.14 1 0.25 0.05
Total 1.3 6.1 17.0 5.15 Priority Row 0.90 1.33 0.83
Lamda Max 3.07 CI 0.03 CR 5.78%
Root of Product Priority Vector Factor A Element Factor B Element
Total Removal Partial Removal Leave in Place
Total Removal 0.763 0.814 0.529 0.702
Partial Removal 0.153 0.163 0.412 0.242
Leave in Place 0.085 0.023 0.059 0.056
Total 1 1 1 1
Factor A Element Factor B Element Weight
Total Removal Partial Removal Leave in Place
Total Removal 1 7 9 3.98 0.74 Partial Removal 0.14 1 5 0.89 0.17 Leave in Place 0.11 0.20 1 0.28 0.05
Total 1.3 8.2 15.0 5.36 Priority Row 0.9 1.4 0.8
Lamda Max 3.1 CI 0.0 CR 7.20%
37 Table 4.1.32 Normalized Matrix
Table 4.1.33 Weighting of Fishing Activities Safety with Alternatives
Based on data CR is 7.2%, because CR < 10% then the decision is consistent.
Table 4.1.34 Normalized Matrix
Table 4.1.35 All Weight Evaluation
Total Removal Partial Removal Leave in Place
Total Removal 0.797 0.854 0.600 0.750
Partial Removal 0.114 0.122 0.333 0.190
Leave in Place 0.089 0.024 0.067 0.060
Total 1 1 1 1
Factor A Element Factor B Element Weight
Total Removal Partial Removal Leave in Place
Total Removal 1 7 9 3.98 0.74 Partial Removal 0.14 1 5 0.89 0.17 Leave in Place 0.11 0.20 1 0.28 0.05
Total 1.3 8.2 15.0 5.36 Priority Row 0.93 1.37 0.79
Lamda Max 3.08 CI 0.04 CR 7.20%
Priority Vector Factor A Element Factor B Element Root of Product
Total Removal Partial Removal Leave in Place
Total Removal 0.80 0.85 0.60 0.75
Partial Removal 0.11 0.12 0.33 0.19
Leave in Place 0.09 0.02 0.07 0.06
Total 1 1 1 1
Factor A Element Factor B Element Weight
PLB HTK PB PD OP RA AK PP EA AP RKP APR 0.66 0.25 0.09 0.09 0.66 0.25 0.25 0.09 0.66 0.25 0.09 0.66 Total Removal 0.25 0.09 0.09 0.09 0.09 0.09 0.09 0.09 0.09 0.70 0.75 0.75 Partial Removal 0.66 0.66 0.66 0.66 0.25 0.25 0.25 0.66 0.61 0.24 0.19 0.19 Leave in Place 0.09 0.25 0.25 0.25 0.66 0.66 0.66 0.25 0.30 0.06 0.06 0.06
38
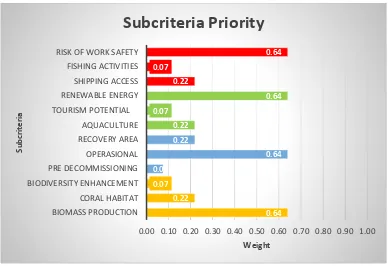
Figure 4.2b Determining The Priority of Each Subcriteria
Figure 4.2c All Weight Evaluation
0.64
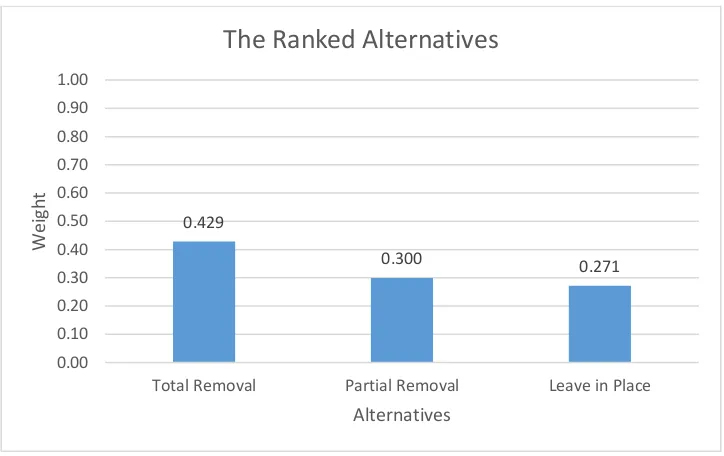
39 Figure 4.2d The Ranked Alternatives
Table 4.1.35 is the result of computation by inputting the eigen vector and summing up all the eigen vectors associated with each alternative. Based on the above data obtained the weight of all weight evaluation of DRE alternatives. The highest weight of all weight evaluation is best decision of DRE alternative. So it can be known from respondent 1 that the best decision of DRE alternative is total removal with the weight is 0.429.
2) Respondent 2
Table 4.2.1 Comparison Pairwise between Criteria
Based on the Table 4.2.1 obtained weighting data based on the second expert thought in determining the priority. In this case the expert selects from 4 criteria. From the above data obtained CR is 0.14%, because CR <10% then the decision is consistent.
0.429
Total Removal Partial Removal Leave in Place
Wei
Environment 1 5.0 3.0 1 1.97 0.408
Cost 0.2 1 1 0.3 0.51 0.105
Conversion 0.3 1 1 0.3 0.58 0.120
Safety 1 3.0 3.0 1 1.73 0.359
Total 2.53 10 8 2.67 4.82 1
Priority Row 1.03 1.05 0.96 0.96
40
Table 4.2.2 Normalized Matrix
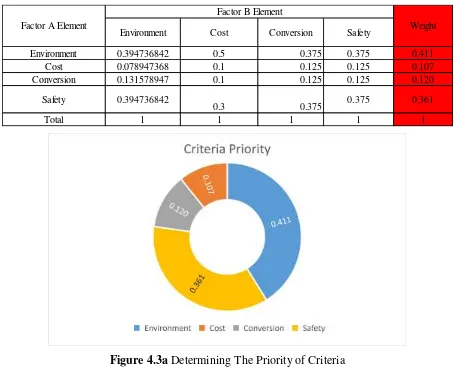
Figure 4.3a Determining The Priority of Criteria
Table 4.2.3 Weighting of Environtmental Criteria with Subcriteria
Based on data CR is 0%, because CR < 10% then the decision is consistent. Environment Cost Conversion Safety
Environment 0.394736842 0.5 0.375 0.375 0.411 Cost 0.078947368 0.1 0.125 0.125 0.107 Conversion 0.131578947 0.1 0.125 0.125 0.120
Safety 0.394736842
0.3 0.375 0.375 0.361
Total 1 1 1 1 1
Weight Factor A Element
Factor B Element
Biomass Production Coral Habitat Biodiversity Enhancement
Biomass Production 1 0.2 0.2 0.34 0.09 Coral Habitat 5.0 1 1 1.71 0.45
Biodiversity
Enhancement 5.0 1 1 1.71 0.45 Total 11.00 2.20 2.20 3.76 1 Priority Row 1.00 1.00 1.00
Lamda Max 3.00 CI 0.00 CR 0.0% Factor A Element
Factor B Element