Copyright © 2018 EMITTER International Journal of Engineering Technology - Published by EEPIS
75 symptoms but every arrhythmia requires different treatments. For arrhythmia detection, the cardiologist uses electrocardiogram that represents the cardiac electrical activity. And it is a kind of sequential data with high complexity. So the high performance classification method to help the arrhythmia detection is needed. In this paper, Long Short-Term Memory (LSTM) method was used to classify the arrhythmia. The performance was boosted by using AdaDelta as the adaptive learning rate method. As a comparison, it was compared to LSTM without adaptive learning rate. And the best result that showed high accuracy was obtained by using LSTM with AdaDelta. The skipped a beat, added a beat, fluttering, beating too fast, or beating too slow. The other symptoms are weakness, dizziness, fainting, and usually pain in the chest. It can happen because of heart disease, imbalance of electrolytes in the blood, change in heart muscle, injury from heart attack, or healing process after heart surgery. It can be harmless or harmful depending on what kind of arrhythmia that the patient suffers.
People with arrhythmia usually feel the same physical symptoms and every arrhythmia requires different treatments. To detect the arrhythmia, the cardiologist uses electrocardiogram as a standard tool to examine it.
EMITTER International Journal of Engineering Technology, ISSN: 2443-1168
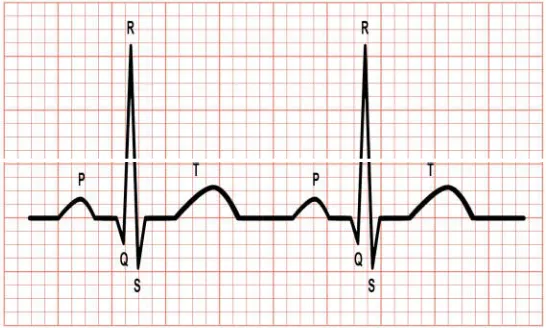
electrical activity of heartbeat is recorded on the recording paper. The record is shown as periodical waveform which normally has five kind of wave in every period (one period is also known as a beat). Those are P wave, Q-R-S wave complex, and T wave.
Figure 1. A two periods of normal ECG wave. The vertical small box represents the voltage of heartbeat electricity in 0.1 millivolts and the horizontal small
box represents the time in 0.04 seconds.
P wave is the first component of ECG waveform. It represents atrial depolarization. QRS complex represents ventricular depolarization. This complex normally comes after P wave. And T wave represents ventricular recovery or repolarization.
In this research, Long Short-Term Memory (LSTM) method is used to deal with the raw ECG signal data. LSTM is a type of Recurrent Neural Network (RNN). It overcomes basic RNN’s weakness which is difficult to learn the important information from further gap of time. When using neural network, there is a common issue to resolve. That is finding the best learning rate value to improve the performance of the network. In this research, instead of tuning the learning rate by trial and error, it is tuned automatically by using adaptive learning rate method.
2. RELATED WORKS
There are already many researches about classification of arrhythmia. Some people used raw data (waveform) of arrhythmia from MIT-BIH database (or other data source) and the others used structured data of arrhythmia from UCI database.
EMITTER International Journal of Engineering Technology, ISSN: 2443-1168 classification was done by using SVM and ANN. The highest accuracy was obtained with SVM Gaussian kernel of 98.49%. Alonso-Atienza et al. [6] used two classification approaches which were shockable vs non-shockable classification and Ventricular Fibrillation (VF) vs non-VF classification by using SVM. The results were 98.6% accuracy for shockable vs non-shockable and 96.8% for VF vs non-VF. Kumari and Kumar [7] optimized the neural network by using genetics algorithm to find the optimum learning rate and momentum. They got improved accuracy which was 96.93%. Chauhan and Vig [8] used two-hidden-layered LSTM to classify five classes, which were normal, PAC, PVC, paced beat, and ventricular couplet. And they got F-score of 0.9645 for test data. And Kiranyaz et al. [9] tried to use 1-Dimentional CNN to classify three classes, which were normal, supraventricular ectopic beats (SVEB), and ventricular ectopic beats (VEB) labels. The records were segmented by using R-wave-centered segmentation. The averages of accuracies were 98.83% for VEB and 96.8% for SVEB.
And in 2017 to 2018, Isin and Ozdalili [10] used 1-hidden-layered MLP to classify three classes, which were normal, RBBB, and paced beats. The point of 200 steps after R wave was used to segment the records. The features were extracted by using AlexNet five convolutional layers. The accuracy was 92%. Warrick and Homsi [11] used a combination of Convolution Neural Networks (CNN) and LSTM to classify normal, atrial fibrillation, noisy, and other beats. The accuracy was improved by using pooling, dropout and normalization techniques. The combination used was actually inefficient as LSTM could directly process the sequential data. And the F1 score was 0.83. Zhang et al. [12] used LSTM to classify VEB and SVEB beats. Every beat was segmented from the preceding T wave to the current T wave. And the accuracy was about 99% for VEB data and about 98% for SVEB data. Salloum and Kuo [13] used traditional RNN, LSTM, and GRU. The performance was improved by using adaptive learning rate (ALR) as adaptive learning rate technique. The accuracy was very close to 100% but the labels used were not written clearly. Xiong et al. [14] used RNN, CNN, and spectrogram learning to classify normal, atrial fibrillation (AF), noisy, and other beats. The performance was improved by using ALR. And the accuracies were 90% for normal label, 82% for AF label, and 75% for other label. Maknickas and Maknickas [15] used LSTM boosted using ALR to classify normal, AF, and other label. And the average of F1 scores was 0.78. Yildirim [16] used unidirectional and bidirectional LSTM boosted using ALR to classify Normal Sinus Rhythm (NSR), Ventricular Premature Contraction (VPC), Paced Beat (PB), Left Bundle Branch Block (LBBB), and Right Bundle Branch Block (RBBB). And the best accuracy was 99.39% for bidirectional LSTM. All of the currently discussed researches used the waveform data.
EMITTER International Journal of Engineering Technology, ISSN: 2443-1168
because the number of samples of each class is very unbalance. Until now, no one gets high accuracy for multiclass classification with these structured data. And these data were not used in this paper.
3. ORIGINALITY
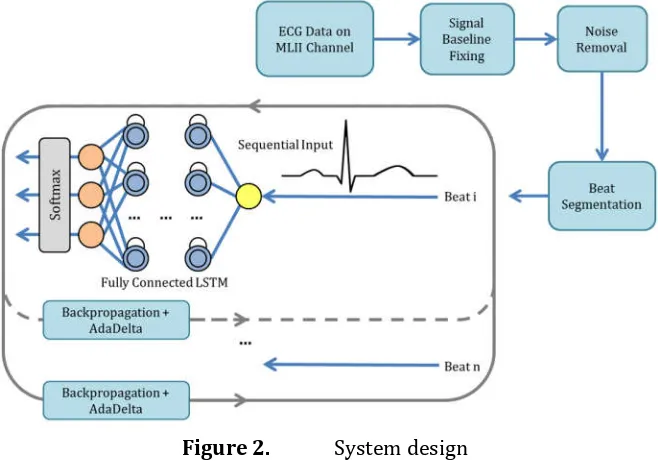
In this research, Long Short-Term Memory (LSTM) method was used to classify 3 (three) different types of heart beat which were normal, premature ventricular contraction, and premature atrial contraction. The network’s input was a sequential data of the segmented beats. The data type was digital waveform signal from MLII channel of ECG. It was obtained from MIT-BIH Arrhythmia Database. Two bandpass filters were used. The first filter was used to remove the noises and the second filter was used to find the segmentation points the beats. For performance boosting, an adaptive learning rate method was used. Unlike other papers [13, 14, 15, 16], which used Adam [21] as adaptive learning rate technique, AdaDelta was used in this paper on a purpose to efficiently avoid fast overfitting as the train and the test data were obtained from different records. As a comparison, the result was also compared to LSTM without any adaptive learning rate method.
4. SYSTEM DESIGN
The proposed system contains Long Short-Term Memory method to classify the sequential data of ECG signals. The labels contain Normal, Premature Atrial Contraction (PAC), and Premature Ventricular Contraction (PVC). Based on the signals that have some noises and non-zero leveled baseline, the preprocessing steps are required. There is a learning rate adaptation to optimize the parameter change of the network on each iteration. The data, including data preprocessing, are discussed below.
EMITTER International Journal of Engineering Technology, ISSN: 2443-1168 4.1 Dataset
The dataset were obtained from MIT-BIH Arrhythmia Database (https://www.physionet.org/physiobank/database/mitdb/). There were 48 records with about 30 minutes long every record. The records contained frequency of sampling 360 Hz. There were two signals in every record. The upper one was the signal from modified lead II (MLII) and the lower one was the signal from lead V1, V2, V4, or V5 (the signals in record 114 were reversed).
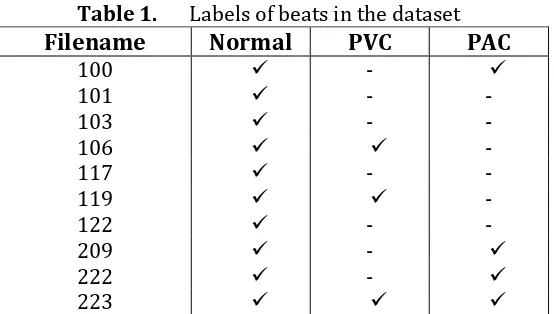
There were 13 (thirdteen) records used which already had annotation file (record number 100, 101, 103, 106, 117, 119, 122, 207, 209, 214, 222, 223, and 231). The annotations were created by two or more cardiologists. Only channel MLII was used to classify three kinds of label (normal, PAC, and PVC). Based on the channel that was focused on, record number 207, 214, and 231 were not used. It contained bundle branch block which needed a vertical channel classification, for example channel V1 or V6.
Table 1. Labels of beats in the dataset
Filename Normal PVC PAC
The annotation files contained the position of R waves and the label of the beats (the index of R position was not always at the peak of the wave, so it needed to be fixed first). The annotation files were used to help identify the position of R wave in the beats segmentation. It is explained in Chapter 4.2 about preprocessing. The classes used in this research are explained below.
a. Normal
EMITTER International Journal of Engineering Technology, ISSN: 2443-1168 b. Premature Atrial Complex
Premature Atrial Complex (PAC) or Premature Atrial Contraction or Atrial Premature Beats [1, 2, 3] is a beat that occurs earlier before the predicted time caused by atrial electrical activity that discharge the atria early. It can be triggered by nicotine, fatigue, fever, alcohol, anxiety, and infectious disease. The beat appears as early beat with abnormal P wave morphology followed by regular QRS complex. The P wave is occasionally buried in the previous T wave either fully or partially.
c. Premature Ventricular Complex
Premature Ventricular Complex (PVC) or Premature Ventricular Contraction or Ventricular Premature Beats [1, 2, 3] is the contraction of ventricles before signals reached AV node. Some of the common causes of PVC are myocardial ischemia or infarction, electrolytes imbalances, hypoxemia, caffeine or alcohol ingestion, tobacco use, metabolic acidosis, and drug intoxication. The beat appears as wide and bizarre QRST complex without P wave and its amplitude is frequently greater than normal. Usually, the ST segment and T wave direction is opposite to the QRS complex. After the PVC occurs, a short pause before the next beat may be found. The bizarre QRST complex has many different forms. PVCs can appear as uniform or multiform beats.
Figure 3. The beats of 6 seconds ECG record (the abnormal beats are underlined). The vertical axis represents the voltage of heartbeat electricity
in millivolts and the horizontal axis represents the time in seconds.
4.2 Data Preprocessing
EMITTER International Journal of Engineering Technology, ISSN: 2443-1168 The signal was disrupted by some noise and its baseline was moved away from zero level. The baseline could be pulled back by subtracting the value with the mean of all sample points of the signal. There were high frequency noise (caused by mucles contraction) which made the signal’s surface rough and low frequency noise (caused by respiratory movement) which disrupted the trend of the baseline (wandering baseline). To remove high and low frequency noise, the 6th-order bandpass filter was used with cut-off at 1.8-18 Hz which passed the frequencies between the cut-offs and removed the frequencies outside that range.
Figure 4. The original signal (blue) and the filtered signal (red). The vertical axis represents the voltage of heartbeat electricity in millivolts and the
horizontal axis represents the time in seconds.
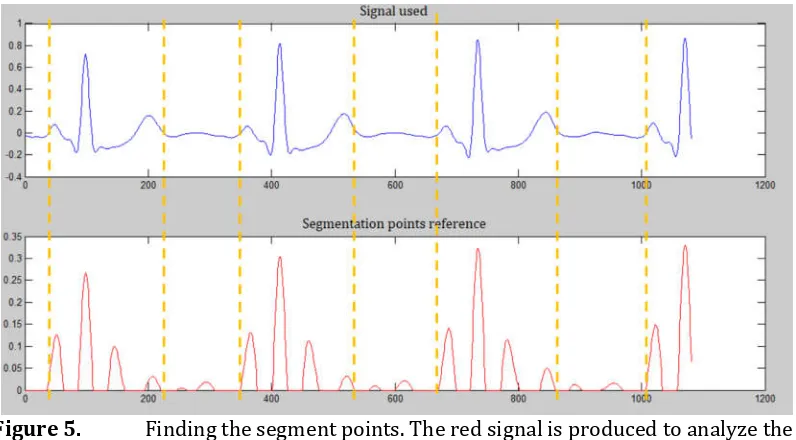
The abnormal beats which were used in this research have premature occurence that disrupted its P wave. To avoid miss detection of P wave, the segmentation was focused on the beat that appeared in the middle between two normal beats. In segmentation term, some related work [10, 13] used Pan Tompkins [22] technique to find QRS complexes. But in this research, the fixed R positions from annotation files were used.
EMITTER International Journal of Engineering Technology, ISSN: 2443-1168
Figure 5. Finding the segment points. The red signal is produced to analyze the start and the end occurrence points of the blue signal. The vertical axis represents the voltage of heartbeat electricity in millivolts and the horizontal
axis represents the index of the signal values.
The preprocessed signals (in Figure 5, it is referred to the blue signal on the top) were segmented and resampled to get the beats with a length of 100 points. File 100, 101, 103, 106, 117, 209, and 223 were used as train data and file 119, 122, and 222 were used as test data.
The normal beats were taken from every record as many as 10 samples for train data and as many as 20 samples for test data. Those numbers were also used in getting the PAC samples. Regarding to the PVC beats which have multiform morphology in the train data; the number of beats taken was 10 samples (if any) for every rhythm change. And the PVC beats for test data were only 20 samples from every record based on its uniform morphology in the test data file. The dataset is as follows:
Table 2. The number of train and test samples
Data Use Normal PVC PAC Total
Train 70 247 30 347
EMITTER International Journal of Engineering Technology, ISSN: 2443-1168
Figure 6. A sample of normal beat (left), PVC (center), and PAC (right). The beats are the result of segmentation step of the system. The vertical axis represents the voltage of heartbeat electricity in millivolts and the horizontal
axis represents the index of the signal values.
4.3 Long Short-Term Memory as Classification Method
Long Short-Term Memory (LSTM) [23] is the method that replaces Recurrent Neural Network (RNN) [24]. It is like the basic RNN which has recurrent (context) unit to be used across time. The context unit value is obtained from the result of the hidden node.
Figure 7. Recurrent neural network with 1 input node and 3 output nodes
EMITTER International Journal of Engineering Technology, ISSN: 2443-1168 1. Initialize the weights and biases
2. Initialize r[ ] = 0
3. Take the sequence value at time t and for each node compute y_i = f(w_xi * x_t + w_ri * r_ti + bi)
4. Assign r[ ] = y[ ]
5. Back to step 3 until t = max(t)
6. Compute for each node z_i = g(∑(w_yi * yi) + bi) 7. Compute losses
8. Compute new weights and biases by using backpropagation through time
9. Back to step 2 until iRecord = max(iRecord)
But, if the sequences are quite long, the gradients computed during training either vanish (multiplication of many 0 < values < 1) or explode (multiplication of many large values) causing it to train very slowly. And in 1997, the vanishing gradient problem of RNN was covered by a new algorithm called Long Short-Term Memory. Unlike the basic neural network node, LSTM has more complex in-node structure. It has a memory cell value to store the information and three gates to control what to store, and when to allow reads, writes and erasures.
Figure 8. LSTM structure in a hidden node
EMITTER International Journal of Engineering Technology, ISSN: 2443-1168 as well as h. There are four sigma nodes, means that there are four different vectors of weights and biases. The LSTM node structure that was introduced by Alex Graves [25] was implemented in this paper.
4.4 AdaDelta as Adaptive Learning Rate Method
The common issue of neural network is finding the right learning rate value (and momentum value if any). Too low learning rate can lead the network to very slow convergence and too high learning rate can lead the network to be trapped in local minima of error. Adaptive learning rate is very helpful method to accelerate the convergence and keep it in global minima of error when the network already reached it.
AdaDelta [26] is the adaptive learning rate method that overcomes the main weakness of AdaGrad [27], which is its accumulation of the squared gradient in the denominator. It causes the learning rate can be infinitesimally small and indicated begin to stop training. Instead of storing (like AdaGrad do), the sum of gradients is recursively defined as a decaying average of all past squared gradients. The algorithm of AdaDelta is as follows:
1. Initialize rho and epsilon
EMITTER International Journal of Engineering Technology, ISSN: 2443-1168
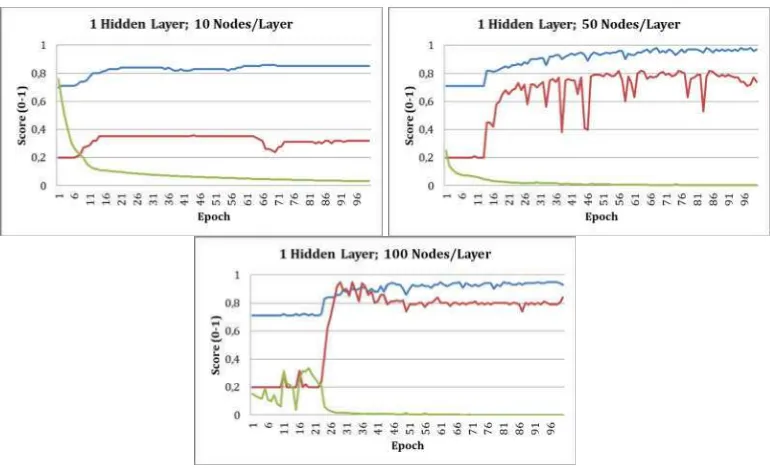
Figure 9. The performance of 1-hidden-layered LSTM with adaptive learning rate
The result in Figure 9 shows that the network with lower number of nodes had smooth error rate reduction. And the network with higher number of nodes had chaotic error rate reduction at the beginning of the epochs (about first 25 epochs) but it became stable at the rest of the epochs. For accuracy term, the accuracy of train data tend to be increasing at every epoch, but the accuracy of test data looked more fluctuating. Because of the result was still far enough from the good accuracy of medical term, the layer was added to 2 and 3 layers with 100 nodes each.
EMITTER International Journal of Engineering Technology, ISSN: 2443-1168
Figure 11. The performance of 3-hidden-layered LSTM with adaptive learning rate
As the result shown in Figure 10-11, more hidden layer made the network train faster. Although the error rate was chaotic at the first 10 epochs, it showed that it got stable faster with improving accuracies.
LSTM with AdaDelta could boost the speed to find the right network parameters (weights and biases). The fine-tuned parameters showed reduced error rate score. And in almost every epoch, the accuracy of train data was improved. In this experiment, more hidden nodes with the same decay rate and epsilon could improve the performance. But the result also showed that the accuracy of test data was fluctuating. It indicated that the network could be leaded to overfitting.
As a comparison, the performance of LSTM without AdaDelta was also shown in this paper. The Figure 12 below was the performance of LSTM without AdaDelta. The performance was from the optimized hyperparameter of learning rate and momentum.
EMITTER International Journal of Engineering Technology, ISSN: 2443-1168
As the result shown in Figure 12, the network without AdaDelta trained slower than the network that used AdaDelta. It seemed that the accuracy of test data was more chaotic than the accuracy of test data that used AdaDelta. There were several significant increases in error rates mean that the network without AdaDelta could not maintain its fine-tuned parameters (weights and biases). But the error rates of the other side (network with AdaDelta) seemed to be significantly fluctuating only at the first 30 epochs (only at the first 10 epochs when using 2 and 3 hidden layers) and kept it fine at the rest of the epochs. For accuracy and error rate comparison, Table 3 shows the best combination of the accuracies of train and test data followed by its error rate. It was the result of the networks with 100 nodes each layer.
Table 3. The best accuracy combination of the experiments
Experiment Accuracy
Table 3 shows that the networks with AdaDelta got higher accuracies and lower error rate than the network without AdaDelta got. The overall performance showed that the best performance was obtained by using the three-hidden-layered network with AdaDelta.
The incorrect classified data can be analyzed by using confusion matrix and the following table is the confusion matrix of the best result.
Table 4. The confusion matrix of the best result with train data
Actual\Predicted Normal PAC PVC
Normal 70 0 0
PAC 7 23 0
PVC 0 0 247
Table 5. The confusion matrix of the best result with test data
Actual\Predicted Normal PAC PVC
Normal 60 0 0
PAC 3 17 0
PVC 0 0 20
EMITTER International Journal of Engineering Technology, ISSN: 2443-1168 PAC-labeled data were classified as a normal beat. Based on the information of the cardiac beat types in Chapter 4.1 about dataset, a PAC beat sometimes appears as an early regular beat with abnormal P wave morphology. It was also confirmed in Figure 3 and Figure 6. Although the best network could classify the PVC beats which had multiform morphology, it failed to classify some of the PAC beats which had high similarity with the normal beats.
6. CONCLUSION
In this research, Long Short-Term Memory (LSTM) method was used to classify the waveform of 3 classes which were normal, Premature Ventricular Contraction, and Premature Atrial Contraction. AdaDelta was used as adaptive learning rate method to boost the performance of the network. The number of layer was added from one to three layers. The best performance was obtained by using three-hidden-layered LSTM with AdaDelta which were 0.98 for train data and 0.97 for test data with 1.42E-04 error rate. The best network failed to classify some of the PAC beats which had high similarity with the normal beats. The performance of LSTM with AdaDelta was far better than the performance of LSTM without AdaDelta. But the result showed that the accuracy trend of the test data was still unstable. Although AdaDelta could still handle it, the network could be leaded to be overfitting.
For further work, the optimum combination of the hyperparameters is required to get a better result. And for beat segmentation, the simple segmentation method used in this paper is only suit with the beat that occurs in the middle between two normal beats. The better segmentation method is required to get better segmented beats that have many kinds of form in any condition.
REFERENCES
[1] M. Gabriel Khan, Rapid ECG Interpretation, 3rd ed., Christopher P. Cannon and Annemarie M. Armani, Eds., Humana Press Inc. (Totowa), 2008.
[2] B. G. Petty, Basic Electrocardiography, Springer Science+Business
Media (New York), 2016.
[3] Lippincott Williams, Wilkins, ECG Interpretation Made Incredibly Easy!, 5th ed., Tracy S. Diehl, Ed., Chris Burghardt (China), 2011.
[4] V. S. R. Kumari, P. Rajesh Kumar, Cardiac Arrhythmia Prediction Using Improved Multilayer Perceptron Neural Network,
International Journal of Electronics, Communication & Instrumentation
Engineering Research and Development, vol. 3, no. 4, pp. 73-80, October
2013.
[5] Meng Huanhuan, Zhang Yue, Classification of Electrocardiogram Signals with Deep Belief Networks, International Conference on
EMITTER International Journal of Engineering Technology, ISSN: 2443-1168
[6] Felipe Alonso-Atienza, Eduardo Morgado, Lorena Fernandez-Martınez, Arcadi Garcia-Alberola, Jose Luis Rojo-Alvarez, Detection of Life-Threatening Arrhythmias Using Feature Selection and Support Vector Machines, IEEE Transactions on Biomedical Engineering, vol. 61, no. 3, pp. 832-840, March 2014.
[7] V. S. R. Kumari, P. Rajesh Kumar, Optimization of Multi-Layer Perceptron Neural Network Using Genetic Algorithm for Arrhythmia Classification, Communications, vol. 3, no. 5, pp. 150-157, September 2015.
[8] Sucheta Chauhan, Lovekesh Vig, Anomaly Detection in ECG Time signals Via Deep Long Short-Term Memory Networks, Data Science
and Advanced Analytics, Paris, 2015.
[9] Serkan Kiranyaz, Turker Ince, Ridha Hamila, Moncef Gabbouj, Convolutional Neural Networks for Patient-Specific ECG Classification, Engineering in Medicine and Biology Society, Milan, 2015.
[10] Ali Isin, Selen Ozdalili, Cardiac Arrhythmia Detection Using Deep Learning, International Conference on Theory and Application of Soft
Computing, Budapest, 2017, pp. 268–275.
[11] Philip Warrick, Masun N. Homsi, Cardiac Arrhythmia Detection from ECG Combining Convolutional and Long Short-Term Memory Networks, Computing in Cardiology, vol. 44, 2017.
[12] Chenshuang Zhang, Guijin Wang, Jingwei Zhao, Pengfei Gao, Jianping Lin, Huazhong Yang, Patient-Specific ECG Classification Based on Recurrent Neural Networks and Clustering Technique, IASTED
International Conference on Biomedical Engineering, Innsbruck, 2017.
[13] Ronald Salloum, C. -C. Jay Kuo, ECG-Based Biometrics Using Recurrent Neural Networks, Acoustics, Speech and Signal Processing (ICASSP), New Orleans, 2017.
[14] Zhaohan Xiong, Martin K. Stiles, Jichao Zhao, Robust ECG Signal Classification for Detection of Atrial Fibrillation Using a Novel Neural Network, Computing in Cardiology, vol. 44, 2017.
[15] Vykintas Maknickas, Algirdas Maknickas, Atrial Fibrillation Classification Using QRS Complex Features and LSTM, Computing
in Cardiology, vol. 44, 2017.
[16] Ozal Yildirim, A Novel Wavelet Sequences Based on Deep Bidirectional LSTM Network Model for ECG Signal Classification,
Computers in Biology and Medicine, pp. 189-202, 2018.
[17] Saleha Samad, Shoab A. Khan, Anam Haq, Amna Riaz, Classification of Arrhythmia, International Journal of Electrical Energy, vol. 2, pp. 57-61, March 2014.
[18] Albert Haque, Cardiac Dysrhythmia Detection with GPU-Accelerated Neural Networks, Stanford University, Stanford, 2014. [19] Ali Bahadorinia, Ali Dolatabadi, Ahmad Hajipour, A Hybridized
EMITTER International Journal of Engineering Technology, ISSN: 2443-1168 Diagnosis Of Cardiac Arrhythmias, Advances in Computer Science: An
International Journal, vol. 3, no. 4, pp. 51-58, July 2014.
[20] Malay Mitra, R. K. Samanta, Cardiac Arrhythmia Classification Using Neural Networks with Selected Features, International Conference
on Computational Intelligence: Modeling Techniques and Applications,
2013, pp. 76-84.
[21] Diederik P. Kingma, Jimmy Lei Ba, Adam: A Method for Stochastic Optimization, Arxiv Preprint Arxiv:1412.6980v9, December 2014. [22] Jiapu Pan, Willis J. Tompkins, A Real-Time QRS Detection Algorithm,
IEEE Transactions on Biomedical Engineering, vol. BME-32, pp.
230-236, March 1985.
[23] Sepp Hochreiter, Jurgen Schmidhuber, Long Short-Term Memory,
Neural Computation, vol. 9, no. 8, pp. 1735-1780, 1997.
[24] Jeffrey L. Elman, Finding Structure in Time, Cognitive Science, San Diego, 1990, pp. 179-211.
[25] Alex Graves, Supervised Sequence Labelling with Recurrent Neural Network, Arxiv Preprint Arxiv:1308.0850v5, June 2014.
[26] Matthew D. Zeiler, Adadelta: An Adaptive Learning Rate Method,
Arxiv Preprint Arxiv:1212.5701, December 2012.
[27] John Duchi, Elad Hazan, Yoram Singer, Adaptive Subgradient Methods for Online Learning and Stochastic Optimization, Journal