Operations strategy in an emerging economy:
the case of the Ghanaian manufacturing industry
Kwasi Amoako-Gyampah
a,∗, Samuel S. Boye
baDepartment of Information Systems&Operations Management,
Bryan School of Business&Economics, University of North Carolina, Greensboro, NC 27402, USA
bSchool of Administration, University of Ghana, Legon, Ghana
Received 15 September 1999; accepted 24 March 2000
Abstract
Operations strategy and its development have received a lot of attention in the operations management literature. However, as noted by Ward et al. (1995), an understanding of the factors that influence operations strategy development has not been widely studied. Further, how managers of firms in underdeveloped countries develop operations strategy has yet to receive any significant attention among researchers. This paper takes a look at the development of operations strategy in an underdeveloped economy, Ghana. Specifically, the paper examines the relationships between the business environment and the operations strategy choices made by firms in Ghana. The paper seeks to understand the influence that specific business environmental factors have on the operations strategy choices of low cost, quality, flexibility, and delivery dependability.
A survey of manufacturing firms was carried out in 1998. The respondents (production managers in those firms) were asked to indicate the extent to which business costs, labor availability, competitive hostility, and environmental dynamism were of concern to them. They were also asked to indicate their extent of emphasis on the operations strategy choices of quality, cost, flexibility and delivery dependability. This paper presents the result of the analysis of the relationships between the environmental factors and the operations strategy choices. The data indicate that, among firms in Ghana, the two strongest factors that influence the degree of emphasis placed on operations strategy choices are perceived business costs and competitive hostility. Results are presented for both large and small firms, and for firms that are completely locally owned as well as for joint venture firms. © 2001 Elsevier Science B.V. All rights reserved.
Keywords:Operations strategy; Economy; Ghana
1. Introduction
Operations strategy is generally defined as the de-velopment of specific competitive strengths based on the operations function that is aimed at helping an organization achieve its long-term competitive goals.
∗Corresponding author. Tel.:+1-336-334-4989;
fax:+1-336-334-4083.
E-mail addresses:kwasi [email protected]
(K. Amoako-Gyampah), [email protected] (S.S. Boye).
The concept of operations strategy began to receive some coverage in the operations management litera-ture following the seminal work of Skinner (1969) in which he delineated the role that manufacturing strat-egy can play in the formulation and implementation of corporate strategy. The thrust of Skinner’s article was that management needed to recognize the tradeoffs involved in the development of an appropriate oper-ations strategy. Skinner postulated a model in which the business environment drives the content of oper-ations strategy through the latter’s linkage with the
business strategy. In other words, an understanding of the business environment is important in understand-ing the formulation of manufacturunderstand-ing strategy.
Since Skinner’s work there have been several different papers on different aspects of operations strategy. Some of these studies have sought to argue for the need to recognize the competitive advan-tages that operations strategy provides (Buffa, 1984; Hayes and Wheelwright, 1984; Prahalad and Hamel, 1990). Other studies have sought to identify, under-stand and/or clarify the content of operations strategy (Hayes and Wheelwright, 1984; Leong et al., 1990; Roth and van der Velde, 1991; Vickery et al., 1993; Miller and Roth, 1994; Ward et al., 1994, 1996). Yet others have looked at specific approaches for building manufacturing competence such as flexible manu-facturing, just-in-time manumanu-facturing, total quality management, lean production and agile manufactur-ing (Schonberger, 1982; Garvin, 1988; Womack et al., 1990; Upton, 1995; Duguay et al., 1997). Some of these studies have been conceptual in nature while others have been empirically based.
Business environmental issues have long been rec-ognized as important considerations in the develop-ment of corporate strategy (Porter, 1980). However, as noted by Ward et al. (1995), environmental issues have not received much attention in operations strategy research. This lack of attention is occurring although empirical evidence seems to suggest that practicing managers do consider environmental factors when they seek to develop operations strategy. In a case study of six manufacturing firms on the development of manufacturing strategy conducted by Marucheck et al. (1990), the data showed that managers in-deed do consider the importance of the assessment of competitors and customers in the development of manufacturing strategy. Thus, research linking en-vironmental issues and operations strategy choice is worth pursuing.
This paper examines the business environmen-tal factors that influence operations strategy choices among firms in Ghana. The study seeks to build on the work of Swamidass and Newell (1987) and the work of Ward et al. (1995). The study is important because, first, as pointed by Ward and his colleagues, it is very likely that environmental factors affect operations strategy development differently in differ-ent regions of the world. Swamidass and Newell’s
study was confined to 35 firms in the US (a highly de-veloped country), and Ward et al.’s study was carried out among firms in Singapore (a newly industrialized economy). Insights from Ghana (an emerging econ-omy) should therefore be worthwhile. The contribu-tion here is to find out if the general theory proposed by Ward et al. is applicable in an emerging economy. The generalizability of the theory is enhanced if it can be shown that it applies in an economic environment such as pertains in Ghana.
The second reason this study is important is that it is an empirical study and more empirical studies are needed in order to build the necessary founda-tion for the development of theory on operafounda-tions strategy. Therefore, studies such as ours will help extend the knowledge base and the understanding of operations strategy needed to advance theory development.
The motivation for studying the specific environment and a brief discussion of the economic environment are presented in the next section. This is followed by a presentation of the model and hy-potheses that form the foundation of this study. The research method is then described, followed by a presentation and discussion of the results. The paper ends with the conclusions.
2. Motivation and background
2.1. Motivation
Similarly, there have been a number of studies that have examined existing practices in several develop-ing countries and others have compared practices be-tween developing and developed countries. Several of these studies can be found in Whybark and Vastag (1993).
However, even among the studies that have been done in developing countries, very few have been devoted to countries in Africa. This apparent lack of interest might be due to the perception that African countries do not represent a viable source for infor-mation and analysis with regard to understanding manufacturing. However, not unlike the economies of the Caribbean countries and Latin American coun-tries, countries in Africa are gradually moving from agrarian economies to industry and service-oriented economies. Structural adjustment programs pre-scribed by international financial agencies such as the World Bank and the IMF have accompanied some of that movement. These structural adjustment programs are designed to force these emerging countries into a mode of development that has been found to work for developing countries.
As will be explained later in the case of Ghana, the programs often require, among others, privatization of government agencies, removal of price controls, re-moval of government subsidies to local producers (to encourage operational efficiencies) and the reduction of tariffs on imports. All these measures tend to have a more significant impact on the manufacturing sec-tor than on any other secsec-tor of the economy within the countries. However, macroeconomic data in these countries suggest that manufacturing continues to sur-vive. The contributions of manufacturing to GDP for some of the countries in Africa that have implemented IMF/World Bank reforms have remained sturdy. Thus, studies on operations strategy that have allowed the manufacturing sector to maintain stability in the face of the structural changes would be instructive to other countries (such as in the Caribbean and Latin America) that are either undergoing or considering IMF/World Bank reforms. In other words, the findings of this study could be easily generalized for manufacturing firms in other emerging economies.
In addition, as advocated by Banker and Khosla (1995), if research in the field of operations manage-ment is to advance, there is no question that new re-search perspectives that enhance theory development
are needed. This requires that we broaden our arena for data collection beyond traditional sites.
2.2. The Ghanaian manufacturing environment
The above arguments provided the motivation for us to collect data on operations strategy in Ghana. But why Ghana, one might ask? To begin with, the authors have had some success in Ghana with previous data collection efforts. Second, Ghana is a country that has received some attention in the popular business and re-lated press with regard to the success of its economic reform programs (Leechor, 1994). To the extent that the economic environment plays an important role in the use of manufacturing practices (Chikan and Why-bark, 1990) we felt that this would be an environment worth studying. We, at this point, provide a brief dis-cussion of the economic environment in which a typ-ical manufacturing firm in Ghana operates. The po-tential impact of the economic environment on the re-sults obtained in this study will be elaborated in the discussion section of the paper.
the government was still in the process of divesting itself of 20 enterprises with an additional 20 planned for 1999 (Katsouris, 1998).
The World Bank currently classifies Ghana’s econ-omy as low income. The estimated 1998 gross domes-tic product (GDP) per capita was US$ 410. Average annual GDP growth was about 4.3% between 1988 and 1998. Inflation has been averaging about 30% since 1990. Gross domestic investment averaged an annual growth rate of only 3.8% for the period 1988–1998. The adult literacy rate is 65% and the active labor force averages about 45% of the population.
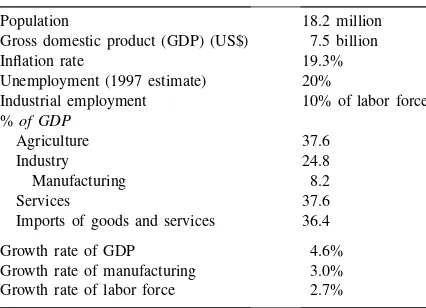
Until 1987 agriculture was the largest contributor to GDP, representing about 50% of total GDP. Since 1988 agriculture has lost ground to industry and to services. For 1998, agriculture’s contribution to GDP was estimated at 37.6%, services (mostly trading) at 37.6% and industry (mining and manufacturing) at 24.8%. The manufacturing sector is relatively small compared to the manufacturing sector in industrialized countries. Manufacturing activity accounted for about 8.2% of GDP between 1988 and 1998 with an average annual growth rate of about 3.1% during the same period. Table 1 provides a summary of some of the economic indicators.
The growth rate of manufacturing in Ghana during the last ten years in the face of IMF/World Bank re-forms is testimony to the resilience and tenacity of manufacturing firms in Ghana. If the country survives
Table 1
Economic environment of Ghana at a glance in 1998a
Population 18.2 million
Gross domestic product (GDP) (US$) 7.5 billion
Inflation rate 19.3%
Unemployment (1997 estimate) 20%
Industrial employment 10% of labor force %of GDP
Agriculture 37.6
Industry 24.8
Manufacturing 8.2
Services 37.6
Imports of goods and services 36.4
Growth rate of GDP 4.6%
Growth rate of manufacturing 3.0% Growth rate of labor force 2.7%
aMost of the above data were culled from World Development
Indicators, a publication of The World Bank, Washington, DC, March, 1999.
the IMF/World Bank medicine, there is a strong like-lihood that the manufacturers that have been taken through the adjustment ‘fire’ and can now compete un-der adverse market and environmental conditions will thrive. Therefore, reporting on how manufacturers in Ghana incorporate economic and environmental con-ditions, economic realities that low-income countries are sometimes not used to, in their operations strate-gies will most certainly extend the boundaries of op-erations management research.
3. Model and hypotheses
quality, and delivery performance. Thus, some of their findings confirmed those of the earlier work by Swamidass and Newell.
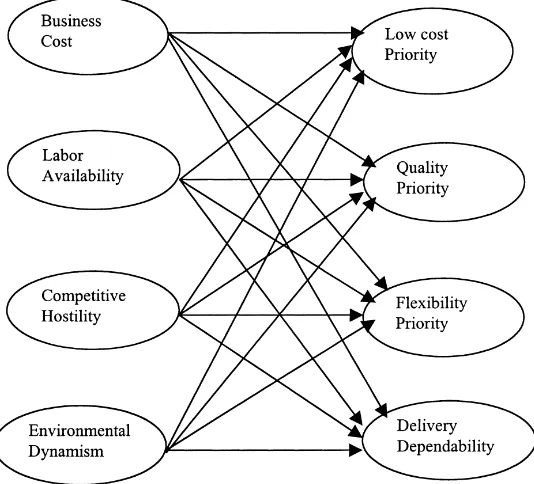
Our study is an extension of the Ward et al. (1995) study in a different environment, Ghana. We seek to understand the nature of the relationships be-tween the environmental factors identified by Ward et al. and operations strategy choices among firms in Ghana. It is generally accepted that managers de-velop their operations strategy around four choices (Buffa, 1984; Swamidass and Newell, 1987). These choices are low cost, quality, flexibility, and delivery performance. These four choices have, at other times, been referred to collectively as competitive manu-facturing capabilities (Cleveland et al., 1989; Ward et al., 1996). There are several ways of capturing the business environment. Again, since this study seeks to build on the work by Ward et al. (1995), we will limit our assessment of the business environment to the four variables used by Ward et al. in their study. These four variables are business cost, labor availability, competitive hostility and environmental dynamism.
The previously cited studies have indicated that one can expect some relationships between the nature of the business environment that a manufacturing firm faces and the specific operations strategy choices by that firm. The question is will this be true for firms in an emerging economy? Our first hypothesis is there-fore as follows.
Hypothesis 1. The degree of emphasis that firms place on different operations strategy choices will be positively correlated with their perceptions of the nature of the business environment.
Our second hypothesis is aimed at examining the specific nature of any relationships that exist between the business environmental factors and the operations strategy choices. We are interested in knowing if direct paths exist between each of the business envi-ronmental factors and the previously identified oper-ations strategy choices. Both Swamidass and Newell (1987) and Ward et al. (1995) have demonstrated the existence of the links between the environmental fac-tors and operations strategy choices and we wanted to find out the nature of the relationships among firms in Ghana.
We state our second hypothesis as follows.
Hypothesis 2. The environmental factors of business cost, labor availability, competitive hostility and dy-namism will have significant impact on the degree of emphasis that managers place on the operations strat-egy choices of low cost, quality, flexibility and deliv-ery performance.
The conceptual model underlying the above hypoth-esis is shown in Fig. 1. We are positing that each of the business environmental factors will have signifi-cant effects on each of the strategy choices.
Neither Swamidass and Newell (1987) nor Ward et al. (1995) studied the effect that firm size might have on the emphasis placed on operations strategy choices. Ward et al. (1995) looked at the effect that industry type might have on strategy choices. They did not find any significant effects between industry type and strat-egy choices. Further, the potential number of firms in our sample population was not sufficiently large to permit any partitions based on industry type. There-fore, we decided to explore the impact that firm size and capital structure might have on strategy choices.
A small firm with limited resources will be expected to perceive its business environment as being different from that of a large firm with perhaps more resources. Also, a small firm is likely to face different environ-mental pressures with regard to the competitiveness of the market it operates in and how it obtains and pays for needed resources compared to a larger firm.
The approaches that a large firm uses to bench-mark its competitors, find and negotiate with suppliers for example are expected to be different from the ap-proaches used by a small firm (Vickery et al., 1999). Further, the structure of a small firm is likely to be different from that of a large firm and previous studies on manufacturing strategy have alluded to a possible linkage between organizational structure and strategy development (Nemetz and Fry, 1988; Kotha and Orne, 1989; Marucheck et al., 1990; Parthasarthy and Sethi, 1992; Ward et al., 1996). Therefore, one would expect the degree of emphasis placed on operations strategy choices to be different for small and large firms. Thus, our third hypothesis is as follows.
Fig. 1. Conceptual model of environmental factors and operations strategy priorities.
placed on operations strategy choices will be different for small and large firms.
We further extend the study of Ward et al. (1995) by looking at the effect that foreign ownership might have on the nature of the relationships that exist be-tween business environmental factors and the empha-sis placed on strategy choices. A firm that is com-pletely locally owned with no foreign ownership is likely to perceive its business environment differently from a firm that has some foreign owners. For exam-ple, a locally owned firm might perceive its competi-tion as being just other local firms while a joint venture firm might perceive its competition as coming from both within and outside the country. In addition, joint venture firms are more likely to have greater access to capital and other resources. As such they will be expected to develop different strategies in order to re-act to changes occurring in the business environment. The empirical support for our arguments can be found in the study by McDougall et al. (1992). In that study, the authors examined the manufacturing strategies of 64 new venture firms in the computer and communica-tions equipment manufacturing industries. They found
out that the manufacturing strategies emphasized by independent firms were different than those empha-sized by corporate-sponsored firms. Thus, the nature of the ownership seems to affect the choice of operations strategy. We state the hypothesis formally as follows.
Hypothesis 4. The nature of the relationships be-tween business environmental factors and operations strategy choices will be different for locally owned firms and joint venture firms.
4. Research method
the same environment (Amoako-Gyampah and Boye, 1998) indicated that firms in Ghana and firms in other emerging economies are, very often, reluctant to pro-vide financial and other information related to their performance. Lastly, public financial performance data are not easily available. We felt that the response rate would increase if performance information were not included in the survey.
Through the cooperation of the Association of Ghana Industries (AGI) and the Institute of Economic Affairs in Ghana, surveys were mailed to 78 manufac-turing firms in Ghana. The targeted respondent was the firm officer with the title of production manager or its equivalent. A production manager is usually a high level official within manufacturing firms in Ghana and the role of such an individual is such that he/she would be the officer in the firm mostly to have the required information. An equivalent role would be, say the vice president of operations in a manu-facturing firm in the US. About 30 of the production managers were among participants of a 4-day work-shop on developing manufacturing capability that was organized in Ghana in July 1998. This is likely to have increased the validity of the responses that were obtained and might have contributed to the high response rate as well.
4.1. Measures
The measures used in assessing the environmental and operations strategy choices are described below.
4.1.1. Business cost
Business cost was assessed by asking respondents to provide answers to eight questions dealing with rising labor, material, transportation, telecommunica-tions, health care, utilities, and rental costs. They also had to answer a question about the weakness of the local currency. A five-point Likert type scale was used with responses ranging from (1) ‘very unimportant’ to (5) ‘very important’.
4.1.2. Labor availability
This was assessed with six items expressing con-cern about shortage of managerial and administrative staff, technicians, clerical and related workers, skilled workers, production workers and the inability to oper-ate a third shift. Responses here also ranged from (1) ‘very unimportant’ to (5) ‘very important’.
4.1.3. Competitive hostility
Seven items were used to assess competitive hos-tility. The questions dealt with rising competition in local and foreign markets, declining demand in lo-cal and foreign markets, low profit margins, meeting quality standards and finding reliable suppliers. The scale ranged from (1) ‘very unimportant’ to (5) ‘very important’.
4.1.4. Environmental dynamism
Questions on dynamism focused on rates at which products and services become outdated, rate of prod-uct and service innovations, and changes in consumer tastes and preferences. A five-point Likert type scale with responses ranging from (1) ‘slow’ to (5) ‘rapid’ was used.
4.1.5. Low cost
For this operations strategy choice, four questions asking about the degree of emphasis placed on reduc-ing unit costs, material costs, overhead costs and in-ventory levels were used. The responses ranged from (1) ‘no emphasis’ to (5) ‘extreme emphasis’.
4.1.6. Quality
This was assessed by seeking responses to the degree to which firms placed emphasis on reduc-ing defect rates, improvreduc-ing product performance and reliability, improving vendor quality, implementing quality control circles, and obtaining ISO 9000 cer-tification. The scale was (1) ‘no emphasis’ to (5) ‘extreme emphasis’.
4.1.7. Flexibility
Four questions were used to assess flexibility. The questions focused on the extent of emphasis placed on reducing manufacturing lead-time, procurement lead-time, set-up time, and new product development time. The scale was the same as for the other two previous operations strategy choices.
4.1.8. Delivery performance
Demographic and other data collected include the type of industry, the number of employees, the amount of fixed assets and the capital structure of the firm. Capital structure referred to whether the respondent firm was wholly locally owned, was a joint venture between local owners and foreign owners or whether it was completely foreign owned. The complete ques-tionnaire is available from the authors.
5. Results
A total of 61 responses, representing a response rate of about 78%, were received from the firms after
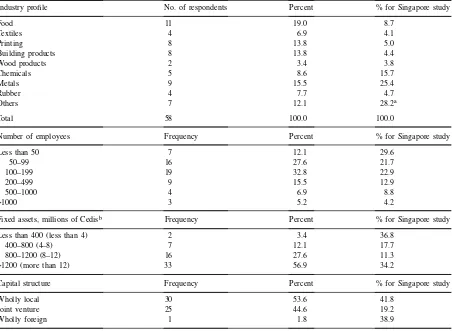
Table 2
Demographics of responding firms
Industry profile No. of respondents Percent % for Singapore study
Food 11 19.0 8.7
Textiles 4 6.9 4.1
Printing 8 13.8 5.0
Building products 8 13.8 4.4
Wood products 2 3.4 3.8
Chemicals 5 8.6 15.7
Metals 9 15.5 25.4
Rubber 4 7.7 4.7
Others 7 12.1 28.2a
Total 58 100.0 100.0
Number of employees Frequency Percent % for Singapore study
Less than 50 7 12.1 29.6
50–99 16 27.6 21.7
100–199 19 32.8 22.9
200–499 9 15.5 12.9
500–1000 4 6.9 8.8
>1000 3 5.2 4.2
Fixed assets, millions of Cedisb Frequency Percent % for Singapore study
Less than 400 (less than 4) 2 3.4 36.8
400–800 (4–8) 7 12.1 17.7
800–1200 (8–12) 16 27.6 11.3
>1200 (more than 12) 33 56.9 34.2
Capital structure Frequency Percent % for Singapore study
Wholly local 30 53.6 41.8
Joint venture 25 44.6 19.2
Wholly foreign 1 1.8 38.9
aThis is an aggregated number from the Singapore study (Ward et al., 1995).
bAt the time of this study one US dollar was equivalent to 2300 Ghanaian Cedis. Numbers in parenthesis represent millions of
Singapore dollars for the Singapore study.
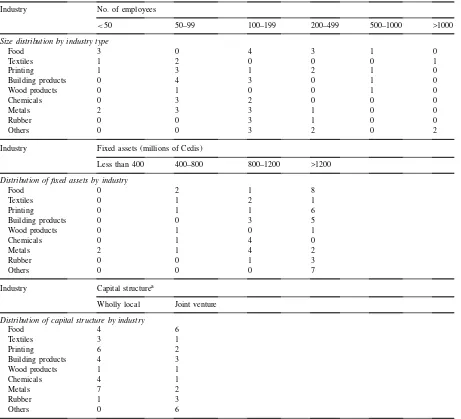
Table 3
Size, fixed assets and capital structure by industry type Industry No. of employees
<50 50–99 100–199 200–499 500–1000 >1000
Size distribution by industry type
Food 3 0 4 3 1 0
Textiles 1 2 0 0 0 1
Printing 1 3 1 2 1 0
Building products 0 4 3 0 1 0
Wood products 0 1 0 0 1 0
Chemicals 0 3 2 0 0 0
Metals 2 3 3 1 0 0
Rubber 0 0 3 1 0 0
Others 0 0 3 2 0 2
Industry Fixed assets (millions of Cedis)
Less than 400 400–800 800–1200 >1200 Distribution of fixed assets by industry
Food 0 2 1 8
Textiles 0 1 2 1
Printing 0 1 1 6
Building products 0 0 3 5
Wood products 0 1 0 1
Chemicals 0 1 4 0
Metals 2 1 4 2
Rubber 0 0 1 3
Others 0 0 0 7
Industry Capital structurea
Wholly local Joint venture Distribution of capital structure by industry
Food 4 6
Textiles 3 1
Printing 6 2
Building products 4 3
Wood products 1 1
Chemicals 4 1
Metals 7 2
Rubber 1 3
Others 0 6
aThere was only one company that was fully foreign owned.
a more detailed descriptive data showing the size dis-tribution, fixed assets, and the capital structure across different industries. These tables are provided because of the uniqueness of the dataset and their potential to enhance the discussion of the results.
A comparison of the responding firms with the non-responding firms shows no significant differences in terms of size or industry type. In fact, the average number of employees and the industry distribution is
identical to those reported by Amoako-Gyampah and Boye (1998).
5.1. Preliminary analyses
Table 4
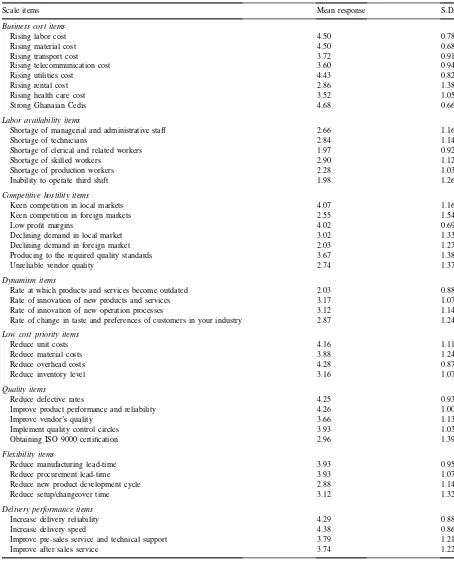
Responses on individual variables
Scale items Mean response S.D.
Business cost items
Rising labor cost 4.50 0.78
Rising material cost 4.50 0.68
Rising transport cost 3.72 0.91
Rising telecommunication cost 3.60 0.94
Rising utilities cost 4.43 0.82
Rising rental cost 2.86 1.38
Rising health care cost 3.52 1.05
Strong Ghanaian Cedis 4.68 0.66
Labor availability items
Shortage of managerial and administrative staff 2.66 1.16
Shortage of technicians 2.84 1.14
Shortage of clerical and related workers 1.97 0.92
Shortage of skilled workers 2.90 1.12
Shortage of production workers 2.28 1.03
Inability to operate third shift 1.98 1.26
Competitive hostility items
Keen competition in local markets 4.07 1.16
Keen competition in foreign markets 2.55 1.54
Low profit margins 4.02 0.69
Declining demand in local market 3.02 1.33
Declining demand in foreign market 2.03 1.27
Producing to the required quality standards 3.67 1.38
Unreliable vendor quality 2.74 1.37
Dynamism items
Rate at which products and services become outdated 2.03 0.88
Rate of innovation of new products and services 3.17 1.07
Rate of innovation of new operation processes 3.12 1.14
Rate of change in taste and preferences of customers in your industry 2.87 1.24 Low cost priority items
Reduce unit costs 4.16 1.11
Reduce material costs 3.88 1.24
Reduce overhead costs 4.28 0.87
Reduce inventory level 3.16 1.07
Quality items
Reduce defective rates 4.25 0.93
Improve product performance and reliability 4.26 1.00
Improve vendor’s quality 3.66 1.13
Implement quality control circles 3.93 1.03
Obtaining ISO 9000 certification 2.96 1.39
Flexibility items
Reduce manufacturing lead-time 3.93 0.95
Reduce procurement lead-time 3.93 1.07
Reduce new product development cycle 2.88 1.14
Reduce setup/changeover time 3.12 1.32
Delivery performance items
Increase delivery reliability 4.29 0.88
Increase delivery speed 4.38 0.86
Improve pre-sales service and technical support 3.79 1.21
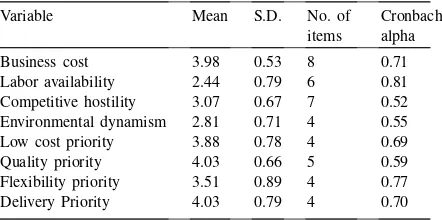
Table 5
Summary statistics and reliability of constructs
Variable Mean S.D. No. of
items
Cronbach alpha
Business cost 3.98 0.53 8 0.71
Labor availability 2.44 0.79 6 0.81 Competitive hostility 3.07 0.67 7 0.52 Environmental dynamism 2.81 0.71 4 0.55 Low cost priority 3.88 0.78 4 0.69 Quality priority 4.03 0.66 5 0.59 Flexibility priority 3.51 0.89 4 0.77 Delivery Priority 4.03 0.79 4 0.70
results of this study. We provide summary statistics on the constructs as well as the Cronbach coefficient alpha (measure of reliability) for each construct in Table 5. For the most part, all the alpha values ei-ther exceed or meet the minimum requirements of 0.5–0.6 for an exploratory study such as this one (Nunnally, 1978).
The main point of interest in this study is to examine the nature of the relationships between the environ-mental variables and the operations strategy choices. Therefore, in Table 6 we show only the correlations between the environmental factors and the operations strategy choices. We observe significant and positive correlations between the business cost and the oations strategy choices of low cost and delivery per-formance. Labor availability is significantly correlated with only delivery performance. Perceived competitive hostility is highly correlated with low cost, quality, and flexibility, and slightly correlated with the delivery pri-ority. Environmental dynamism is positively and sig-nificantly correlated with only the flexibility measure. The several observed significant and positive correla-tions suggest that Hypothesis 1 cannot be rejected.
Table 6
Labor availability 0.18 0.12 0.15 0.32∗∗
Competitive hostility 0.37∗ 0.45∗ 0.44∗ 0.16
Dynamism 0.04 0.14 0.25∗∗∗ 0.13
∗P
<0.01.
∗∗P<0.05. ∗∗∗P<0.10.
5.2. Path analyses
Both Swamidass and Newell (1987) and Ward et al. (1995) have argued strongly on the appropriateness of using path analyses to examine the relationships be-tween environmental factors and operations strategy choices and we therefore decided that path analyses would be an appropriate technique to use in this study. A two-stage approach was used in constructing the paths. First, each of the strategy choices (i.e. low cost, quality, flexibility, and delivery performance) was used as the dependent variable and stepwise regression was used to remove the environmental variables (i.e. busi-ness cost, labor availability, competitive hostility and dynamism) that did not contribute uniquely to the de-pendent variable. The second stage involved carrying out multiple regression analyses between the depen-dent variable and the resultant environmental factors (as independent variables).
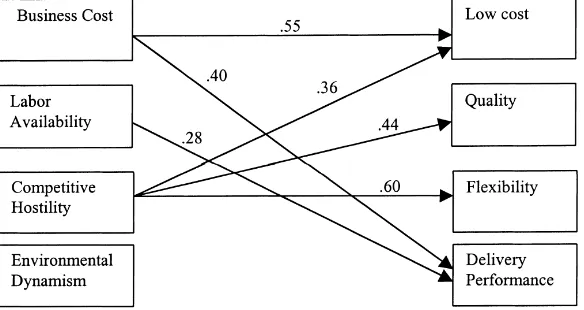
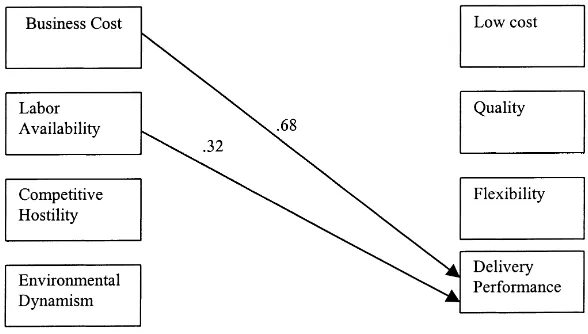
Fig. 2 shows the results of the path analyses for all the firms. The path coefficients (standardized regres-sion coefficients) are shown on the arrows. The path analytic model shows that the only business environ-mental factor that influences the degree of emphasis placed on quality is the perceived competitive hostil-ity. Competitive hostility has a direct positive and sig-nificant effect (β=0.44, P<0.001) on quality and it accounts for about 20% of the variance in quality.
The predictors of low cost are the perceived com-petitive hostility and perceived business costs. Com-petitive hostility has a direct positive effect on low cost (β=0.36,P<0.05) and business cost has a direct ef-fect on low cost (β=0.55,P<0.01). Competitive hos-tility and business costs account for about 27% of the variance in low cost. The only factor that appears to have a direct effect on the degree of emphasis on flex-ibility is the perceived competitive hostility (β=0.60, P<0.001) and it accounts for about 20% of the vari-ance in the use of flexibility as a priority.
Fig. 2. Path model of environmental factors and operations strategy choices.
no direct significant effects on any of the operations strategy choices.
The severally observed positive and significant di-rect effects of the environmental variables on various operations strategy choices indicate that Hypothesis 2 cannot be rejected. Since there is at least one path to each of the operations strategy choices it means that business environmental factors appear to influence the content of operations strategy among firms in Ghana. The significance of these results will be discussed later in the paper.
5.3. Size and capital structure effects
The total number of firms in the sample did not per-mit us to examine the effect of industry type on the nature of the relationships. Also, as indicated previ-ously, Ward et al. did not find any significant indus-try effects in their analyses. Therefore, we felt that a more significant contribution to the literature would be obtained if we examine the impact that the size of the company and the capital structure of the firm had on the nature of relationships between environmental factors and operations strategy choices.
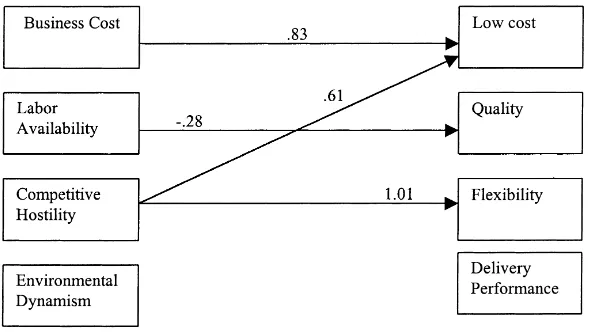
5.3.1. Size effects
Fig. 3 shows the relationships between the environ-mental factors and the operations strategy choices for large firms while the observed relationships for small firms are shown in Fig. 4. Small firms were identified
as firms with less than 100 employees. Hypothesis 3 is aimed at determining if the role that environmen-tal factors have on operations strategy choices will be different depending on whether the firm is large or small. Thus, if one examines the nature of the rela-tionships between the business environmental factors and strategy choices for both small and large firms and there is at least one path present in one group but absent in the other, then the hypothesis cannot be rejected.
The predictors of quality for large firms are com-petitive hostility and labor availability. However, for small firms labor availability is the only business en-vironmental factor that has an influence on the use of quality as a priority. Labor availability has a direct negative effect on quality (β=−0.28,P<0.10).
For large firms the predictors of low cost are busi-ness costs and labor availability while for small firms the predictors of low cost are business costs and competitive hostility. The only factor that has an in-fluence on flexibility for small firms is the perceived competitive hostility (β=1.01, P<0.01), while for large firms both business costs and competitive hos-tility have significant effects on flexibility. Business cost has a negative impact (β=−0.49,P<0.10) while competitive hostility has a positive impact (β=0.51, P<0.05).
im-Fig. 3. Environmental factors and operations strategy choices for large firms.
pacts on the amount of emphasis placed on delivery performance.
To summarize, a comparison of Figs. 3 and 4 shows that more significant relationships are observed be-tween environmental factors and operations strategy choices for large firms than for small firms. Further, different factors appear to have different impacts on the various strategy choices for the two groups of firms. Lastly, the strengths of the relationships are dif-ferent as indicated by the path coefficients. The above provide strong evidence for Hypothesis 3 and there-fore the hypothesis cannot be rejected.
Fig. 4. Environmental factors and operations strategy choices for small firms. 5.3.2. Capital structure effects
To study the effects of capital structure on choice of operations strategy, the firms were partitioned into two groups, wholly local firms, and jointly owned firms (i.e. firms with some foreign ownership). Fig. 5 shows the relationships among the factors and the strategy choices for wholly locally owned firms. The observed significant relationships for jointly owned firms are shown in Fig. 6.
Fig. 5. Relationships for wholly locally owned firms.
operations strategy choices. However, for firms that are jointly owned, the perceived competitive hosti-lity plays no significant role in the operations strategy choices. In fact, for joint venture firms, the only strat-egy element that can be predicted from the business environment factors is the delivery performance. De-livery performance, for local firms, can be predicted from competitive hostility as noted earlier and from labor availability. Table 3 shows that the different in-dustries are spread out fairly evenly across the differ-ent sizes. Small firms are not confined to only spe-cific industries and large firms are also not confined to
Fig. 6. Relationships for joint venture firms.
specific industries. Thus, the emphasis placed on op-erations strategy choices by the firms cannot be at-tributed to industry differences among the firms.
both local and joint venture firms, environmental dy-namism plays no significant role in operations strategy choices.
Figs. 5 and 6 clearly indicate that differences ex-ist in the roles that business environment factors play in the degree of emphasis placed on operations strat-egy choices for locally owned firms and for firms with some foreign ownership. Thus, Hypothesis 4 cannot be rejected. A Chi-square test of the distributions of the wholly local and joint venture firms across differ-ent industries (see Table 3) showed that significant dif-ferences were not evident from the sample. Thus, the differences in the way wholly locally owned firms and joint venture firms respond to the same environmen-tal pressures through their operations strategy choices cannot be attributed to the way those firms are dis-tributed across different industries.
Table 7
Summary of predictors of operations strategy content
Business environment factor Low cost Quality Flexibility Delivery
All firms
Business costs Xa X
Labor availability Y X
Competitive hostility X, Wb X, W X, W Y, W
Environmental dynamism W Y, W Y, W Y, W
Large firms
Business costs X X X
Labor availability X X X
Competitive hostility X X
Environmental dynamism Small firms
Business costs X
Labor availability X X
Competitive hostility X X
Environmental dynamism Local firms
Business costs X X
Labor availability X
Competitive hostility X X X X
Environmental dynamism Joint venture firms
Business costs X
Labor availability X
Competitive hostility Environmental dynamism
aPredictors are indicated with an X for Ghana study.
bWe use Y and W to indicate the observed relationships for high and low performers, respectively, in the Singapore study.
6. Discussion
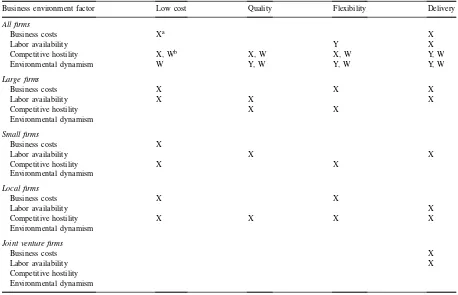
To facilitate our discussion we present a summary of our findings in Table 7. We include as part of the table the observed significant paths from the Singapore study (Ward et al., 1995). This is done so as to facilitate the discussion and to point out some of the differences between our results and the results from the Singapore study.
direct significant effect on delivery performance for all firms. This effect is present for large firms, small firms, and local firms. Lastly, for all firms, competi-tive hostility influences the degree of emphasis placed on flexibility as a component of operations strategy and this effect is again observed for large firms, small firms and locally owned firms.
Table 7 also points out some interesting and unique observations. First, labor availability’s direct effect on the low cost component is only observed for large firms. Second, competitive hostility’s impact on de-livery performance is observed only for firms that are locally owned. Lastly, none of the significant relation-ships between business environment factors and oper-ations strategy choices observed for all firms is present in joint venture firms except for the effect of business cost and labor availability on delivery strategy. These results are further discussed below.
In general, the data suggest that, for firms in Ghana, the perceived competitive hostility is the one factor that has the most influence on operations strategy choices. Competitive hostility has direct significant ef-fects on the emphasis placed on low cost, quality and flexibility as operations strategy choices. The specific concerns about competitive hostility are evident from a closer examination of Table 4 (shown earlier). The manufacturing firms in Ghana were not particularly concerned about abilities (or lack of) to compete in foreign markets. Neither were they concerned about any perceived declining demand in foreign markets. Rather, they were more concerned about increased competition in local markets, declining demands in local markets and their ability to meet increasing quality standards. To address these concerns they planned to place more emphasis on reducing defect rates, improving product reliability and reducing unit costs.
That perceived competitive hostility appears to have so much influence is not surprising. The economic en-vironment of a country plays a very important role in the use of manufacturing management practices by companies within the country and Ghana is no excep-tion (Chikan and Whybark, 1990). As menexcep-tioned pre-viously, in order to reverse severe economic crisis in Ghana in the early 1980s, the government began im-plementing a structural reform program prescribed by the IMF/World Bank, the features of which were de-scribed earlier.
The resultant effect of these reforms is that there has been a surge in imports (with imported goods enjoy-ing unfettered access to the Ghanaian market). For the period 1988–1998, Ghana’s GDP grew at an annual rate of 4.3% while the growth rate of imports for the same period was 7.3% (The World Bank, 1999). The growth in imports has resulted in a weakening of the competitive abilities of local firms (US Department of Commerce, 1998). In fact most of the manufacturing companies operate substantially below capacity. Thus, if the firms are to be successful with their operations strategy they would need to consider the competitive hostility in the market place, a hostility that has be-come more pervasive as a result of economic reforms. The influence of competitive hostility on operations strategy choices appears to be even stronger for firms that are locally owned. Competitive hostility is a strong predictor of all four operations strategy choices. On the other hand, for firms that are jointly owned, com-petitive hostility is not a predictor of any of the op-erations strategy components. A possible explanation for this difference is that some of the firms previously operated in an environment of price controls and gov-ernment subsidies and never paid much attention to competitive market forces. With the market reforms (discussed earlier), firms are suddenly faced with in-creased competition and have to consider the inin-creased market hostility in their operations decisions. How-ever, firms with some foreign ownership might be used to operating in a market oriented economy or perhaps have management personnel who are used to operating in an economy dominated by market forces and thus do not need to be overtly concerned with perceived market forces.
The influence that competitive hostility has on the degree of emphasis placed on operations strategy choices is still observed when firms are partitioned into large and small sizes. For large firms, competi-tive hostility affects the degree of emphasis placed on quality and flexibility while for small firms it affects the emphasis placed on cost and flexibility. The differ-ence might be attributed to the different capabilities of small and large firms and their differing abilities to respond to the same pressures as explained later.
and on delivery performance for all the firms. Again, the explanation could be the changes in the economic environment. As noted previously, some of the com-panies had been operating in an environment of gov-ernment subsidies and price quotas. Thus, production efficiency was of minor concern. With the removal of price controls and subsidies, they began to face in-creasing production costs. This is reflected in Table 4, which shows that greater than average concerns were expressed by the firms on rising labor costs, rising ma-terial costs, rising costs of utilities and the value of the Ghanaian currency. High local production costs fre-quently boost the price of locally manufactured items above the landed cost of goods imported from Asia and elsewhere. Reductions in tariffs (for imported goods) have increased competition for local producers and manufacturers while reducing the cost of imported raw materials (US Department of Commerce, 1998). Therefore, business costs will be expected to influence the emphasis placed on operations strategy choices.
The influence of perceived business costs on flexi-bility is worthy of further discussion. For large firms as well as locally owned firms the perceived business cost has a significant negative effect on the empha-sis on flexibility. Pursuing flexibility requires invest-ments that lead to reductions in product cycle times, manufacturing lead times and changes in setup times. Thus, when firms are concerned about rising business costs (material, labor, transportation, etc.) they are less likely to pursue strategies that lead to flexibility. As Table 4 clearly shows the firms planned to place very minimal emphasis on reducing new product develop-ment times and setup times. Perhaps they consider the benefits of these investments as being more uncertain. When the data are aggregated for all the firms, la-bor availability only influences delivery performance. Unemployment in Ghana has averaged over 20% over the last couple of years and therefore labor availability appears not to be much of a concern. Again Table 4 shows that they are hardly concerned about shortages of clerical workers, production workers or even the ability to run a third shift. Labor availability’s impact on delivery performance holds regardless of whether the firms are locally owned or have some foreign own-ership.
The impact of labor availability on operations strat-egy changes when the firms are separated into large and small. For large firms, labor availability also
influ-ences the amount of emphasis on low cost and qual-ity priorities in addition to the delivery performance. For small firms labor availability has a significant neg-ative impact on quality. The labor availability factor included questions on lack of skilled workers and tech-nicians. Lack of skilled workers and technicians is likely to affect a small firm’s ability to offer high qual-ity products. Large firms, on the other hand, might have other resources that they might rely on to address quality issues when they are faced with unavailability of skilled workers and technicians. These assertions were confirmed when the responses on the individ-ual variables were examined in detail for small and large firms. Shortages of skilled workers and techni-cians were of greater concern to small firms than to large firms.
Environmental dynamism did not have any signifi-cant effects on any of the operations strategy choices. This is not surprising when one examines the business environment in which firms in Ghana currently oper-ate. Environmental dynamism was assessed by asking questions on the rate of innovation of products and services, rates at which products and services become outdated and the changes in consumer tastes and pre-ferences. Most of the companies responding to the sur-vey are not in industries that one would consider to be high technology based. They are operating in mostly mature industries where low prices and ability to de-liver products quickly are perhaps the order winners. Thus, shorter product life cycles and product innova-tion are not of great concern to these companies (see Table 4).
af-fected the emphasis on operations strategy choices for both high and low performers. However, for low per-formers, competitive hostility had the most influence on the content of operations strategy, a result similar to what we obtained in Ghana.
Table 7 clearly points the differences between the nature of the specific influences of the environmental variables and the operations strategy choices. The differences can be attributed to the different environ-ments in which firms in Ghana and firms in Singapore operate. Manufacturing activity represents about 25% of Singapore’s GDP while manufacturing activity con-tributed only 8.2% of Ghana’s GDP (see Table 2). The economic environment in Singapore in 1995 could also be perceived as one of rapid growth with rapidly changing technology whereas industrial development in Ghana grew only at a modest rate of 4.2% in 1996 (CIA, 1998). Manufacturing grew at an average an-nual growth rate of 7.5% between 1990 and 1997 for Singapore while the corresponding rate for Ghana dur-ing the same period was 2.7% (Euromonitor, 1998). Further, in the Singapore study, 38.9% of the firms in the survey were wholly foreign owned while in Ghana less than 2% were wholly foreign owned. Thus, it is not surprising that concerns about environmental dynamism played a significant role in the degree of emphasis placed on different operations choices in Singapore but had no such role among firms in Ghana.
6.1. Power analyses
The country selection, the environment in which the study was carried out and the desire to use primary data sources (i.e. direct survey responses as opposed to published public data) all limited the sample size used in the study. The sample size, though comparable to other published studies, means that we were not able to use more powerful statistical analyses such as covariance analyses. However, since the aim of this study was primarily to assess the impact of selected environmental variables on operations strategy content the correlation analyses and the multiple regressions should be adequate.
Another issue that often arises with the issue of limited sample sizes is whether undetected phenom-ena could be attributed to the limited sample size. In other words, if the researcher does not detect suspected phenomena, was that due to the sample size or did
the phenomena not exist? A way to address this is-sue is through the use of power analyses. The power of statistical tests indicates the probability of rejecting the null hypothesis. A test with a high power reduces the probability of failing to detect an effect when it is present (Verma and Goodale, 1995). Although power analyses are usually advocated when planning field ex-periments they can also be used after the studies have been finished to determine the significance of corre-lation and other statistical tests (Cohen, 1988). Verma and Goodale (1995) adequately discuss the applicabil-ity of power analyses for empirical studies in opera-tions management.
To assess the power of the hypotheses tested in this study we followed the conventional approach sug-gested by Cohen (1988). We used a medium size ef-fect based partly on the fact that small to medium size effects can be expected for empirical studies in oper-ations management (Verma and Goodale, 1995) and also partly on the relative stability of the instruments used in this study. For our correlation tests, we used a medium effect size of 0.40, and fixed the probabi-lity of committing a type I error at 0.05 (i.e.α=0.05). With our non-directional tests and our sample size of 58, we used the tables provided in Cohen (1988) to estimate the average power of our correlation tests at 0.89. This means that our tests had about 89% proba-bility of detecting any correlations if they existed. Fol-lowing the same procedure for our multiple regression tests, the average power obtained was 0.98. The re-sults of the power tests show that our correlation and regressions had what would normally be considered as high power (Verma and Goodale, 1995). The power analyses strengthen our discussions and conclusions and should minimize any doubts readers might have had because of the limited sample size.
7. Conclusion
choices. The important lesson here is that environmen-tal considerations appear to play a significant role in the determination of the content of operations strategy, even for firms in an emerging economy. Thus, opera-tions strategy researchers should not ignore the effect of the environment in their studies.
At the same time this study has pointed out that the nature of the specific business environment is very important. For example, whereas environmental dynamism played a larger role in operations strat-egy content in Singapore, our results show that the perceived competitive hostility appears to have the most influence on the degree of emphasis placed on various operations strategy choices for firms in Ghana. Environmental dynamism does not appear to have any effect on operations strategy choices among Ghanaian firms. We have explained these dif-ferences by highlighting some of the general macro economic data in the manufacturing environment in Ghana.
To summarize, this paper makes a contribution to the understanding of operations strategy because 1. It adds to the accumulated knowledge base on the
influence of environmental factors on operations strategy content. The contribution of the paper does not come from the nature or size of firms used in the study or even from the fact that Ghana is a relatively small and underdeveloped country. The contribution is helping researchers and prac-tising managers see how underlying economic factors affect the degree of emphasis placed on op-erations strategy choices. Thus, other researchers studying similar economic environments can use our findings to anticipate the types of operations strategies that firms in those environments are likely to pursue. In particular we would expect that the observed relationships between environmental factors and operations strategy choices would be very applicable to manufacturing firms in other African countries and countries in the Caribbean and Latin America, especially countries that are considering or implementing IMF/World Bank reforms.
2. It provides insights on the effects of specific envi-ronmental factors on each of the operations strat-egy choices and these insights should lead others to develop similar or different hypotheses on oper-ations strategy.
3. Previous studies on business environment and op-erations strategy have been confined to either de-veloped countries or fast developing countries. This study provides findings from an emerging econ-omy and this should encourage others to carry out similar studies in identical environments. Doing re-search in developing countries such as Ghana is feasible and the results obtained can add to the ex-isting knowledge base.
4. The differences between the results obtained in this study and the results obtained by Ward et al. (1995) could be attributed the specific nature of the busi-ness environment that firms in Singapore faced as opposed to that faced by firms in Ghana. Firms in Singapore, at the time of the Ward et al.’s study, operated in an environment of rapidly changing technology and fast expanding economy. Firms in Ghana, at the time of our study, were faced with increased imports and declining prices of imported materials. Therefore, another important contribu-tion of this study is that the specific nature of the business environment is important in trying to un-derstand the impact of the environment on opera-tions strategy content.
5. Our study has demonstrated that the effects of business factors on the operations strategy choices made by small firms are different from the effects that those same factors have on the strategy choices made by large firms. Similarly, our results show that the nature of ownership might be important when a firm is deciding on its operations strategy. These are unique contributions that are worthy of further exploration for the development of theory and a comprehensive understanding of operations strategy.
Acknowledgements
References
Amoako-Gyampah, K., Boye, S.S., 1998. Manufacturing planning and control practices and their internal correlates: a study of firms in Ghana. International Journal of Production Economics 54, 143–161.
Banker, R.D., Khosla, I.S., 1995. Economics of operations management: a research perspective. Journal of Operations Management 12 (3/4), 423–435.
Buffa, E.S., 1984. Meeting the Competitive Challenge. Dow Jones-Irwin, Homewood, IL.
Caddick, J.R., Dale, B.G., 1987. Sourcing from less developed countries: a case study. Journal of Purchasing and Management 23 (3), 17–23.
Central Intelligence Agency (CIA), 1995. The New World Factbook. CIA, Washington, DC, pp. 161–163.
Central Intelligence Agency (CIA), 1998. The New World Factbook. CIA, Washington, DC, pp. 181–183.
Chikan, A., Whybark, D.C., 1990. Cross-national comparison of production-inventory management practices. Engineering Costs and Production Economics 19, 149–156.
Cleveland, G., Schroeder, R., Anderson, J., 1989. A theory of production competence. Decision Sciences 20 (4), 655–688.
Cohen, J., 1988. Statistical Power Analysis for the Behavioral Sciences. Lawrence Erlbaum, Hillsdale, NJ.
Duguay, C.R., Landry, S., Pasin, F., 1997. From mass production to flexible/agile production. International Journal of Operations & Production Management 17 (12), 1183–1195.
Ebrahimpour, M., Schonberger, R.J., 1984. The Japanese just-in-time/total quality control production system: potential for developing countries. International Journal of Production Research 22 (3), 421–430.
Euromonitor International, 1998. International Marketing Data & Statistics. Euromonitor Inc., Chicago.
Garvin, D., 1988. Managing Quality: The Strategic and Competitive Edge. Free Press, New York, NY.
Hayes, R.H., Wheelwright, S.C., 1984. Restoring our Competitive Edge: Competing through Manufacturing. Wiley, New York, NY.
Hubbard, M., Baer, B. (Eds.), 1993. Cities of the World. Gale Research Inc., Detroit, MI, pp. 359–391.
Katsouris, C., 1998. Steady progress on privatization. In: Africa Recovery, Vol. 11, No. 3. United Nations Department of Public Information, NY.
Kotha, S., Orne, D., 1989. Generic manufacturing strategies: a conceptual synthesis. Strategic Management Journal 10 (3), 211–231.
Leechor, C., 1994. Ghana: frontrunner in adjustment. In: Husain, I., Faruqee, R. (Eds.), Adjustment in Africa. The World Bank, Washington, DC, pp. 153–192.
Leong, G.K., Synder, D.L., Ward, P.T., 1990. Research in the process and content of manufacturing strategy. OMEGA 18 (2), 109–122.
Marucheck, A., Pannesi, R., Anderson, C., 1990. An exploratory study of the manufacturing strategy process in practice. Journal of Operations Management 9 (1), 101–123.
McDougall, P.P., Deane, R.H., D’Souza, D.E., 1992. Manufacturing strategy and business origin of new venture firms in the computer and communications equipment industries. Production and Operations Management 1 (1), 53–69.
Miller, J.G., Roth, A.V., 1994. A taxonomy of manufacturing strategies. Management Science 40 (3), 285–304.
Nemetz, P., Fry, L.W., 1988. Flexible manufacturing organizations: implications for strategy formulation and organization design. Academy of Management Review 13 (4), 627–638.
Nunnally, J.C., 1978. Psychometric Methods. McGraw-Hill, New York, NY.
Parthasarthy, R., Sethi, S.P., 1992. The impact of flexible automation on business strategy and organizational structure. Academy of Management Review 17 (1), 86–111.
Porter, M.E., 1980. Competitive Strategy. Free Press, New York, NY.
Prahalad, C.K., Hamel, G., 1990. The core competence of the corporation. Harvard Business Review 68 (3), 79–91. Quelch, J.A., Austin, J.E., 1993. Should multinationals
invest in Africa? Sloan Management Review 34 (30), 107–119.
Roth, A.V., van der Velde, M., 1991. Operations as marketing: a competitive service strategy. Journal of Operations Management 10 (3), 303–328.
Schonberger, R.J., 1982. Japanese Manufacturing Techniques: Nine Hidden Lessons in Simplicity. Free Press, New York, NY.
Skinner, W., 1967. Procurement for international manufacturing plants in developing economies. Journal of Purchasing and Materials Management 3 (1), 5–19.
Skinner, W., 1969. Manufacturing-missing link in corporate strategy. Harvard Business Review 47 (3), 136–145. Swamidass, P.M., Newell, W.T., 1987. Manufacturing strategy,
environmental uncertainty and performance: a path analytic model. Management Science 33 (4), 509–524.
The World Bank, 1999. World Development Indicators. World Bank, Washington, DC.
Upton, D., 1995. What really makes factories flexible? Harvard Business Review 73 (4), 74–84.
US Department of Commerce, Bureau of Economic Analysis, 1998. Country Report on Economic Policy and Trade Practices, Ghana.
Van Dierdonck, R., Miller, J.G., 1980. Designing production planning and control systems. Journal of Operations Management 1 (1), 37–46.
Verma, R., Goodale, J.C., 1995. Statistical power in operations management research. Journal of Operations Management 13, 139–152.
Vickery, S.K., Dröge, C., Markland, R.R., 1993. Production competence and business strategy: do they affect business performance. Decision Sciences 24 (2), 435–456.
Ward, P.T., Leong, G.K., Boyer, K.K., 1994. Manufacturing proactiveness and performance. Decision Sciences 25 (3), 337–358.
Ward, P.T., Duray, R., Leong, G.K., Sum, C.-H., 1995. Business performance, operations strategy, and performance: an empirical study of Singapore manufacturers. Journal of Operations Management 13, 99–115.
Ward, P.T., Bickford, D.J., Leong, G.K., 1996. Configurations of manufacturing strategy, business strategy, environment and structure. Journal of Management 22 (4), 597–626.
Whybark, D.C., Vastag, G., 1993. Global Manufacturing Practices. Elsevier, New York, NY.