INTRODUCTION
One issue that has grown substantially in importance over the last decade, but still has not been touched much upon, is online marketing planning. 1 – 3 The fact that the online channel combines nearly all elements from traditional channels and even adds new dimensions 4 makes it necessary to further investigate how prioritisation of offl ine versus online marketing communications (OMC) should be conducted. The area of online business-to-business (B2B) marketing
communications (MARCOM) in particular seems to have been adopted quickly, with fi rms
spending 10 per cent of the total budget online compared to only 6 per cent of the B2C budgets. 5 Furthermore, existing prioritisation methods do not seem to satisfy the more holistic and ‘ below the line ’ approach of B2B marketing. 6 As integrated marketing communications (IMC) has extended beyond traditional media, the challenge of conceptual and directional guidance has grown, and research that makes it possible to explain B2B IMC is being specifi cally
requested. 7,8 A multitude of defi nitions of IMC have been brought forward that attempt to embrace the major defi nitions. The common characteristics appear to be the placement of the target audience at the core of the process and the treatment of all channels equally and neutrally, in realisation of the fact that it is the audience that drives the planning and selection process. 9 Adopting this audience-centric IMC perspective,
Correspondence: Morten Bach Jensen , GRUNDFOS Management A/S, Poul Due Jensens Vej 7,
DK-8850 Bjerringbro, Denmark.
Tel: + 45 87 50 14 00; Fax: + 45 87 50 14 60;
E-mail: [email protected]
promotion with conjoint analysis
Received (in revised form): 31st March, 2008
Morten Bach Jensen
is a Senior Business Researcher at the Danish industrial pump manufacturer Grundfos. Further, he is affi liated as an industrial PhD-fellow with both the IT University of Copenhagen, Aarhus School of Business, and Copenhagen Business School. Throughout the last 13 years, he has worked in marketing at larger industrial companies, in teaching and academia, as well as at a large consultancy fi rm. He holds a B.Sc. in Engineering and an M.Sc. in IT.
Keywords conjoint analysis , planning , marketing communication , IMC , B2B
Abstract Even though many people have been searching for the holy grail of holistic marketing
communication planning, no one seems to have succeeded. Communication planners are often left with data that only cover individual disciplines like advertising or with performance measures that cannot be deconstructed to a suffi ciently low level. In business-to-business (B2B) markets in
particular, where advertising is only a marginal part of the promotional mix, marketers must often rely on their instinct. This is only further complicated by the last decade ’ s diffusion of online
communication, which has added an entire new range of communication possibilities. This study builds on the premise that the target audiences ’ preferences for communication matter, and shows that conjoint analysis is an excellent tool for the measurement of such communication and channel preferences. The validation takes place in a B2B setting with specifi c focus on the prioritisation of offl ine versus online communication.
this paper offers a practical way for B2B marketers in particular to holistically prioritise and target OMC both within and across multiple communication activities. In doing this, one of the proposed future directions within conjoint analysis (CA), as proposed in Green and Srinivasan ’ s 10 major review, is discussed. The
method of using CA-derived preferences for holistic MARCOM planning and prioritisation, obvious as it may seem, has not been reported in any present published work. Using the
methodology for something as intangible and composite as MARCOM surely challenges the technique, as the major application areas of CA in the past have been new product development and price planning. 11 This paper uses empirical data collected in a B2B setting among heating and plumbing installers to validate the approach.
WHY CONJOINT ANALYSIS COULD
BE AN ALTERNATIVE
A pivotal part of any IMC planning process is the prioritisation of communication channels. 12 – 18 As OMC, to a fair extent, offers a duplicate of traditional channels, 4,19 the last decade ’ s fast adoption of the internet has further complicated prioritisation. B2B marketers in particular have not found much help in existing methods of quantitative media planning, since, fi rst, these methods cover above-the-line media using opportunities to see (OTS) as well as reach and frequency as planning criteria, and, secondly, they do not allow for comparisons to be made between different types of media, for example internet and print. 20,21
More than 40 years have passed since the infl uential research of Luce and Tukey 22 laid the groundwork for CA, and more than 30 years since the methodology started being adopted by marketing academics and practitioners; 23,24 however, there still seem to be unexplored application areas. Even the commercial usage of the method is restricted to a few applications. Wittink et al . 11 report on 1,000 commercial applications of CA over a fi ve-year period from 1986 to 1991, with pricing and new product development studies being the predominantly most popular. Also, Green and Srinivasan 10 point
to alternative areas where CA should be pursued, MARCOM planning and prioritisation being among these.
The logical reason for measuring marketing performance, and prioritising MARCOM in the fi rst place, is that resources are limited. Accepting the premise that consumers ’ preferences for communication matter, what then needs to be known is how consumer trade-offs affect various ways of fulfi lling different communication
activities. Even though these preferences might be hard to articulate directly, they may be revealed when choices among more attributes are forced. Hence the term ‘ conjoint ’ , which refers to measuring relative values of things considered jointly that might be immeasurable taken one at a time. As is the case with product choice
behaviour, 24 accepting the concept of IMC also means accepting that the attitude toward a brand ’ s communication is based on the entire
communication effort of the brand. For instance, individual measures of the two attributes, ‘ different ways of having contact with a brand ’ s sales representative ’ and ‘ different ways of receiving a brand ’ s technical documentation ’ would properly tell us the preferred channels (often the most expensive) of the two attributes without much surprise. It would, however, not tell us anything about how the attributes and their levels are conjoint. Further, some elements might only become more or less important when discussed and traded off in a highly specifi c context (conjointly). For instance, the level of ‘ technical advice ’ might be highly dependent on the level of ‘ technical documentation ’ .
As should be clear from the discussion above, traditional and simpler methods are inadequate for the identifi cation of preferences. Therefore, in line with Green and Srinivasan, 10 an attempt is made
in this paper to validate the usage of CA for holistic MARCOM prioritisation.
METHOD AND DATA COLLECTION
Where traditional methods are limited to about six attributes, ACA can handle more than ten attributes. 10 ACA must, however, be
computer-administered as the questions are customised to the respondent. Questioning is, in this fashion, conducted in an ‘ intelligent ’ way; the respondent ’ s utilities are continually re-estimated as the interview progresses, and each question is chosen to provide the most additional information, given what is already known about the respondent ’ s values.
As the usage of CA for prioritisation of MARCOM should not be limited to a few activities (attributes), and because the intangibility of MARCOM compared to a physical product could further limit the number of attributes that can be handled at once, ACA was preferred. When conducting CA, not only the choice of data collection model, stimulus presentation and measurement scale are of importance, but also the estimation method. 10,27 Even though Wittink et al . 11 show that OLS (Ordinary Least Squares) is the most popular estimation technique, substantial evidence proves that HB (Hierarchical Bayes) outperforms OLS. The ACA and HB combination improves the stability of the individual estimates by ‘ borrowing ’ information from other individuals. This use of prior information has shown excellent performance improvements within various CA methods, 28,29 as well as specifi cally within ACA. 30 Therefore, the combination of ACA and HB is chosen as the preferred technique.
The world ’ s second largest pump (circulator) manufacturer, Grundfos, (www.grundfos.com) focuses its main business area on pumps for building services. Typically, the products are purchased and installed by a plumbing and heating installer through a wholesaler. Keeping the objective of this paper in mind, namely to prioritise offl ine versus OMC in a B2B context, Grundfos has kindly allowed its brand to be used for CA evaluation in its home market, Denmark. The fact that the brand has 100 per cent
awareness in the market and that the diversity of MARCOM elements is relatively high, as well as the general heavy adoption of the internet in Denmark, 31 made this opportunity an obvious
choice.
Anttila et al. 32 stress the importance of the
determination of attributes and levels as being essential to the reliability of the results. They further point out different quantitative techniques. To ensure proper face validity, attributes and levels were in this case derived through a four-step qualitative process resulting in a questionnaire including ten ratings and ten important questions, as well as 15 conjoint pairs questions each with a maximum of two attributes. The attributes and levels are shown in Table 1 (translated from Danish). The design with ten attributes each with four levels gives the possibility of simulating more than 1 million (4 10 ) alternative combinations. Even though there is no online option for the attribute ‘ events ’ , it is included because it counts for a major part of the company ’ s budget. For the attribute ‘ Information at the wholesaler ’ , the online option could rather be categorised as digital, but is, as the events attribute, included due to importance for the target audience. The data collection and the results of the survey are presented in the following section.
RESULTS
The sample was randomly selected from a customer database made available by Grundfos. Only plumbing and heating installers were selected, as the database, containing more than 4,500 entries, also included electricians. Telephone contact was attempted with a total of 637
companies between June and August 2006. Among these, 40 companies were not within the target audience, ten were not interested in participating, and 18 did not use e-mail. In the case of 369 companies, the right contact person was unavailable for various reasons. The remaining 200 companies accepted participating in the survey, and after having been briefed in detail, an e-mail with further instructions and a link to the survey was forwarded. The last bulk of e-mails was sent off on 2nd August and the survey was terminated on 22nd August. A total of 148 respondents took part in the survey, 130 of whom completed it. Only the completed answers were used. An incentive was offered for due completion of the survey, namely two cinema tickets.
Table 1 : Attribute importances and level utility values
Attributes/levels Relative importance/ utility value
SE Offl ine to online Offl ine to combo
Advertisements 8.20% − 2.6 − 0.1
Trade journals 2.5 0.22
Internet − 0.1 0.2
Trade journals and internet 2.4 0.18
No advertisements − 4.9 0.28
Contact with salesman 10.00% − 4.9 − 1.0
Physical meeting 4.0 0.26
E-mail or internet chat − 0.9 0.22
Meeting and e-mail/chat 2.9 0.18
No contact with salesman − 6.0 0.26
Training 9.8% − 6.0 − 1.9
Training at the ‘ pump school ’ 4.6 0.2.0
Web-based training − 1.3 0.17
Pump school and web-based training 2.8 0.12
No training − 6,1 0.17
Information at the wholesaler 7.6% − 0.9 0.9
Posters and folders 1.5 0.20
PC at the wholesaler 0.6 0.16
Posters/folders and PC 2.4 0.17
No info at the wholesaler − 4.5 0.29
Technical advice 13.8% − 6.4 − 1.2
Telephone 5.6 0.24
E-mail or internet chat − 0.8 0.18
Telephone and e-mail/internet chat 4.5 0.16
No technical advice − 9.3 0.23
Sales brochures 9.4% − 2.9 0.1
Printed 2.9 0.30
Internet 0 0.22
Printed and internet 2.9 0.16
No sales brochures − 5.8 0.24
Contact with other installers 8.1% − 4.9 − 2.6
Seminars and meeting 3.9 0.23
E-mail or internet forums − 0.9 0.15
Seminars/meeting and e-mail/forums 1.3 0.18
No contact with other installers − 4.3 0.28
Newsletters 9.3% − 1.2 − 0.1
Postal 2.5 0.26
E-mail 1.3 0.22
Postal and e-mail 2.4 0.15
No newsletters − 6.2 0.20
Events 10.3%
Trade fairs 1.1 0.22
Breakfast and counter seminars 3.1 0.24
Trade fairs and breakfast/counter seminars 2.5 0.18
No events − 6.7 0.28
Technical documentation 13.6% − 1.0 2.3
Printed 2.7 0.22
Internet 1.7 0.24
Printed and internet 5.0 0.23
answering times of more than 1 h), the average time used on the survey was 18 min. The
sample size was deliberately kept relatively low. In order for the methodology to be implementable in B2B companies like Grundfos, it would likely often have to be replicated in multiple markets and market segments, where, naturally, the sample size would be a fi nancial barrier. On the other hand, the possibility of conducting segmentation particularly sets requirements on sample size. Akaah and Korgaonkar 33 argue that
small sample sizes (below 100 respondents) are typical for conjoint studies. This is exemplifi ed in the following CA segmentation studies: Koo et al. 34 use CA for preferential segmentation of
restaurant attributes; their study, which includes 86 respondents, succeeds in clustering data into three segments. Arias 35 uses preferential
segmentation in the design of a new fi nancial service and clusters 98 respondents into two groups. Lonial et al. 36 study preferences for
personal computers and cluster 81 respondents into three clusters. Bech-Larsen and Skytte 37 use
84 respondents for utility segmentation into four clusters in the industrial market for food
commodities. Naturally, studies with far larger sample sizes can also be found. For example, Johnson 24 uses 991 interviews to conduct their CA-based segmentation on the Australian wine market. Smaller sample sizes, however, have proven to be legitimate for CA studies, even when used for segmentation. As discussed above, the acquisition of respondents in the present case was ended when 200 companies had initially agreed to participate, which fi nally resulted in 130 respondents.
Both the qualitative test mentioned previously and the execution of the survey, with a 65 per cent completion rate as well as relatively low utility value standard errors, indicate that the respondents did not have signifi cant trouble answering the survey, even in consideration of the intangible and composite nature of MARCOM.
Below, the general results and the usage of these for overall online versus offl ine prioritisation is discussed. This is followed by presentation and discussion of the preferential segmentation outcome.
Online versus offl ine
MARCOM prioritisation
Table 1 shows the relative importances of the ten attributes as well as the utility values of the levels. The utility values are graphically displayed in Figure 1 , giving a fast overview for the planner. From a MARCOM planning standpoint, the following conclusion could be drawn. First, the relatively even distribution of relative importances supports a general IMC approach and the use of a wide range of communications activities. Technical advice and technical documentation are the two most important activities (27.4 per cent), whereas information at the wholesaler and contact with other installers are the two least favourable ones (15.7 per cent). Judging from the target audience, which consisted of chief installers and / or owners, this does not come as a surprise, as they use more time doing desk work and planning installations than the pure in-fi eld installer. It, however, emphasises the importance of the internal sales and marketing organisation compared to the external organisation. Secondly, it is observed ( Table 1 column four) that the online channel will always have less preference than the offl ine channel; however, it might still make sense to switch over to the online when the fi nancial benefi ts are
substantial. Also, the fact that activities such as newsletters and technical documentation only pose marginal utility value loss, whereas others such as technical advice and training show substantial differences, indicates where the online channel might be an obvious option.
Somewhat surprisingly, the combination option ( Table 1 column fi ve), with the exception of a few activities, also shows lower values than the pure offl ine option. This way of prioritising was fi rst observed during the qualitative validation, where the respondents argued that even though the online channel was added for ‘ free ’ , they were concerned that it might result in less focus on the offl ine channel. This behaviour can be compared with being faced with choosing between a pure DVD player and a pure VHS player, or a
fi eld where the combination option has a positive effect is technical documentation; here, the target audience values the option of having both the
regular printed binder with datasheets and such, as well as the option of more advanced
calculation and search options online. Advertisements
Trade journals Internet Trade journals and internet
Physical meeting E-mail or internet chat
Web based training Pump school and web based training
Posters and folders PC at the wholesaler
Printed Internet Printed & internet No sales brochures
Contact with other installers
Postal E-mail Postal and e-mail No newsletters
As mentioned above, the combination of ten attributes, each with four levels, provides the possibility of simulating more than one million alternatives. Table 2 shows six such simulations. To ease the understanding of the simulations, the utility values have been scaled in such a way that the distance between the worst and best case scenarios is 100 utility points. The numbers in Table 2 thus indicate that the scenario of moving to the online channel within all activities would reduce the overall preference level with 34 per cent compared to best case, and with 30 per cent compared to purely using the offl ine channel, a drastic and risky move that cannot be recommended. Taking the 95 per cent confi dence intervals into consideration, it can further be observed that there are no signifi cant overall differences in preferences within the best case, all offl ine, all combo, and all offl ine except technical documentation and newsletters simulations. This puts further emphasis on the notion that technical documentation and newsletters might be areas worth considering for the use of the online channel. Moreover, it can be concluded that both the use of online communication on its own and the
‘ upgrading ’ for a combination solution must be evaluated carefully and either used on specifi c activates (technical documentation and newsletters) or directed towards specifi c segments of online adopters. The following section reports on the possible use of the data for such preferential segmentation.
Preferential segmentation
Instead of using surrogate measures, conjoint data are uniquely suited to preferential segmentation,
as it is micro-based and a direct measure of the individual respondent ’ s preferences. 38 The segmentation was done as post hoc segmentation, meaning that the preference heterogeneity decided the clustering, and not any a priori
defi ned variables. The two-step cluster component that automatically fi nds the optimal number of clusters was applied. 39 A priori segmentation on key background data, as also described by Green and Krieger, 38 was also attempted. As
segmentation variables, the utility values of the 40 levels were used; another approach would have been using the ten attribute importances, which gives the statistical advantage of less clustering variables. As the purpose was to detect
heterogeneity not only on activity level but also mainly in channel preferences, however, this was not a real option.
Both Schwarz ’ s Baysian Criterion (BIC) and Akaike ’ s Information Criterion (AIC) were tested as clustering criteria. Both algorithms used all 130 respondents in their clustering, which emphasised the quality of the data set. The AIC algorithm came up with a three-cluster solution and the BIC algorithm with a two-cluster solution. Based on evaluation of the variables ’ overlap in
confi dence interval (discrimination) and the theoretical relevance of the cluster, the BIC clustering was found most suitable. The clustering resulted in an ‘ online adopters ’ segment consisting of 60 per cent of the sample (77 respondents) and an ‘ offl ine retainers ’ segment comprising approximately 40 per cent of the sample (53 respondents). Attribute importances and utility values for the two clusters are shown in Table 3 ; the gain in utility value by going either from offl ine to online or from offl ine to both channels is also shown. Asterisks on the levels denote the level of signifi cant discrimination between the two clusters ( * p < 0.05, * * p < 0.01, * * * p < 0.001). The test of means was done using independent-samples t -test and based on
signifi cance of Levene ’ s test for equality of variances ( p < 0.05), the test was carried out assuming either equal variances or nonequal variances. All attributes included signifi cantly different levels, with a total of 27 levels being discriminated.
Table 2 : Total simulations of utility values
95per cent confi dence interval Mean Lower Upper
Worst case − 63 − 68 − 58
Best case 37 32 41
All offl ine (+seminar) 33 29 38
All combo 29 26 33
All offl ine except technical
documentation and newsletters
31 27 36
Table 3 : Attribute importances and level utility values for the two-cluster solution
Online adopters Offl ine retainers Attributes/levels Importance/
utilities
Offl ine to online
Offl ine to combo
Importance/ utilities
Offl ine to online
Offl ine to combo
Advertisements 7.9% − 0.6 1.2 8.6% − 5.5 − 2.1
Trade journals *** 1.2 4.5
Internet *** 0.6 − 1.1
Trade journals and internet 2.4 2.3
No advertisements * − 4.3 − 5.7
Contact with salesman 10.2% − 2.3 0.4 9.7% − 8.7 − 3.1
Physical meeting *** 2.6 6.0
E-mail or internet chat *** 0.3 − 2.7
Meeting and e-mail/chat 3.0 2.9
No contact with salesman − 5.8 − 6.2
Training 9.6% − 4.0 − 0.8 10.0% − 8.8 − 3.4
Training at the ‘ pump school ’ *** 3.5 6.2
Web-based training *** − 0.5 − 2.5
Pump school and web-based training 2.7 2.8
No training * − 5.8 − 6.5
Information at the wholesaler 7.5% − 0.2 1.6 7.7% − 1.9 − 0.1
Posters and folders *** 0.7 2.7
PC at the wholesaler 0.5 0.8
Posters/folders and PC 2.3 2.5
No info at the wholesaler *** − 3.5 − 6.0
Technical advice 13.9% − 3.8 0.4 13.8% − 10.3 − 3.4
Telephone *** 4.1 7.8
E-mail or internet chat *** 0.3 − 2.4
Telephone and e-mail/internet chat 4.5 4.4
No technical advise − 9.0 − 9.8
Sales brochures 9.1% 0.5 1.6 9.7% − 7.9 − 2.9
Printed *** 0,8 5.8
Internet *** 1,4 − 2.1
Printed and internet 2,9 2.9
No sales brochures *** − 5,2 − 6.6
Contact with other installers 7.8% − 3.5 0.4 8.5% − 6.8 − 4.4
Seminars and meeting * 2.9 5.5
E-mail or internet forums *** − 0.7 − 1.3
Seminars/meeting and e-mail/forums 1.5 1.1
No contact with other installers *** − 3.7 − 5.2
Newsletters 9.1% − 1.9 − 0.4 9.7% − 5.6 − 2.4
Postal *** 0.7 5.1
E-mail *** 2.6 − 0.5
Postal and e-mail 2.2 2.7
No newsletters *** − 5.5 − 7.3
Events 9.9% 10.9%
Trade fairs *** 0.3 2.3
Breakfast and counter seminars 3.1 3.0
Trade fairs and breakfast/counter seminars ***
2.0 3.4
No events *** − 5.4 − 8.7
Technical documentation 15.0% − 1.4 2.8 11.4% − 4.5 − 0.4
Printed *** 1.4 4.7
Internet *** 2.8 0.2
Printed and internet *** 5.6 4.3
No technical documentation − 9.8 − 9.2
Looking at the utility value difference in the two clusters between the online and offl ine channels, it immediately becomes apparent that this is where the two segments are discriminated. Whereas the ‘ offl ine retainers ’ segment has differences of more than ten utility points, the maximum difference for the ‘ online adopters ’ is 3.8. Something else of note is that the ‘ online adopters ’ in general are positive towards the combination solutions, whereas ‘ offl ine retainers ’ always prefer the pure offl ine channel.
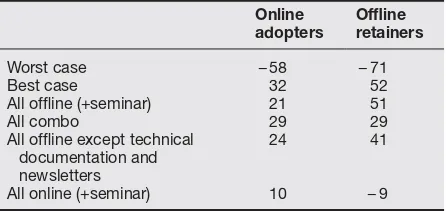
The total simulations of the two clusters are shown in Table 4 . What initially springs to mind is the difference in the distance between the best and worst case simulations; ‘ online adopters ’ have a range of 90 points, whereas ‘ offl ine retainers ’ have a range of 123 utility points. Comparing this to the number for the entire sample (100), it can be surmised that ‘ online adopters ’ in general are less preferential / critical to the way
communication is delivered, whereas ‘ offl ine retainers ’ are more critical. Further, it is noted that if ‘ offl ine retainers ’ were to go from best case to only using online channels, their preference drop would equal 49 per cent (61 / 123), whereas ‘ online adopters ’ would only encounter a preference loss of 24 per cent (22 / 90). A third observation is that ‘ online adopters ’ in fact prefer the combination solution to the pure offl ine solution, whereas this is defi nitely not the case for the ‘ offl ine retainers ’ .
To be able to specify the segments, the following background data were collected: age, daily use of the internet, importance of the internet, company size, geographical work area,
loyalty to the brand, application that the brand is used within and type of installation that the brand is used for (new buildings or replacements, etc). Only four criteria, however, were
signifi cantly different at a minimum of the 0.9 level; these include company size ( p = 0.016), geographical work area ( p = 0.064), daily use of the internet ( p = 0.021) and age ( p = 0.059). This pattern is supported by Moore, 40 who found that
background variables do not necessarily correlate well with attitude preferences. Based on both the conjoint data and the background data that were signifi cant, however, the following segment descriptions can be summarised.
Online adopters
Primarily installers below 50 (68 per cent). Larger companies (49 per cent with more than ten employees).
Primarily work in mainland Denmark (61 per cent in Jutland).
Typically use the internet for more than 1 h a day (62 per cent).
Technical documentation is the most
importance attribute that should be delivered both offl ine and online or only online. Are less preferential / critical than average towards the way that communication is delivered.
Offl ine retainers
To a large extent older installers above the age of 50 (45 per cent).
Smaller companies (68 per cent with fewer than ten employees).
Typically work on capital island Denmark (61 per cent in Zealand and Copenhagen). Typically use the internet for less than 1 h a day (64 per cent).
Technical advice is the most important attribute that should be offl ine and defi nitely not online.
Are more preferential / critical than average towards the way that communication is provided.
— —
—
—
—
—
—
—
—
—
—
—
Table 4 : Totals of simulations of utility values for two-cluster solution
Online adopters
Offl ine retainers
Worst case − 58 − 71
Best case 32 52
All offl ine (+seminar) 21 51
All combo 29 29
All offl ine except technical documentation and newsletters
24 41
To make the segments more operational, an a priori segmentation on age (above and below 50), number of employees (above and below, more or less than ten) and geographical work area (Jutland or Zealand) was conducted. None of the criteria, however, provided suffi cient discrimination: geography only signifi cantly differed on fi ve levels within four attributes, number of employees only on two levels within two attributes and number of employees only on fi ve levels within four attributes. This only further emphasises the importance of using post hoc segmentation, but at the same time also the need for more and better background data to make the segmentation operational.
CONCLUSION AND IMPLICATIONS
Within academia as well as among marketers, it would be diffi cult to fi nd disagreement regarding the value of a data-driven method that would solve the task of holistic IMC prioritisation. Only time will tell whether this paper describes such a ‘ holy grail ’ ; however, what is certain is that the paper, based on the recommendations of Green and Srinivasan, 10 describes and validates yet
another new application area for CA. And, in the particular context, namely a B2B setting with particular focus on the prioritisation on online versus offl ine channels, it does to a fair extent solve the problem of communication channel prioritisation. It is shown that with a thoroughly qualitative process of validating and testing attributes, levels and question phrasing, ACA can be used for the measurement of MARCOM, in spite of its intangible and composite nature. Further, the opportunity to simulate the total preference utility value of all possible alternatives, within the defi ned levels, serves as a precise and fact-based prioritisation tool. Moreover, the graphical representation possibilities of conjoint data, as well as the option to calculate delta values between levels, give a clear idea for where for example the online channel could be an obvious option. An apparent improvement would be to enrich the data with average cost data of the different channels and channel combinations, and thereby make the prioritisation decision even more solid. The opportunity to conduct
preferential segmentation based on individual data further utilises the data and gives the possibility of targeting communication activities and channels. As it was shown, however, there is a need for more background data to further operationalise the segmentation.
Planners of MARCOM and communications channels are currently left with inadequate methods and data when planning holistically, which is only further emphasised by the diffusion of online communication. In a B2B setting, where the usage of different communication activities is often widespread and where
advertising only constitutes a marginal portion of the mix, the planner must to a fair extent rely on instinct. Usage of CA-based preference
measurement and preferential segmentation is a promising tool that can move the holistic planning process further towards fact-based decisions, a criterion that most industrial fi rms require of most decisions made outside of marketing. Of course, this presupposes that the demand-side and preference-based approach is accepted as a valid metric, that is, that media and channels have value through the constituents of the communication having preferences and that their fi nal relations towards a product or brand can be linked to these preferences. Finally, research on this aspect, as well as further validation of CA for MARCOM prioritisation within other markets and industry settings, is kindly invited.
References
1 Krishnamurthy , S . ( 2006 ) ‘ Introducing E-MARKPLAN: A practical methodology to plan e-marketing activities ’ , Business Horizons , Vol. 49 , No. 1 , pp. 51 – 60 .
2 Krishnamurthy , S . and Singh , N . ( 2005 ) ‘ The international e-marketing framework (IEMF): Identifying the building blocks for future global e-marketing research ’ , International Marketing Review , Vol. 22 , No. 6 , pp. 605 – 610 .
3 Sheth , J . N . and Arma , A . ( 2005 ) ‘ International e-marketing: Opportunities and issues ’ , International Marketing Review , Vol. 22 , No. 6 , pp. 611 – 622 .
4 Hoffman , D . L . and Novak , T . P . ( 1996 ) ‘ Marketing in hypermedia computer-mediated environments: Conceptual foundations ’ , Journal of Marketing , Vol. 60 , No. 3 , pp. 50 – 68 . 5 Barwise , P . and Farley , J . U . ( 2005 ) ‘ The state of interactive
6 Jensen , M . B . ( 2006 ) ‘ Characteristics of B2B adoption and planning of online marketing communications ’ , Journal of Targeting, Measurement & Analysis for Marketing , Vol. 14 , No. 4 , pp. 357 – 368 .
7 Cook , W . A . ( 2004 ) ‘ Editorial: IMC’s fuzzy picture: Breakthrough or breakdown? ’ , Journal of Advertising Research , Vol. 44 , No. 1 , pp. 1 – 2 .
8 Rust , R . T . , Ambler , T . , Carpenter , G . S . , Kumar , V . and Srivastava , R . K . ( 2004 ) ‘ Measuring marketing productivity: Current knowledge and future directions ’ , Journal of Marketing , Vol. 68 , No. 4 , pp. 76 – 89 .
9 Kliatchko , J . ( 2005 ) ‘ Towards a new defi nition of integrated marketing communications (IMC) ’ , International Journal of Advertising , Vol. 24 , No. 1 , pp. 7 – 34 .
10 Green , P . E . and Srinivasan , V . ( 1990 ) ‘ Conjoint analysis in marketing: New developments with implications for research and practice ’ , Journal of Marketing , Vol. 54 , No. 4 , pp. 3 – 20 .
11 Wittink , D . R . , Vriens , M . and Burhenne , W . ( 1994 ) ‘ Commercial use of conjoint analysis in Europe: Results and critical refl ections ’ , International Journal of Research in Marketing , Vol. 11 , No. 1 , pp. 41 – 52 .
12 Pickton , D . and Broderick , A . ( 2004 ) ‘ Integrated Marketing Communications ’ , Pearson Higher Education, London . 13 Kitchen , P . J . and de Pelsmacker , P . ( 2004 ) ‘ Integrated Marketing
Communication: A Primer ’ , Taylor & Francis Ltd, London . 14 Kitchen , P . J . ( 1999 ) ‘ Marketing Communications Principles
and Practice ’ , International Thomson Business Press, London .
15 Belch , G . E . and Belch , M . A . ( 2004 ) ‘ Advertising and Promotion an Integrated Marketing Communications Perspective ’ , McGraw-Hill, Boston .
16 Duncan , T . ( 2002 ) ‘ IMC Using Advertising and Promotion to Build Brands ’ , McGraw-Hill, London .
17 Delozier , M . W . ( 1978 ) ‘ Marketing Communications Process ’ , McGraw-Hill, London .
18 Pelsmacker , P . D . , Geuens , M . and Van den Bergh , J . ( 2001 ) ‘ Marketing Communications ’ , Financial Times Prentice Hall, London .
19 Jensen , M . B . and Jepsen , A . L . ( 2006 ) ‘ Online marketing communications: Need for a new typology for IMC? ’ , in Podnar, K. and Jancic, Z. (eds), ‘ Comtemporary Issues in Corporate and Marketing Communications: Towards a Socially Responsible Future ’ , Pristop, Ljubljana, Slovenia .
20 Hansen , F . , Bach Lauritsen , G . and Gr ø nholdt , L . ( 2001 ) ‘ Communication and Media Planning (Kommunikation, mediaplanl æ gning og reklamestyring. Bind 1 metoder og modeller) ’ , Samfundslitteratur, Copenhagen .
21 Leckenby , J . D . and Kuen-Hee , Ju . ( 1989 ) ‘ Advances in media decision models ’ , Current Issues & Research in Advertising , Vol. 12 , No. 2 , pp. 311 – 358 .
22 Luce , R . D . and Tukey , J . ( 1964 ) ‘ Simultaneous conjoint measurement: A new type of fundamental measurement ’ , Journal of Mathematical Psychology , Vol. 1 (February) , pp. 1 – 27 .
23 Green , P . E . and Rao , V . R . ( 1971 ) ‘ Conjoint measurement for quantifying judgmental data ’ , Journal of Marketing Research (JMR) , Vol. 8 , No. 3 , pp. 355 – 363 .
24 Johnson , R . M . ( 1974 ) ‘ Trade-off analysis of consumer values ’ ,
Journal of Marketing Research (JMR) , Vol. 11 , No. 2 , pp. 121 – 127 . 25 Johnson , R . M . ( 1987 ) ‘ Adaptive conjoint analysis ’ , in ‘ Sawtooth
Software Conference on Perceptual Mapping, Conjoint Analysis, and Computer Interviewing ’ , Sawtooth Software, US .
26 Green , P . E . ( 1984 ) ‘ Hybrid models for conjoint analysis: An expository review ’ , Journal of Marketing Research (JMR) , Vol. 21 , No. 2 , pp. 155 – 169 .
27 Green , P . E . and Srinivasan , V . ( 1978 ) ‘ Conjoint analysis in consumer research: Issues and outlook ’ , Journal of Consumer Research , Vol. 5 , No. 2 , pp. 103 – 124 .
28 Allenby , G . M . , Arora , N . and Ginter , J . L . ( 1995 ) ‘ Incorporating prior knowledge into the analysis of conjoint studies ’ , Journal of Marketing Research (JMR) , Vol. 32 , No. 2 , pp. 152 – 162 .
29 Lenk , P . J . , Desarbo , W . S . , Green , P . E . and Young , M . R . ( 1996 ) ‘ Hierarchical bayes conjoint analysis: Recovery of partworth heterogeneity from reduced experimental design ’ , Marketing Science , Vol. 15 , No. 2 , pp. 173 – 191 .
30 Sawtooth Software. ( 2006 ) ‘ The ACA/Hierarchical Bayes v3.0 technical paper .
31 European Competitive Telecommunications Association ( 2006 ) ‘ Broadband penetration in EU: The haves and the haves not ’ , Vol. 2006, No. 11/3 , http://www.ectaportal.com/en/upload/ File/Broadband%20Scorecards/Q106/FINAL%20BB%20ScQ106 %20Press%20release%20Sept%2006.pdf .
32 Anttila , M . , van den Heuvel , R . and Moller , K . ( 1980 ) ‘ Conjoint measurement for marketing management ’ , European Journal of Marketing , Vol. 14 , No. 7 , pp. 397 – 408 .
33 Akaah , I . P . and Korgaonkar , P . K . ( 1988 ) ‘ A conjoint investigation of the relative importance of risk relievers in direct marketing ’ ,
Journal of Advertising Research , Vol. 28 , No. 4 , pp. 38 – 44 . 34 Koo , L . C . , Tao , F . K . C . and Yeung , J . H . C . ( 1999 ) ‘ Preferential
segmentation of restaurant attributes through conjoint analysis ’ ,
International Journal of Contemporary Hospitality Management , Vol. 11 , No. 5 , pp. 242 – 250 .
35 Arias , J . T . G . ( 1996 ) ‘ Conjoint-based preferential segmentation in the design of a new fi nancial service ’ , International Journal of Bank Marketing , Vol. 14 , No. 3 , pp. 30 – 32 .
36 Lonial , S . , Menezes , D . and Zaim , S . ( 2000 ) ‘ Identifying purchase driving attributes and market segments for PCs using conjoint and cluster analysis ’ , Journal of Economic & Social Research , Vol. 2 , No. 2 , pp. 19 – 37 .
37 Bech-Larsen , T . and Skytte , H . ( 1998 ) ‘ Segmentation of the industrial market for food commodities: A conjoint-study of purchase of vegetable oils in the mayonnaise and margarine industries , MAPP Working Paper No. 54, Aarhus, Denmark , pp. 1 – 21 .
38 Green , P . E . and Krieger , A . M . ( 1991 ) ‘ Segmenting markets with conjoint analysis ’ , Journal of Marketing , Vol. 55 , No. 4 , pp. 20 – 31 . 39 SPSS ( 2001 ) ‘ The SPSS TwoStep cluster component ’ ,
Unpublished, retrieved 6th December, 2006, http://www.spss. ch/upload/1122644952_The%20SPSS%20TwoStep%20Cluster%2 0Component.pdf?PHPSESSID=d891c70fbf53e980e540a8beabed 2b8b .