September 9-11, 2015, Banda Aceh, Indonesia
137
Microstructure and Optimization of Sweet Potato-Rice
Simulated Chips
1*Adil Basuki Ahza, 1M. Arief Munandar, and 1Subarna Suryatman
1Dept. Food Science and Technology. Faculty of Agricultural Engineering & Technology.
Bogor Agricultural University. Bogor 16680, Indonesia;
*Corresponding Author: [email protected]
Abstract
Optimization of formula, baking and frying condition, and microstructure of sweet potato - rice simulated chips were studied using a completely randomized factorial design based on its physical, chemical and sensorial characteristics. The formulas were enriched with a mixture of skim milk, carrots, celery and temurui leaf powders to enhance its functional properties. Parameters to measure chips quality include color, texture, moisture content, ash content, protein content, fat content, carbohydrate, and hedonic ratings of sensory analysis. The result showed that fried simulated chips tend to be more preferable compared to the baked simulated chips. Fried simulated chips were generally slightly darker than the baked chips. Both fried and baked simulated chips’ colors were dark yellow. The high temperature frying produced finer microstructure and massive gelatinization of the fried chips. The optimum formula and cooking process of simulated chip was obtained from sweet potato-rice simulated chips with ratio of 60:40 fried at 160°C for 1minute; and the sweet potato: rice with ratio of 80:20, baked at 180°C for 8 minutes. Best fried simulated chip color was dark yellow, with its brightness values(L) 46.77±0.00, yellowness value(a) +4.83±0.01, redness value(b) +34.40±0.06, hardness 827.77±43.78gf, moisture content 2.95 ± 0.28%(db), ash content 1.95±0.08%(db), protein content 3.07±0.13%(db), fat content 28.01±0.40%(db), and carbohydrate content 64.02±0.07%(db). Panelists tended to prefer the fried simulated chips with an overall score of 5.37±1.24c. While the best baked simulated chips color was dark yellow,
with brightness values(L) 69.31±0.01, yellowness(a) +1.04±0.00, redness(b) +29.96±0.02, hardness 382.97±43.66gf, moisture content 2.37±0.76%(db), ash content 3.07±0.11%(db), protein content 4.09±0.00%(db), fat content 1.67±0.25%(db) and carbohydrate
138
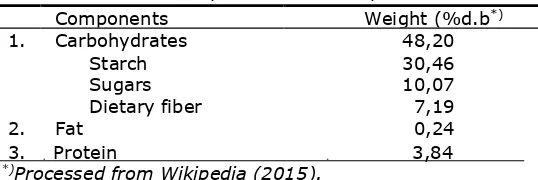
Materials and MethodsMain materials for simulated chips making such as commercial white Cimanggu var. sweet potato, low grade white rice, carrot, celery and skim milk (Cronecow) were obtained from local suppliers in Bogor city. While temurui leaves were harvested from cultivated yard. Uniformity of the raw materials for this research was maintained by way of using the same origin, size, color and weight, except the temurui leaves which were used only the number 3 up to 15 leaves stems from the tip. All the chemicals for analyses, e.g. HCl, NaOH, H2SO4, H3BO3, n-Hexane, ethanol, etc., including phenolphtalein indicators were purchased from the local chemical store with p.a. grade specifications of Mercx brand. Equipments for simulated chips making and its chemical and physical property analyses include pilot-plant scale steamer(Armfield®), grinder(Rhenighaus®, EVE/ALL-12,#5081), dough sheeter(Leader Baker®), molder, baking oven, deep-fat fryer(Cecilware®), pin disc mill(ZS- A300,Phoenix®), centrifuge, drum dryer(Simon Dryers®), freeze dryer(Eyela®, FDU-1100), Wiley mill(Thomas®), texture analyzer(TA-XT2, SMS®), chromameter(Minolta®, CR-310), SEM(Jeol® JSMType 53101v), Soxhlet apparatus, Kjeldahl apparatus, analytical balance.
Procedure
Process flow chart of this simulated chips research and experimental design were presented in Figure 1, wherein the dough mix of sweet potato-rice mix were prepared from steamed sweet potato and sweet potato flour with proportion of 65:35 (w/w) based on trial and error to produce manageable dough and, variable proportions of sweet potato dough: rice flour were 60:40, 70:30 and 80:20% based on solid basis. Addition of functional powders were maintained constant, calculated as solid based percentage from the dough mixes, i.e skim milk, carrot, celery and temurui powders at 10%, 5%, 0.5% and 0.5% respectively.
Textural analysis of the simulated chips were carried out according to the Manual of Lloyd Material Testing (2012) on texture analyzer using spherical ball probe (0.25 inch dia.) with constant pre-test, rupture test and post-test speed of 1.0 mm/sec, at deformation distance 5.0mm, 10g force for 5 seconds.
Simulated chip’s colors were analyzed according to Hutching methods (Hutching, 1999). Proximate analyses were undertaken using standardized methods (AOAC, 1999), i.e. moisture (AOAC methods 925.10 1995), ash content (AOAC 923.03 1995), fat content (AOAC 920.85 1995), protein content (AOAC 960.52 1995), carbohydrate (by difference). While, the microstructure were evaluated based on photomicrography using Scanning Electron Microscope method (LIPI, 2009), and the sensorial characteristics of the plain chips were evaluated using hedonic rating methods (SNI 01-2346-2006).
September 9-11, 2015, Banda Aceh, Indonesia preliminary research that to achieve good consistency of sweet potato-rice mix’s dough that is easy to handle, reduced material loss, and facilitate further processing steps, an addition of sweet potato flour was necessary. Otherwise, the sweet potato dough would be too sticky and hard to handle. The reason is because sweet potato, especially Cimanggu variety contains high moisture content that causes it hard to achieve optimum consistency for further processing steps.
Color
Objective tests of color and texture were used to select the acceptable products, which were brightest and less chromaticity both yellowness (a value) and redness (b value) of the sweet potato-rice simulated chips. Sensorial characteristics of the final product of simulated chips were used as the basis to obtain the most acceptable formula and final cooking processes. Analyses of variance
(Univariate ANOVA) showed that the color of sweet potato-rice simulated chips, in general, were
affected by the interaction between formula and cooking process (p<0.05). Increased proportion of sweet potato in the simulated chip’s formula tended to decrease the lightness and yellowness (a- value), and increased redness (b values) of the baked simulated chips. Duncan Multiple Range Test (DMTS) also confirmed further that temperature increased significantly darken the color of the chips. These trends were observed on simulated chips made from cassava-rice mix (Ahza, et al., 2014). Obviously that increased in the proportion of sweet potato and temperature of tended to intensify both browning and Maillard reactions and hence darken the color of the baked chips as was also observed in some other fried and baked products (Das, et al., 2013; Kotsiou, et al., 2013). This research also showed that increased in baking temperature, even at shorter time than the lower temperature, significantly decreased (p<0.05) the lightness value of the baked chips, and significantly increased the chromaticity (p<0.05), both yellowness (a value) and redness (b value), of the baked simulated chips. The fried sweet potato-rice simulated chips were generally dark yellow which were significantly influenced by interaction of formula and cooking process (p<0.05). In this case, increased in frying temperature combined with short temperature significantly improved the color of fried sweet potato- rice simulated chips (p<0.05). Analysis of variance and DMRT showed that combination of short time– high temperature of frying decreased significantly the yellowness (a values) and redness (b values) of the chips (p<0.05).
Texture
Hardness of the baked sweet potato-rice simulated chips was ranged from 382.98+43.66gf to 675.60+33.72gf, while the range of hardness of the fried chips was from 470.32+16.54gf to 1173.30+187.10gf. ANOVA and DMRT of sweets potato-rice textures showed that there were significant effects on hardness due to interactions between formula and cooking process (p<0.05). There was a significant effect of formula on the hardness of both the baked and the fried chips where generally the higher the proportion of sweet potato the higher the hardness of the sweet potato-rice simulated chips, and the higher the temperature of cooking the crispier the chips (p<0.05). The effects were internal structure of the chips with the increased of temperature (Saeleaw, et al., 2011).
Chemical characteristics
140
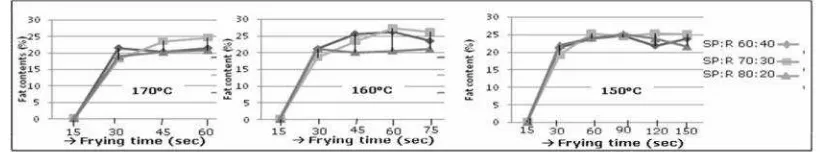
cooking process (p>0.05). The protein content of sweet potato-rice chips only significantly affected by the formula, i.e. the lower proportion of sweet potato significantly increased the protein content of the chips due to the protein contribution of rice (p<0.05). The fat contents of simulated chips were varies from 1.28+0.01% to 2.26+0.74% in the baked chips and from 24.20+0.24% to 29.38+0.18% in the fried chips. There was no significant effect of formula and temperature on the fat contents of baked simulated chips (p>0.05). Interactions between formula and cooking temperature were significantly affected the fat contents of fried chips (p<0.05) where the higher the sweet potato contents the higher the oil uptake of the chips and the higher the frying temperature the lower the fat contents of chips. The rate of oil uptakes during frying were shown in Figure 2.
Figure 2. Oil uptakes of sweet potato-rice simulated chips at various temperature of frying.
Sensorial characteristics
Sensorial characterizations of the chips were carried out only for the prospectively acceptable ones as considered based on the chips appearance and texture objective tests of all treatment combinations. These were for the chips of 70:30 formula baked at 160oC for 10 minutes and the 80:20 formula baked at 160oC for 10 minutes and 180oC for 8 minutes, and only for the 60:40 formula of the chips fried at 150oC for 2.5 minutes, 160oC for 1.0 minute and 170oC for 0.5 minutes. The overall hedonic rating of sweet potato-rice simulated chips, in general, were acceptable ranged from 3.38+1.16 to 4.34+1.35 for the baked chips and from 4.39+1.43 to 5.37+1.24 for the fried chips (Table 2)
Table 2. Sensorial characteristics (hedonic rating) of the sweetpotato-rice simulated chips
September 9-11, 2015, Banda Aceh, Indonesia
141
Microstructure
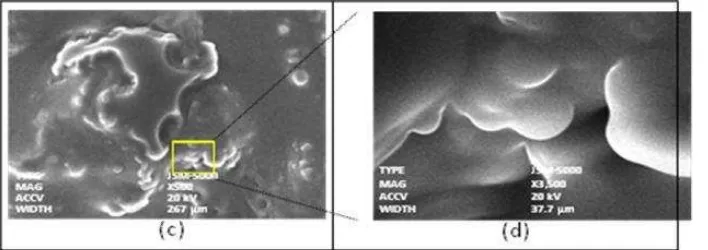
The results showed that, generally, the fried simulated chips have finer or smoother surface structures compared to the baked products (Figure 2). These suggested that driving force for gelatinization and vast structural modification occurred faster during frying than baking processes. These also confirmed the theories that heat transfer from liquid oil medium into the chips was faster during frying than the heat transfer due to forced hot air circulated during baking. It was likely that the forced hot air in the baking oven also facilitated faster moisture evaporation from the baked simulated chips which in turn hampered the process gelatinization and texture formation.
Figure 2. Microstructure topography of the best sweet potato-rice (80: 20) simulated chips, baked at 180 °C for 8 minutes, with magnification of 500x (a) and 3500x (b).
Figure 3. Microstructure topography of the best fried sweet potato-rice (60:40) simulated chips, fried at 170°C for 0.5 minute, with magnification of 500x (c) and 3500x (d).
Conclusions
Sweet potato-rice simulated chips was successfully made using a combined mash and dry flour of sweet potato mixed with dry flours of rice, enriched with skim milk, carrots, celery and temurui powders. The best baked sweet potato-rice simulated chip was obtained from the formula 80: 20 mix baked at 180 °C for 8 minutes, and best fried chip was from sweet potato-rice 60:40 formula fried at 170°C for 0.5 minute. Overall, these chips were, in general, have crispy texture, dark yellow color, with acceptability ranged from neutral and rather like. The overall ratings of the fried chips were in general higher than the baked chips with no addition of flavorings. These findings suggested that the prospect of implementation of sweet potato-rice simulated chips was bright.
Acknowledgements
Sincere gratitude and credits were dedicated to Bogor Agricultural University and the Ministry of Education and Culture for the funding granted to this research. Researchers also wish to thank especially to the Dept. of Food Science and Technology and Fateta IPB, the SEAFAST Center, and F- Technopark, and LIPI Cibinong for the facilities and equipment supports that enable this research completed.
References
Ahza, A.B., Fidiena, T.I., Suryatman, S. (2015). Physical, sensorial and chemical characteristics of simulated chips of cassava (Manihot esculenta, Crantz): rice (Oryza sativa, L) mix. J. Procedia Food Science 3:82-95.
AOAC (1999). Official Methods of Analysis of AOAC International. 8th Ed. Maryland: AOAC International.
Badan Pusat Statistik (BPS). 2013. Luas Panen, Produktifitas dan Produksi Tanaman Ubi jalar Seluruh Provinsi Indonesia Tahun 2013. www.bps.go.id.
142
development in low-fat baked potato products as influenced by baking conditions and oil type. Eur. Food Res. Technol. 236:843-851.
Saeleaw, M., Schleining, G. (2011). Effect of frying parameters on crispiness and sound emission of cassava crackers. J Food Eng. 103: 229-239.