ASIAN CITY CLIMATE CHANGE RESILIENCE
NETWORK: INDIA CHAPTER
PHASE 2:
CITY VULNERABILITY ANALYSIS REPORT
INDORE & SURAT
Submitted to
Rockefeller Foundation
TARU Leading Edge
Gurgaon & Gandhinagar
CONTENTS
1 Background about ACCCRN (Phase II) – Indore and Surat... 1
2 Indian urban context ... 2
2.1 Urban growth ... 2
2.2 Resource Context - Urban Metabolism & dependence on external resources ... 3
2.3 Constraints on water supplies and natural resources ... 3
2.4 Urban Infrastructure upgradation, finance autonomy issues ... 5
2.5 Administration and 3 Fs, Autonomy (74th amendment) etc. Actual situation... 5
2.6 Urban Poverty ... 7
2.7 Climate change risks – Indian urban context ... 8
2.8 Upgrading slums and squatter settlements ... 10
2.9 Current plans and visions in Urban development ... 12
2.10 JNNURM progress in Surat & Indore:... 13
2.11 Major issues of CC risks in urban environment ... 13
3 Vulnerability assessment... 17
3.1 Objectives ... 17
3.2 Components of vulnerability in urban context ... 17
3.3 Methodology and tools... 18
3.4 Sample Coverage ... 19
4 INDORE – City Profile ... 25
4.1 Introduction ... 25
4.2 Location and Access ... 25
4.3 Geographical features ... 25
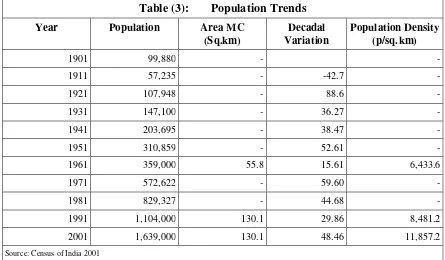
4.4 Demography ... 26
4.5 Economy ... 27
4.6 City Governance and Institutional mechanism... 28
4.7 Community-Resource-Government-Market linkages... 32
4.8 Climate change Scenarios for Indore ... 34
4.9 Capacity and Vulnerability assessment... 44
4.9.1 Education capacity index... 46
4.9.2 Income Stability Index ... 47
4.9.3 Social Capacity Index ... 49
4.9.4 Drainage and Sewerage vulnerability index ... 50
4.9.5 Water scarcity index... 53
4.10 Industry Profile Indore ... 60
4.11 CRGM model ... 64
4.12 Conclusions ... 67
4.13 Adaptation requirements ... 67
5 Surat – City Profile ... 69
5.1 Introduction ... 69
5.2 Location and Access ... 69
5.3 Demography, City Growth and trends, Economic base ... 70
5.4 Economic Base of Surat ... 71
5.5 Administration, Governance Urban Management, Stakeholders ... 74
5.6 Community-Resource-Government-Market linkages... 77
5.7 Hydro meteorological Risks ... 78
5.8 Climate change Scenario for Surat ... 80
5.9.1 Education capacity index... 91
5.9.2 Income stability index ... 92
5.9.3 Social capacity Index ... 93
5.9.4 Drainage and sewerage vulnerability index ... 95
5.9.5 Loan and insurance vulnerability index ... 97
5.9.6 Flood vulnerability index ... 98
5.9.7 Hydrometeorological risk exposure ... 99
5.10 Advanced Warning Mechanisms and Coping Mechanisms ... 100
5.11 Industrial profile ... 103
5.12 CRGM model ... 109
5.13 Conclusions ... 112
5.14 Adaptation options ... 113
6 References ... 115
LIST OF BOXES Box (1): Management Innovations for Municipal Resource Mobilization in Indore…….6
Box (2): Basic Services to the Urban Poor - Objectives and components………....10
Box (3): Integrated Housing & Slum Development Programme - Objectives and coverage ……….12
Box (4): Evolution of vulnerability assessment methods ………..20
Box (5): Increasing Municipal Revenues: Case of Indore……….31
Box (6): Story of the Ukai Dam………80
LIST OF FIGURES Fig. (1) : People and Environments: Zone of Intervention ... 9
Fig. (2) : GIS based VulnErability anlaysis FRAMEwork ... 19
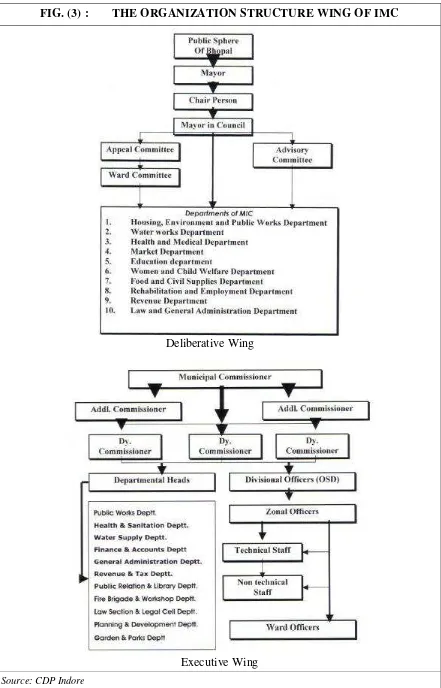
Fig. (3) : The organization structure Wing of IMC ... 29
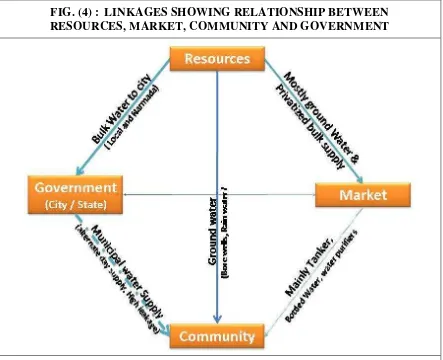
Fig. (4) : Linkages showing relationship between Resources, Market, Community and Government ... 33
Fig. (5) : Indore-Total monthly precipitation anomaly (Futurea – Control)... 35
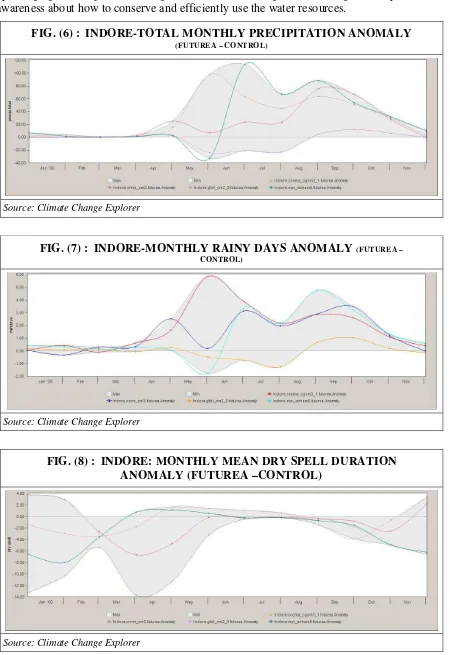
Fig. (6) : Indore-Total monthly precipitation anomaly (Futurea – Control)... 36
Fig. (7) : Indore-Monthly rainy days anomaly (Futurea –Control) ... 36
Fig. (8) : Indore: Monthly mean dry spell duration anomaly (Futurea –Control) ... 36
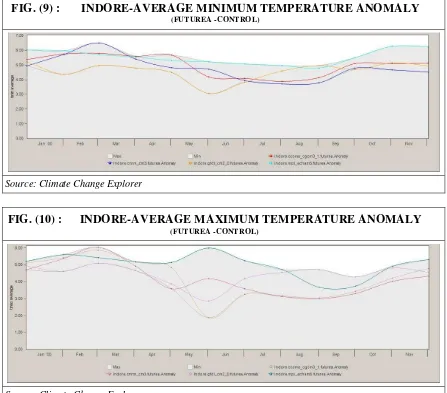
Fig. (9) : Indore-Average minimum temperature anomaly (Futurea -Control) ... 37
Fig. (10) : Indore-Average maximum temperature anomaly (Futurea -Control)... 37
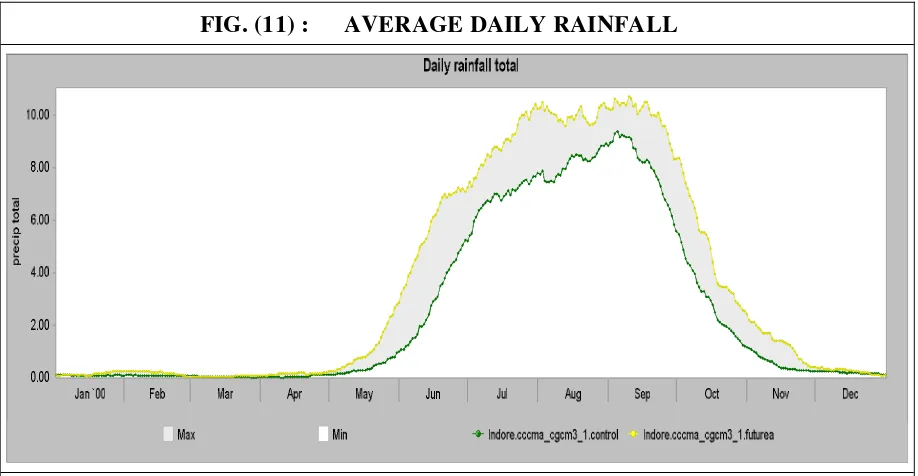
Fig. (11) : Average daily rainfall ... 38
Fig. (12) : Average daily rainfall anomaly ... 39
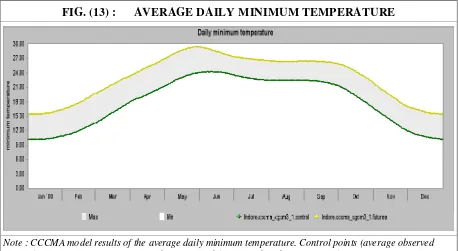
Fig. (13) : Average daily minimum temperature ... 39
Fig. (14) : Average daily maximum temperature ... 40
Fig. (15) : Anomaly in average daily maximum temperature... 40
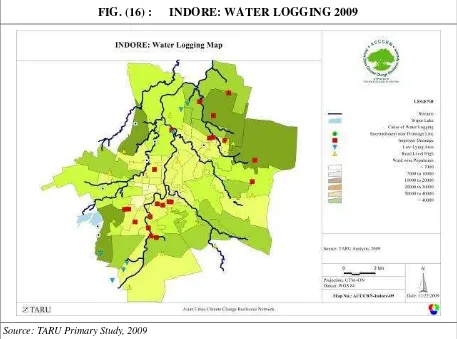
Fig. (16) : INDORE: Water Logging 2009 ... 41
Fig. (17) : INDORE: Capacity & VulnErability Index across Sample Settlements ... 45
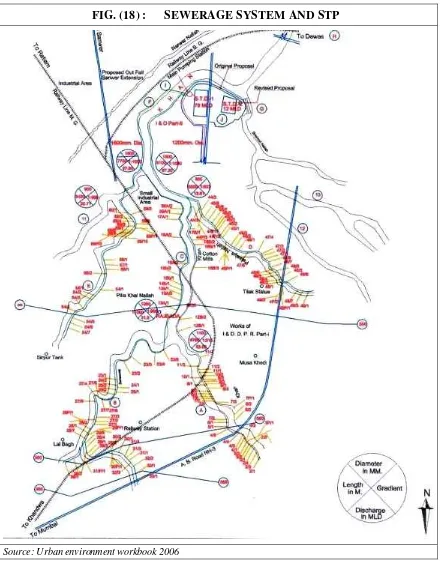
Fig. (18) : Sewerage System and STP ... 52
Fig. (20) : Lower class ... 56
Fig. (21) : Middle class ... 57
Fig. (22) : Upper class ... 57
Fig. (23) : Linkages showing relationship between Resources, Market, Community and Government ... 66
Fig. (24) : Population and Decadal growth of Surat ... 70
Fig. (25) : Illustrating the average minimum temperature values that were used as the inputs for the prediction (Control - January 1, 1961 to December 31, 2000) .... 81
Fig. (26) : Illustrating the average maximum temperature values that were used as the inputs for the prediction (Control - January 1, 1961 to December 31, 2000) .... 81
Fig. (27) : Illustrating the total monthly precipitation of the input data used by the various models (Control - January 1, 1961 to December 31, 2000) ... 82
Fig. (28) : Illustrating the total monthly precipitation anomaly (Futurea - January 1, 2046 to December 31, 2065 with respect to Control - January 1, 1961 to December 31, 2000) ... 83
Fig. (29) : Average minimum temperature anomaly (Futurea - January 1, 2046 to December 31, 2065 with respect to Control - January 1, 1961 to December 31, 2000) ... 83
Fig. (30) : Average maximum temperature anomaly (Futurea -Control) ... 83
Fig. (31) : Surat- Monthly rainy day’s anomaly (Futurea –Control) ... 84
Fig. (32) : Surat-Monthly mean dry spell duration anomaly (Futurea -Control) ... 84
Fig. (33) : Surat - Average minimum temperature anomaly (Futurea -Control) ... 85
Fig. (34) : Surat-Average maximum temperature anomaly (Futurea -Control) ... 86
Fig. (35) : CCCMA: Precipation Ranges... 86
Fig. (36) : CCCMA: Precipation ... 87
Fig. (37) : CCCMA: Maximum average temperature events across months(Yaxis) ... 88
Fig. (38) : SURAT: Capacity & Vulnerability Index across Sample Settlements ... 90
Fig. (39) : Slum ... 96
Fig. (40) : Lower class ... 96
Fig. (41) : Middle class ... 97
Fig. (42) : Upper Class ... 97
Fig. (43) : Linkages showing relationship between Resources, Market, Community and Government ... 110
LIST OF TABLES Table (1): Set of Indicators ... 17
Table (2): Data sets used for deriving capacity and vulnerability indicators ... 17
Table (3): Population Trends ... 26
Table (4): Indore: Reported diseases during last one year across Sample settlements ... 43
Table (5): Total number of households across different SECs in Indore (based on GIS)... 44
Table (6): Education Status Indore from Sample Survey ... 46
Table (7): Estimates of Education Index across Socio Economic Classes in Indore... 46
Table (8): Occupational Profile of Indore ... 47
Table (9): Indore occupational profile ... 47
Table (10): Estimates of Income stability index range across Socio economic classes in Indore city ... 48
Table (11): Indore: Estimated population by state of Origin (GIS assisted analysis) ... 49
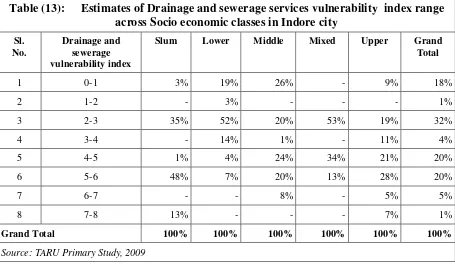
Table (13): Estimates of Drainage and sewerage services vulnerability index range across
Socio economic classes in Indore city ... 51
Table (14): Solid waste collection arrangements across SECs... 53
Table (15): Distribution of household level water storage capacity among the sample households (1250 HHS) ... 54
Table (16): Estimates of water scarcity vulnerability index range across Socio economic classes in Indore city ... 55
Table (17): Estimates of Insurance and loan vulnerability index range across Socio economic classes in Indore city ... 58
Table (18): Flood Vulnerability Index ... 59
Table (19): Estimates of Flood vulnerability index range across Socio economic classes from the sample survey (75 settlements) ... 60
Table (20): Industrial Profile of Indore (2008) ... 60
Table (21): Class wise industries surveyed in Indore ... 62
Table (22): Water Supply Source for sample Industries ... 62
Table (23): Education institutions profile of Indore ... 63
Table (24): No. health institutions in Indore ... 64
Table (25): No. hotels and restaurants in Indore ... 64
Table (26): Surat City Profile ... 69
Table (27): Surat Municipal Growth Statistics (Area and Population) ... 70
Table (28): Land use in SUDA Planning area over years ... 73
Table (29): Reported Surat Floods ... 79
Table (30): SURAT: Population estimates (No of households) ... 89
Table (31): SURAT: Education capacity index ... 91
Table (32): City level proportion Occupation classes Surat (based on GIS) ... 92
Table (33): SURAT: Income stability index ... 92
Table (34): SURAT: Social capacity Index across the City ... 93
Table (35): SURAT: Estimated composition of households by state of Origin across SECs94 Table (36): Solid waste disposal arrangements across SECs ... 95
Table (37): City wide Drainage and sewerage index across the SECs ( as % of each SEC) 95 Table (38): Loan and insurance vulnerability index ... 98
Table (39): Flood Vulnerability Index ... 98
Table (40): Households at risk from Khadi Floods across SECs based on GIS analysis ... 99
Table (41): Households Across SECs potentially prone to 2006 Flood inundations (GIS analysis)... 99
Table (42): Early warning message received before the 2006 floods Across SECs (as % of SEC) ... 100
Table (43): Source of Flood Warning across the SECs ... 101
Table (44): Mobile phone coverage across SECs among the sample households (as % of SEC) ... 102
Table (45): No of coping measures reported by respondents across SECs ... 102
Table (46): Priority of Regular Energy Audit among the industries ... 105
Table (47): Water Recycle and Reuse Priority among the industries ... 105
Table (48): Capital and stock losses from Floods... 106
Table (49): Industry sector losses from 2006 Floods ( Rs. Billion) ... 106
Table (50): Higher education institutions in Surat... 107
Table (51): Hospital bed capacities in Surat... 108
LIST OF ANNEXES
Annex (A): Implementaion of Reforms – Indore & Surat ... A-I Annex (B): Major Indicators and sub indicators comprising the capacity and vulnerability
index for the cities of Indore and Surat………...A-III Annex (C): Visual Interpretation Method for SEC Classification ... A-VIII Annex (D): SWOT Analysis – INDORE... A-X Annex (E): INDORE: Proportion of HH level Maximum Education across Sample
Settlements ... A-XIII Annex (F): INDORE: Livelihood profile across Sample Settlements………A-XIV Annex (G): INDORE: House Types across Sample Settlements...A-XV Annex (H): SWOT Analysis – SURAT ... A-XVI Annex (I): SURAT: Classification of Land use and Settlements based on SECs (GIS
analysis)... A-XIX Annex (J): SURAT: Proportion of HH level Maximum Education across Sample
LIST OF ABBREVIATIONS
ACCCRN Asian Cities Climate Change Resilience Network AGCM Atmospheric Global Circulation Model
AKVN Audhyogik Kendra Vikas Nigam
AOGCM Coupled Atmospheric Oceanic Global Circulation Model BPMC Bombay Provincial Municipal Corporation Act
BSUP Basic Services for Urban Poor CAC City Advisory Committee CC Climate Change
CCCma Canadian Centre for Climate Modeling and Analysis CDP City Development Plan
CGCM3 Coupled Global Climate Model CNG Compressed Natural Gas
CRGM Community-Resources-Government-Markets
DEFRA Department of Environment, Food and Rural Affairs DIFD Department for International Development
EEP Energy Efficiency Promotion EWS Economically Weaker Sections
FIRE D Financial Institutions Reform and Expansion GCM Global Climate Models
GDP Gross Domestic Product GHG Green House Gases
GIDC Gujarat Industrial Development Corporation GIS Geographical Information System
GISS Goddard Institute for Space Studies GPCB Gujarat Pollution Control Board GPS Global Positioning System
GSDMA Gujarat State Disaster Management Authority GWSSB Gujarat Water Supply and Sewerage Board HADA Hazira Development Authority
HUDCO Housing and Urban Development Corporation IDA Indore Development Authority
IDP Indore Development Plan
IHSDP Integrated Housing and Slum Development Program IIED International Institute for Environment and Development IITM Indian Institute of Tropical Meteorology
IMC Indore Municipal Corporation IMD Indian Meteorological Department
IPCC Inter-Governmental Panel on Climate Change IPSL Institute Pierre Simon Laplace
ISDA Infrastructure Services Deficiency Analysis
JNNURM Jawaharlal Nehru National Urban Renewal Mission KWH Kilo Watt Hour
LECZ Low Coastal Elevation Zone LPCD Liters Per Capita per Day LPG Liquefied Petroleum Gas MOA Ministry of Agriculture
MoEF Ministry of Environment and Forests MoF Ministry of Finance
1 BACKGROUND ABOUT ACCCRN (PHASE II) – INDORE AND SURAT
The Rockefeller Foundation’s Asian Cities Climate Change Resilience Network initiative is a collective experiment with a range of activities that will together improve the ability of the cities to withstand, prepare for, and recover from the projected impacts of climate change. The interventions in the city of Indore and Surat spans across several interventions such as raising awareness of climate variability and climate change risks, developing city specific vision strategy and scenarios for informed decision making, screening programmes and plans for urban environment/planning/development/urban transport, sectoral studies on water security/energy security/public health among others, flood risk management and preparedness strategies, public health and policy initiatives.
Phase I of the programme focused towards city scoping and selection of partner cities for deeper engagement. TARU undertook city opportunity assessment studies in Gorakhpur, Hubli-Dharwad, Indore, Jodhpur, Kakinada and Surat. The study involved understanding vulnerabilities and possible impacts to climate change, broad analysis of risk and vulnerability, urbanization process and poverty profile, broad analysis of service deficiency in urban services, stakeholder analysis, investigating readiness of the cities to engage with the project on adaptation and building resilience. In India three partner cities namely Gorakhpur, Indore and Surat were selected in which ACCCRN Phase II initiative planned to pursue deeper engagement under PHASE II.
Phase II (Jan2009 - Jun2010) of the initiative focuses on City-level engagement and capacity development. The core strategy for the cities of Indore and Surat is to develop implementation proposals that are owned by the diverse set of city stakeholders including the local government unit/urban development agencies, civil society organizations, and the private sector to ensure sustainability. TARU with support from ISET is involved in facilitating the implementation process through the following set of objectives:
Understand city level vulnerability and identification of potential climate variability and climate change impacts
Support the city advisory committee (CAC) in developing technically sound proposals involving prioritized climate resilience action plan through multi-stakeholder engagement;
Facilitating identification and assessment of climate risks in project cities;
Facilitating the development of replicable processes, methodologies and core insights on strategies for adapting to climate change in urban settings through development of a knowledge network involving cities and other project partners; and
Facilitate the cities to obtain major funding from diverse donors, including but not limited to the Rockefeller Foundation, for implementation in the context that is likely to exist following climate negotiations scheduled for December 2009 in Copenhagen. Create city specific urban climate change adaptation/resilience action plan with particular focus on improving the resilience of poor and vulnerable populations to climate change impacts.
business leaders, private/industry sector, philanthropic organizations and the media. Climate scientists and development professionals are now sure that the physical effects of climate change and their consequences will be seen sooner than we anticipated few years ago. However the manifestations, nature and intensity remain uncertain. Pushing for action especially in an urban environment seeks establishing networks for learning and engagement. Actions and opportunities need to be taken at several levels and across sectors, much before the range of threats and impacts unfold leaving behind no option to figure out. Partnership development by engaging new and more stakeholders is the key to realize the perception of response period, address wide range of issues/concerns and take informed decisions. The city of Indore and Surat has been successful to broaden the conversation of climate change by engaging a broad range of representatives of the cities leading to formation of new alliances around the issues.
In order to develop adaptation strategy/plan for the city, the analysis framework for both the cities suggested detailed vulnerability assessment. This assessment along with sector studies shall guide the adaptation strategy framework for the City of Indore and Surat. The activities were scheduled in three phases over a time frame of one year (Nov 2008 – Nov 2009). The over arching framework for vulnerability studies was laid through a set of consultation meetings with communities/stakeholders followed by series of field visits. The assessment mainly identifies current vulnerabilities and capacities through a unique method of integration/combination of tool sets. The tool set and methods comprise a set of inter-related activities of literature review, collection of secondary data, primary surveys and semi-structured interviews of key informants, Infrastructure Services Deficiency Analysis (ISDA), Vulnerability and Capacity Index, Community-Resources-Government-Markets (CRGM) and series of set of Shared Learning Dialogues (SLD) / iterative meetings with different groups. This report is mainly divided into four sections: Introduction chapter covers the urban scenario of India, climate change risks in the Indian context, vulnerability issues in urban areas and introduction to the Vulnerability Assessment Methodology. Chapter 2 and Chapter 3 presents an insight to the city and its functions, hydro meteorological risks, capacity and vulnerability assessment results and adaptation leverage points. Chapter 4 draws in conclusion and way forward.
2 INDIAN URBAN CONTEXT
2.1 Urban growth
The existing infrastructure available in the cities unable to cope with the existing population pressure is stretched even more now with the expansion of the city limit areas. The growth of industries and of late the service sector in the country have put an immense pressure on the local bodies to expand the city limits. Surat is one of the best examples having expanded the city limits areas in 2006 from 112 Sq.km to 326 Sq.km. In case of the strategic metropolis, which are now potentially full to their capacity, are following up with the expansion of the city limits but under separate administrative units; more prominent examples being National Capital Region (NCR) in case of Delhi and Navi Mumbai in case of Mumbai. The expanded city limits too have to depend on the core of the city to meet the basic infrastructure demands. Moreover the human resource for these industries also comes from the core city area followed by the gradual shifting towards the periphery as the infrastructure needs are catered to (e.g. middle income population), and sometimes more abruptly (e.g. low income/migrant population). Analysis of the older metropolitan cities and the new metropolitan cities in the country reveals that the core population is actually decreasing in the older ones except Bangalore while in the newer ones it is the core which is growing in density (Bhagat, 2005)
2.2 Resource Context - Urban Metabolism & dependence on external resources
Water is indispensable ‘stuff’ for maintaining the metabolism, not only of our human bodies, but also of the wider social fabric. The very sustainability of cities and the practices of everyday life that constitute ‘the urban’ are predicated upon and conditioned by the supply, circulation, and elimination of water.
Erik Swyngedouw
The concept of an urban metabolism provides a means of understanding the sustainable development of cities by drawing analogy with the metabolic processes of organisms. The parallels are strong: “Cities transform raw materials, fuel, and water into the built environment, human biomass and waste” (Decker et al. 2000). The metabolism of an urban area is an interconnection of space, urban infrastructure and material inflows which are dependent on external resources – mainly energy and water. Urban metabolism can be defined as “the sum total of the technical and socio-economic processes that occur in cities, resulting in growth, production of energy, and elimination of waste” (Kennedy et al. 2007). The metabolism of an ecosystem involving the production, via photosynthesis, and consumption, by respiration, of organic matter is often expressed by ecologists in terms of energy. A few studies of urban metabolism have focused on quantifying the embodied energy in cities, while others have more broadly included fluxes of nutrients and materials, and the urban hydrologic cycle (Kennedy, 2007)
2.3 Constraints on water supplies and natural resources
the population of the cities is growing, there is a change in the metabolism of the cities and the per capita energy requirement is on the rise. Climate change exacerbates the material and energy flow in the cities. A simple example is the rising per capita electricity consumption for summer cooling during the period of extended summer months. In order to meet the material and energy demands a large number of secondary cities in India are undergoing massive transformation through investment in infrastructure (especially water supply, urban transportation, energy, recycling systems).
Cities are on the trend of becoming more material intensive and have therefore strained the existing natural resources especially water resources, agricultural land and forests, pollution of streams and overall quality of life. Many cities and their catchments are likely to get less precipitation (and have more constrained freshwater resources) – which is particularly problematic for growing cities as well as large cities facing serious problems obtaining freshwater supplies (Danilo J, 1993). Although agriculture remains the largest user of freshwater resources within virtually all national economies, the water demands from urban enterprises and consumers have become increasingly important in most nations. In addition, many major cities have had to draw freshwater from increasingly distant sources, as local surface and groundwater sources are no longer able to meet the demand for water, or as they become depleted or polluted. In many coastal cities, local groundwater supplies have been depleted to the point where saline intrusion limits freshwater supplies (Hardoy et. al., 2001). In many cities the failure to manage the water resources as on date is independent of climate change. For instance the distribution losses are far more linked to inadequate governance than to water shortage. Further the rate of water consumption versus few or no options of reuse makes it unsustainable.
The water crisis is related to the poor distribution of water and in many cases it is now observed as lack of water at source. The National Capital Region in India (Delhi and surrounding environs) faces a severe water shortfall and is competing with irrigated agriculture upstream. Drinking water is being transported to meet the demands of this city of 15 million, from over 300km, and yet unaccounted-for water losses are over 40 per cent in the city. Rising temperatures and therefore energy demand for cooling, increasing precipitation variability, a lower number of rainy days, an unsustainable mining of groundwater and a heavily polluted river system could make the Delhi mega-urban region, with its projected population of over 30 million, unsustainable, in spite of the rapid growth in its income and wealth (Revi, 2007). Most of the urban local bodies prefer to the respond to the rising deficit by augmenting existing water supply via tapping new distant and often costliest water resources, while not investing on tapping soft water paths (Gleick, 2003) through reducing distribution losses and recycling. Untargeted subsidies are a major disincentive for household level conservation practices. The energy bills incurred for tapping these external resources are significantly high.
health is of a great concern throughout the year. Design of infrastructure to improve the services for the poor are often not informed by local context and maintenance issues are often neglected, resulting in partial or complete failure soon after commissioning.
2.4 Urban Infrastructure upgradation, finance autonomy issues
As per 2001 population census 285.35 million people reside in urban areas. It constitutes 27.8% of the total population of the country. According to the Ministry of Urban Development, the urban population in India is expected to reach a staggering total of 575 million by 2030 from an estimated 325 million in 2005 (UN Population Database, 2010). The rising urban population has also given rise to increase in the number of urban poor. As per 2001 estimates, the slum population is estimated to be 61.8 million. The ever increasing number of slum dwellers causes tremendous pressure on urban basic services and infrastructure. Without major urban land reforms, cities in India will not be able to support the inevitable urbanization in a planned way. Raising finance for urban infrastructure has been a challenge (India Infrastructure Report, 2009). Liberalization policies adopted by the Government of India are expected to increase the share of the urban population and may increase to about 40 per cent of total population by the year 2021. It is estimated that by the year 2011, urban areas would contribute about 65 per cent of gross domestic product (GDP). However, this higher productivity is contingent upon the availability and quality of infrastructure services. Urban economic activities are dependent on infrastructure, such as power, telecom, roads, water supply and mass transportation, coupled with civic infrastructure, such as sanitation and solid waste management (JNNURM, 2004). Local government and other government agencies do not always have the necessary resources to cope up with the housing needs. Urban infrastructure development also needs to address large and continued inflow of population related demands and related issues. Addressing growth in peripheral areas due to inflow of people from rural areas builds pressure on the local government to provide civic services. It is estimated that over 7 years starting 2005-06, the Urban Local Bodies (ULBs) would require a total investments of 1,205.36 billion Rs. This includes investment in basic infrastructure and services, that is, annual funding requirement of 172.190 billion Rs.
Since cities and towns in India constitute the second largest urban system in the world, and contribute over 50 per cent of the country’s GDP, they are central to economic growth. For the cities to realize their full potential and become effective engines of growth, it is necessary that focused attention be given to the improvement of infrastructure. In order to fructify these investments, Jawaharlal Nehru National Urban Renewal Mission (JNNURM), a national level initiative was launched which brought together the State Governments and enabled ULB’s catalyse investment flows to the urban infrastructure sector. Sub-Mission for Urban Infrastructure and Governance is being administered by the Ministry of Urban Development. The main thrust of the Sub-Mission will be on infrastructure projects relating to water supply and sanitation, sewerage, solid waste management, road network, urban transport and redevelopment of old city areas with a view to upgrading infrastructure therein, shifting industrial and commercial establishments to conforming areas, etc.
2.5 Actual situation of urban administration and “3 Fs”, post 74th amendment.
Most functions related to the urban governance and management has traditionally been vested with the state governments. The ULBs are still constrained by lack of funds, overlapping and fragmented functions between ULBs and state government and lack of functionaries
enacted to devolve most of the urban administration functions to the urban local bodies, but their actual implementation is highly diverse across the states. .
The evolution and form of urban environmental and social service institutions varies across states as they have emerged in response to differing patterns of urbanization and the challenges faced in different parts of the country. Box (1) highlights the management innovations undertaken by the Indore Municipal Corporation during the late 1990’s.
Box (1): Management Innovations for Municipal Resource Mobilization in Indore Management innovations in Municipal Resource Mobilization were undertaken by Indore Municipal Corporation under the Indo-USAID Financial Institutions Reform and Expansion (FIRE) project. The project supported IMC municipal officials to increase the city’s revenues in various ways, including making optimal use of existing assets, and build their capacity to better govern the city through providing training and technical assistance.
The various steps undertaken by IMC to improve resource mobilization are:
Improved Tax Administration
Tax grievance redressal camps Municipal Asset Management
The ULBs, till several years ago, had not been able to meet the growing infrastructure and service demands of the urban communities. The first thing that arises is inadequacy of finances. Finance alone is not the only factor accounting for unsatisfactory performance. It has been seen that even obligatory functions are being inadequately performed. Services and amenities are chronically short of basic requirements, leaving alone expansion and maintenance of existing facilities. Fiscal autonomy largely depends upon the extent of innovative mechanisms by which resources are raised by the local bodies. The reluctance of the ULBs to tax people and poor administrative capacity at the local level also account for poor financial position of the local bodies.
Functional autonomy is reality only when it is accompanied by financial independence through positive measures/policy reforms by the State Government. This will ensure financial self-reliance of the ULBs. While most of the functions related to municipal functioning come under the purview of the State, the Government of India still exerts a huge influence over the planning process through resource transfers via the Centrally Sponsored Schemes. One of the main strategy of urban renewal is to ensure improvement in urban governance so that Urban Local Bodies (ULBs) and para-statal agencies become financially sound with enhanced credit rating and ability to access market capital for undertaking new programmes and expansion of services. In this improved environment, public-private participation models for provisioning of various services would also become feasible. To achieve this objective, State Governments, Urban Local Bodies and para-statal agencies are required to accept implementation of an agenda of reforms.
categories-Mandatory reforms and Optional reforms. City-wise Status of Implementation of JNNURM Reforms (as on 30th June, 2008) is highlighted in Annex (A).
2.6 Urban Poverty
The urban population of India is increasing but not as fast as other Asian countries. India has shared the growth pattern with some of the fastest growing regions in Asia. The country has witnessed around 8 percent growth in GDP in the last couple of years. India’s urban population is increasing at a faster rate than its total population. Urbanization has been recognized as an important component of economic growth. At 28 percent, the pace of urbanization, however, has been slow and lower than the average for Asia. The absolute number of people in urban cities and towns, however, has gone up substantially. The researchers expect rate of urbanization to also increase in the coming years. With over 575 million people, India will have 41 percent of its population living in cities and towns by 2030 from the present level of 286 million (India-Urban Poverty Report, 2009).
Push and pull migration
The growth of the cities throws ample opportunity for the work force (skilled/ unskilled) to get absorbed in the urban market. Here both the factors of push and pull migration have to be in play to fill in the demand of workforce at all levels. As per the Census 2001 figures, almost 309 million migrated in the country which accounts for almost 30 percent of the population of the country. The cities with high potential of churning out jobs (e.g. Delhi, Mumbai, Pune, Bangalore, Surat, Ahmedabad, Indore), continue to remain the favorite destination for years for inter as well intra state migrants. The result being sheer mismatch in the quantum of the possibility offered on account of pull migration and the resources available through push migration; the possibility of later outnumbering the former being more. Lack of potential of other cities to develop as mega centers is hindered due to many reasons like lack of matching fund, revenue deficit, lack of municipal sector reforms, lack of avenues for the industry and the service sector to find incessant supply of resources (esp. water, electricity, human resources). A gradual shift in the migration pattern from big cities to smaller towns due to high cost of living in the cities is also being noticed (Kundu, 1997).
Most of the cities face migration mostly from the nearby areas falling within the state or even outside depending upon the availability of the jobs, skill set, geographical distance, acceptability, history of migration etc. The reasons are varied, ranging from the difficult topography of the native place, average land holding size (0.4 ha for marginal farmers and 1.41ha for small farmers (MOA, 2005), net sown area, and total irrigated land. Issue of less per capita land availability combined with untimely rainfalls, lack of access to irrigation facilities, water scarcity due to overexploitation of ground water, land degradation and decreasing productivity (marginal lands in particular), have taken a toll on the rural populace. All India average for the land holding by small and the marginal farmers accounts for almost 38.9 percent of the total land holding in the country, in case of Gujarat and Madhya Pradesh it is 25.4 percent and 25.8 percent respectively (ibid). Moreover, the growth in the population does not transcend into more or even constant amount of land availability for the next generation. Availability of work through National Rural Employment Guarantee Scheme (NREGS) has been able to curtail the migration to some extent, but still not rewarding to completely stop the trend of migration.
2.7 Climate change risks – Indian urban context
needs to be done to help people and environments cope with what’s already occurred and with what’s coming.” This is represented in the graphic below (Fig. (1)). The star in the centre determines the zone of intervention.
FIG. (1) : PEOPLE AND ENVIRONMENTS: ZONE OF INTERVENTION
Source: based on discussion with Jo da Silva (ACCCRN, Hue Meeting, Sept 2009)
The increased climate variability and change are likely to differentially impact the poorer and disadvantage groups. The increased level of risk can be due to increase in flooding events, scant availability of water supplies, increase in cost of food supplies or water, service deficiency of basic infrastructure, damage caused due to physical assets and livelihoods due to hydro-meteorological phenomena and poor adaptive capacity of individuals/families and the communities. In general, the people most at risk from climate change are those living in affected areas that are:
inability to avoid the direct or indirect impacts (e.g. by lack of good-quality houses and drainage systems that prevent flooding);
likely to be most affected (e.g. for instance infants and older groups who are less able to cope with heat waves);
least able to cope with the illness, injury, premature death or loss of income, livelihood or assets caused by the kinds of impacts (Satterthwaite et al., 2007) ( e.g. Households with uncertain incomes prone to disaster related losses).
Good governance bridges the disparities between income groups and risk-prone groups. For instance, by proving basic services such as piped water supply, sanitation, electricity, safe housing to socially disadvantage groups, the exposure to the hazard risks is considerably minimized. Socially progressive schemes either through the federal/state/ULB funds will reduce the vulnerability of the poor and enhance city wide planning. The quality of government at city and higher levels influences the levels of risk from climate change facing those with limited incomes or assets in several ways:
quality of provision for disaster-preparedness (including warnings, measures taken to limit damage and, if needed, good provision to help people move to safer areas quickly);
quality of planning for and coordinating disaster-response (for instance rescue services and appropriate emergency and health care services) and reconstruction (to help those who have lost their homes and livelihoods) which should aim to improve resilience, but seldom achieves this;
extent to which poorer groups can buy, build or rent “safe” housing in “safe” sites; degree to which local government creates an enabling environment for local civil-society action to contribute towards addressing the practical aims identified above (Satterthwaite et al., 2007).
2.8 Upgrading slums and squatter settlements
Experiences worldwide has shown that a more inclusive approach of the poorer groups in the planning process reduces the exposure and enhances vulnerability reduction. Improving the housing conditions, urban infrastructure services and providing livelihood opportunities will make poor less vulnerable to climate change in urban areas. In India, a significant development took place in the year 2004 with the reappearance of a significant public policy agenda on urban development, urban renewal and governance. Considerable support has been extended by the national government programme supported by the State and the Local Government Unit.
In order to cope with massive problems that have emerged as a result of rapid urban growth, it has become imperative to draw up a coherent urbanization policy/strategy to implement projects in select cities on mission mode. The JNNURM Sub-Mission for Basic Services to the Urban Poor is being administered by the Ministry of Urban Employment and Poverty Alleviation through the Sub-Mission Directorate for Basic Services to the Urban Poor. The main thrust of the Sub-Mission will be on integrated development of slums through projects for providing shelter, basic services and other related civic amenities with a view to providing utilities to the urban poor. Box (2) and Box (3) highlight the objectives and components of the JNNURM Sub-mission.
Box (2): Basic Services to the Urban Poor - Objectives and components
The JNNURM seeks to ensure sustainable development of select cities. An evaluation of the experience of implementation of the Mission would be undertaken before the commencement of Eleventh Five Year Plan and if, necessary, the programme calibrated suitably. The main thrust of the sub-Mission on Basic Services to the Urban Poor will be on integrated development of slums through projects for providing shelter, basic services and other related civic amenities with a view to provide utilities to the urban poor. Key mission objectives are:
Focused attention to integrated development of Basic Services to the Urban Poor in the cities covered under the Mission.
Provision of Basic Services to Urban Poor including security of tenure at affordable prices, improved housing, water supply, sanitation and ensuring delivery through convergence of other already existing universal services of the Government for education, health and social security. Care will be taken to see that the urban poor are provided housing near their place of occupation.
Secure effective linkages between asset creation and asset management so that the Basic Services to the Urban Poor created in the cities are not only maintained efficiently but also become self-sustaining over time.
Box (2): Basic Services to the Urban Poor - Objectives and components Admissible components include:
1. Integrated development of slums, i.e., housing and development of infrastructure projects in the slums in the identified cities.
2. Projects involving development/improvement/maintenance of basic services to the urban poor. 3. Slum improvement and rehabilitation projects.
4. Projects on water supply/sewerage/drainage, community toilets/baths, etc. 5. Houses at affordable costs for slum dwellers/ urban poor/EWS/LIG categories. 6. Construction and improvements of drains/storm water drains.
7. Environmental improvement of slums and solid waste management.
8. Street lighting.
9. Civic amenities, like community halls, child care centers, etc. 10. Operation and maintenance of assets created under this component.
11. Convergence of health, education and social security schemes for the urban poor
Source:(Ministry of Housing and Urban Poverty Alleviation, 2004 )
Box (3): Integrated Housing & Slum Development Programme - Objectives and coverage
Integrated Housing & Slum Development Programme aims at combining the existing schemes of VAMBAY (Valmiki Ambedkar Awas Yojana) is a Center-State partnership scheme to provide homes and improve the living conditions of the slum households) and NSDP (National Slum Development Programme) under the new IHSDP Scheme for having an integrated approach in ameliorating the conditions of the urban slum dwellers who do not possess adequate shelter and reside in dilapidated conditions. The scheme is applicable to all cities and towns as per 2001 Census except cities/towns covered under Jawaharlal Nehru National Urban Renewal Mission (JNNURM) The scheme seeks to enhance public and private investments in housing and infrastructural development in urban areas.
The basic objective of the Scheme is to strive for holistic slum development with a healthy and enabling urban environment by providing adequate shelter and basic infrastructure facilities to the slum dwellers of the identified urban areas.
The scheme coverage includes:
1. The scheme will apply to all cities/towns, excepting cities/towns covered under JNNURM. The target group under the scheme is slum dwellers from all sections of the community through a cluster approach.
2. Allocation of funds among States will be on the basis of the States’ urban slum population to total urban slum population in the country.
3. States may allocate funds to towns/cities basing on similar formula. However, funds would be provided to only those towns and cities where elections to local bodies have been held and elected bodies are in position.
4. The State Governments may prioritize towns and cities on the basis of their felt-need. While prioritizing towns, States would take into account existing infrastructure, economically and socially disadvantaged sections of the slum population and difficult areas.
Source: MoHUPA, 2009.
2.9 Current plans and visions in Urban development
It is estimated that the share of urban population may increase to about 40 per cent of the total population by 2020-21 (MOF, 2008). Such projections of urban population surge in the coming decade and the inability of the existing infrastructure of the selected cities to support the influx of the migration in the cities necessitate allocation of more funds for the infrastructure development and capacity building of the smaller cities, small and medium towns. Traditionally, the urban infrastructure in India has been financed through mix of the following (Vaidya, et.al, 2008):
Budgetary allocations from Municipality’s own revenues Grants from state government
Borrowing from insurance companies and specialised national level institutions like HUDCO and state level financial institutions
Limited borrowings from banks/FIs
Limited investments by the ULBs themselves through their internal resources.
Since public funds for these services are inadequate, ULBs have to look for alternative sources for financing their infrastructure costs. Several ULBs and utility organizations have issued bonds and have so far mobilized over Rs.12,000 million through taxable bonds and the figure continues to grow (Vaidya et al., 2008).
(MoUD). The scheme is categorized into two broad segments viz., the sub-mission on Urban Infrastructure Governance (UIG) and the sub-mission on Basic Services to the Urban Poor (BSUP), covering 63 cities comprising mega, metro, capital and cities of heritage and historical significance. A provision of Rs. 500 billion has been made as Central assistance for the entire JNNURM for a period of seven years beginning from 2005-06.
While the Central Government has gone about allotting the functions and management of the schemes as envisaged in JNNURM, it has also set forth two sets of mandatory reforms. Core reforms at the ULB/parastatal level aim at process reengineering through use of appropriate technology to enable more efficient, reliable and timely services in a transparent way. The other set of reforms pertains to the State level.
The ULBs’ reform covers, among others, adoption of modern, accrual-based double entry system of accounting in urban local bodies/para-statals, introduction of system of e-governance using information technology, reform of property tax with GIS so that it becomes a key source of revenue for ULBs and arrangements for its efficacious implementation so that collection efficiency reaches 85 per cent within next seven years and levy of reasonable user charges by ULBs with the remit to cover full cost of operation and maintenance or recurring cost is collected in seven years.
2.10 JNNURM progress in Surat & Indore:
Surat and Indore have identified number of infrastructural projects to be funded under JNNURM. As per the available data (JNNURM, 2009) projects worth Rs. 18.4 billion has been approved for Surat while Rs. 6.35 billion has been approved for Indore for urban infrastructure development. The number of sanctioned projects is 25 for Surat while Indore has got approval for 9 major projects.
Slum up-gradation (housing projects) in Surat & Indore (BUSP, IHSDP):
Apart from the EWS (Economically weaker section) housing scheme, provision for construction of new houses for the urban poor has been made under BUSP and IHSDP. While the total amount approved for Surat is Rs. 6.12 billion (only for BUSP), Indore has been approved a sum of Rs. 2.97 billion (including BUSP and IHDSP). The recurrent emergence of new slums especially in the vulnerable zones of the city continues to remain as one of the major challenge for the respective city administration. Surat Municipal Corporation (SMC) has incorporated this into its revenue generation plan which involves relocation of the slum population from the prime areas; followed by slum demolition and development of infrastructure. On the other hand, Indore Municipal Corporation (IMC) has received major support under MPUSP (DFID Funded Project), where the up-gradation of facilities in the notified slums is being done based on poverty matrix (the poorest of the slums being identified first).
2.11 Major issues of CC risks in urban environment
communities, who make up from a quarter to half of the population of most Indian cities (Satterthwaite et al., 2007).
There is some degree of certainty about the global changes as a result of climate change, there is agreement that these changes will be far from uniform, and in all probability are likely to affect the tropical countries more (IPCC, 2007). Moreover, the developing countries are likely to be face bigger impacts as usually these countries have less capacity and resources to face the changes. The first-order impacts (change in temperature and precipitation) have been extrapolated using regional models (Kumar et al., 2006) and there have been other studies that have examined the likely changes in the available water resources by modeling of river basins.
India has medium risk exposure, but high vulnerability due to climate change. It is expected that climate change will both intensify the current risks India faces, and also lead to some new hazards like sea level rise (DEFRA, MoEF). Climate change in India represents an additional stress on ecological and socioeconomic systems that are already facing tremendous pressures due to rapid urbanization, industrialization, and economic development. With its large and growing population, and an economy that is closely tied to its natural resource base, India’s population is vulnerable to the impacts of climate change such as changes in forest and water resources and sea level rise (DEFRA, UK). Climate change is likely to increase vulnerability of the already weak groups.
One of the areas which had emerged in the discussion forum in several cities is increasing water crisis. With the projected population growth statistics and increasing usage of water resource for daily consumption, there will be more pressure on the already strained centralized water supply systems of urban areas. With resources drying out in the city due to pollution/closing down of local surface water sources and over-exploitation of ground-water use, cities across the country are now dependent on regional water-sheds and distant source based supply schemes. The urban water supply and sanitation systems in several cities are suffering from increasing demand-supply gap, inadequate rainfall, and inadequate levels of service, poor sanitary conditions and worsening performance.
Droughts: This is the single largest risk to India. Its direct impacts on cities are likely to be water crisis and rise in food and bio-mass prices. Possible second order impacts include reduced demand for urban produced goods and migration. (Revi, 2008)
Flooding and Inundation: There is likelihood of increased frequency of urban flooding due to both fluvial (River induced) and pluvial (local rain induced) flooding due to increase in extreme rainfall events. Moreover, heavy rainfall in other places might cause a flooding downstream as a result of water release from water reservoirs upstream as experienced in Surat in 2006 and in parts of Delhi in August 2008. This flooding is exacerbated in almost all cities because of pattern of development: riverfront development projects that reclaim land and reduce the river channels (Ahmedabad), construction on small creeks and rivulets (Surat), severe loss of tree cover, and also increase in area of hard paving. While the Mumbai floods in 2005 hit the headlines across the globe, it is becoming increasingly common for parts or whole cities to come to a standstill after a heavy rainfall burst of two to three hours.
Water Crisis: This is likely to be the biggest problems faced by the cities in the future both on account of the above factors as well as other factors like rising costs of energy. Water management is going to be critical in the future because more rainfall in short, intense spells means more run-off. Urban population growth without adequate provisions for water, increasing per capita water demands are already leading to ground water exploitation through individuals and communities. Water scarcity is also an issue as some cities like Bangalore, Hyderabad and Indore pump their water from distant sources (and from lower altitudes), and it remains to be seen whether the municipal corporations can contend with the steadily rising energy costs. Other than water scarcity, there is likely to be problems with water quality. Most cities do not have sufficient sewerage network and sewage treatment leading to increased pollution of groundwater. Some places like Pondicherry and Surat are already experiencing some degree of salt ingress.
Sea Level Rise: India has an extensive low-lying densely populated coastal zone and hence any rise in sea level rise is likely to result in various problems like loss of land, ingress of salt water and ground water contamination. The coastal zone is densely populated and many large cities are located on the coast, especially in the western coast. Some cities are likely to get partially submerged if the sea level rises. According to a study led by International Institute for Environment and Development (IIED), India has the second largest (after China) population in the Low Coastal Elevation Zone1. It has nearly 6 percent of the world’s population in the LECZ zone. The stretches along the western Indian coast that are most vulnerable to SLR are Khambhat and Kachchh in Gujarat, Mumbai and parts of the Konkan coast, and South Kerala. Low lying parts of the deltas of the Ganga, Krishna, Godavari, Cauvery and Mahanadi on the east coast are expected to be lost, along with significant settlement areas and irrigated land and a number of urban settlements that are situated there (McGranahan, 2007).
Cyclones and Storm Surges: The east coast of India is more at risk as the frequency of cyclones is more in the Bay of Bengal than the Arabian Sea but it is West Coast that is dotted with some of India’s most populated and big coastal cities. The problem is compounded by huge amount of investment along coastlines in some coastal cities, without sufficient forethought about sea level rise and cyclone.
is likely to widen in northern and western states and shorten in the southern states (Bhattacharya, 2006). While the total number of population affected may not increase substantially, the shifting patterns are likely to increase the vulnerability of the populations at risk in new areas. Moreover, there is every possibility of water borne diseases increasing in the vulnerable populations due to prolonged water logging, especially in the cities with poor drainage and sewerage. More detailed studies on exploring these linkages are required.
Migration: Droughts, changing crop patterns, loss of livelihoods etc. are likely to result in huge migration from rural to urban areas. This might lead to further stress on urban infrastructure and services that are already spread thin. A bulk of this population is likely to be the poor who will migrate to cities in hope of getting absorbed into India’s large informal sector (Revi, 2008).
The recent published India-Urban Poverty Report (2009) finds that the incidence of migration in India has shown an increase since 2001 as compared to consistent decline during 1961-1991. The economic motive remains the main reason for migration among male interstate migrants. Economically backward states keep losing people to developed states. Poverty incidence was found less among urban to urban migrants as compared to non-migrants, but it was higher among rural to urban migrants. Even though, middle and higher income groups show higher propensity to move, their numbers are larger than the poor migrants. The most successful group of migrants is urban to urban migrants in terms of type of occupation they have and their income levels due to better education and skills they possessed. Influx of migration towards metropolitan cities indicates that economic reforms have not been able to create much employment opportunities in small and medium towns and in rural areas.
In India, the critical populations and elements most at risk in a typical city are:
slum, squatter and migrant populations resident in traditional and informal settlements, which are often located in the most vulnerable locations;
industrial and informal service-sector workers, whose occupations place them at significant risk, which is then accentuated by additional stressors such as climate change;
buildings, especially traditional and informal housing stock, that are especially vulnerable to wind, water and geological hazards;
industrial units, their in-house infrastructure, plant, machinery and raw materials; lifeline public and private infrastructure, which includes: roads, bridges, railways, ports, airports and other transportation systems; water, sewage and gas pipelines; drainage, flood and coastal defense systems; power and telecommunications infrastructure and critical social infrastructure such as hospitals, schools, fire-service, police-station and first responder’s infrastructure;
3 VULNERABILITY ASSESSMENT 3.1 Objectives
Main objective of the vulnerability assessment is to understand different facets of risks and quantify the components of vulnerability across the study cities to inform adaptation framework focused on poor and vulnerable urban residents.
3.2 Components of vulnerability in urban context
The Sustainable livelihood framework provides a sound basis for analysis of vulnerability. It defines five capitals which control the livelihoods of poor namely physical, human, financial, social and natural capitals. While SLF has been extensively for rural conditions, it can be adapted to urban context also, with few modifications.
In the current vulnerability analysis, the SLF has been modified with three most important capacities including income stability, education (proxy for human capital) and Social capacity. Similarly the major components were used for defining vulnerability namely: Physical infrastructure access, loans or lack of insurance and location based vulnerability to resources/risks as either flood/water logging (in case of Surat) or water scarcity (in case of Indore). The capacities were separated from vulnerabilities since the former provide the resilience while the latter increase the impacts during slow and fast onset disasters. The following Table (1) presents the set of indicators used in the study.
The main purpose of using capacity vulnerability indicators were to get a comparative situation across the samples and homogenous polygons using available information from the household and community level surveys. The following Table (2) presents the survey data sets used to calculate the capacity and vulnerability indices
Table (2): Data sets used for deriving capacity and vulnerability indicators
Indicator Data used Weightage Comments
Education index
Maximum education in the household and aggregated as average community level increases capacity to earn and also empowers next generation to benefit from education
Income Per capita income, ratio of Equal weightage to all three Income stability provides Table (1): Set of Indicators
Sl. No.
Livelihood
capitals Proxy indicators used Comments
1 Human Education Capacity
2 Social Social networks and access Capacity
3 Financial
Income stability (size of incomes, ratio of stable
incomes to total, dependency ratio) Capacity
Loans or lack of insurance Vulnerability
4 Physical Lack of Physical infrastructure access (water supply,
sewerage, roads) Vulnerability
5 Natural Water scarcity (separate from infrastructure)/floods Vulnerability
stability index stable and unstable incomes, dependency ratio.
factors resilience during disasters,
and ability to invest in in settlement, membership of households in these groups, access to political leadership, benefits derived
Equal weightage to all four factors
Capacity to acces the network critical in group level
Loans taken, Lack of insurance Equal weightage Higher the loans, the households will not be able to invest in adaptations, Lack of insurance results in most of the damages borne by the
drainage, sewerage facilities within the settlement
Scores for different types of drainage and sewerage sources, Average lpcd collected, Max distance of source during scarce period, Water supply frequency, time required for water management during scarcity
Equal weightage Provides a snapshot of
scarcity situation during last floods, duration of inundation
Equal weightage Provides snapshot of
flood/waterlogging events faced by the household as well as possible risk.
Source: TARU analysis, 2009
The details of Scoring is provided in the Annexure (B)
3.3 Methodology and tools
GIS enabled sampling and aggregation method was used to analyse the vulnerability. This method pioneered by TARU in Lucknow for infrastructure and services deficiency analysis was adapted for the Vulnerability analysis. This method involves delineation of the whole city in to homogeneous polygons based on roof types, density, road width and other visually distinct parameters. For example, in Indore 945 polygons were drawn with average polygon area of 10 ha. Latest satellite imagery of 1 m resolution was used to draw the polygons in a GIS platform. Attributes including, type of houses average number of stories, type of resident socioeconomic classes were collected through a GPS enabled reconnoiter across the whole city. The basis for visual interpretation method is presented in the Annexure (C). Samples were selected based on these attribute data.
FIG. (2) : GIS BASED VULNERABILITY ANLAYSIS FRAMEWORK
Source: TARU Analysis (2009)
Along with the household and community survey, a small area (Geopsy) was sampled to obtain density of households as well as basic infrastructure details. The outputs from the analysis were used to aggregate the household survey results to the polygons and to comparable polygons in the neighborhoods. This aggregated data can be done at various levels upwards, starting from polygon to administrative divisions or city levels.
3.4 Sample Coverage
In each of the two cities, about 1000 households and 100 settlements were covered under the survey. These samples were fairly distributed across socio economic classes over space. The GIS based aggregation provided universe estimates of households in the city area covered under the study. The original sample size of the survey was stratified with about 30% slums 30% lower class, 35% middle and mixed class and 5 percent upper class. This was done purposively to focus on slums and lower class.
The aggregation of analysed data was done with GIS using homogeneous polygons, which matches well with reported total city population. The overlay of notified slum locations over the homogeneous polygons indicate that a significant proportion of the lower class are included under notified slums. An area once notified as slums, the official classification generally does not change despite some improvements in housing and services.
Review of Urban Social Vulnerability assessment tools
The International Federations of Red Cross and Red Crescent Societies played a pivotal role by recognizing the importance of social vulnerability assessment and started a program called “The Vulnerability and Capacity Assessment”. After 1999, they realized the necessity of defining vulnerable people in their studies, and proved to be pioneering in taking it to the ground level.
The urban vulnerability analysis framework is still evolving and need significant contextualization of parameters and indicators. The progress over last decade in the approach is presented in the following Box (4).
Box (4): Evolution of vulnerability assessment methods
Cutter in his paper while doing the literature review of the vulnerability understanding and the impact assessment methods has mentioned the gradual evolution of the understanding of vulnerability.
The political ecology perspective emphasizes the social, economic & political pressure faced by the individual which ultimately decides the coping ability towards different hazards.
The pressure and release model suitable more for descriptive analysis rather than empirical testing insists on deep understanding of the vulnerability from root causes which further interacts with the natural events.
The hazard of place approach is considered more suitable for empirical testing and the use of geo spatial techniques. This approach includes both exposure and the social vulnerability in its analysis and relationship change over time and across space.
The vulnerability/ sustainability framework suggests and alterative measure of vulnerability, wherein the vulnerability to global change is assessed through local vulnerabilities. This approach has been considered to be suitable for qualitative assessments.
Source: Cutter et.al (2009)
The above mentioned models and approaches have played a pivotal role in shaping the vulnerability assessment methods in practice at present.
The IPCC Third Assessment Report (TAR) describes vulnerability as “The degree to which a system is susceptible to, or unable to cope with, adverse effects of climate change, including climate variability and extremes. Vulnerability is a function of the character, magnitude, and rate of climate variation to which a system is exposed, its sensitivity, and its adaptive capacity.” (IPCC, 2001). The second definition is in little conflict with the first definition suggested by IPCC which says, “degree to which a system is susceptible to injury, damage, or harm (one part - the problematic or detrimental part - of sensitivity)”.
Collection of data especially relating to the vulnerability assessment does not fall within the scope of the National decadal Census survey or any other survey done by the government in India. Over a decade, the structure and composition of the city changes (e.g. 60% decadal growth as noticed in Surat) as well as the vulnerability of the population. The availability of the secondary data is a huge plus though, for the GIS part, but capturing the complete urban vulnerability needs quantitative and qualitative surveys to collect real status at the ground level through sample surveys. Moreover, social vulnerability is very difficult to be quantified in terms of absolute or real values. These issues can be addressed to a certain level by developing indices for different variables covering detailed aspect of the various factors affecting the household and community at large.
of different types of vulnerabilities and the causative factors that are embedded into broader structural and political conditions, understanding evolution of vulnerability across space and time requires more effective tools. It does not, for instance, address how exposure to changing hazards evolves over time (Lankao et al., 2009).
Review of the literature suggests that vulnerability is understood to have two sides. First side is the external side of risk, shock or stress to which an individual or household is subject to; and the other side is the internal side which is defenselessness, means lack of coping without damaging loss (Haki et al., 2004).
One of the most important considerations, which all the vulnerability assessment methods found difficulty in addressing, is to use the outcome of these vulnerability assessments and using them to develop adaptation/risk mitigation plans to match real ground level issues in the urban areas. Moreover, methods for aggregating vulnerability from neighborhood level up-wards (especially in developing country context) are only beginning to emerge. So the decision makers at city level have no ready-made analytical tools for understanding or designing adaptation measures focused on ground level and are left with only option of using their qualitative knowledge. So quantifying the costs and benefits become a major issue for the decision makers.
The application of vulnerability analysis requires the integration of neighborhood level information on human, environmental and social parameters ranging from household to neighborhood levels and aggregation to city administrative subunits and city level. Also, ecological factors like terrain, distance from natural drainage that are embedded in the landscape contribute in different ways to the overall vulnerability pattern that modify risks as well as service levels (e.g. through water supply, drainage). These ecological factors reflect, in varying degrees, people’s resilience and ability to cope with and recover from losses. They also provide a means to understand differential vulnerability within and between urban places. These ecological factors are variable and modify the vulnerability, they do not hold a constant relationship among themselves, no two urban places are likely to be found that are identical in their vulnerabilities (Rashed et al., 2007). This makes the development of any single vulnerability assessment uniformly applicable to all the urban areas lying in a variety of ecological, social and economic contexts ineffective. Significant efforts are necessary for developing city specific indicators within a single generic framework. The five capitals defined under livelihoods framework provides such a platform. Since connection between urban livelihoods and natural resources is highly diverse, significant city level modifications are necessary for exploring natural capital related risks.
The present Vulnerability assessment by TARU has tried to amalgamate the issues from the field, and has tried to bring realistic methodology into analysis, starting from the household to community level to aggregate the results to the administrative zone and city levels. Starting from sum to parts (through RS and GIS methods) to select the representative samples followed by exploration of vulnerability from households upwards (from parts to sum) and validation of the key variables like population at city level are the key strengths of this method.
Methodology
Stakeholder Consultations to understand urban vulnerability patterns and validate methods